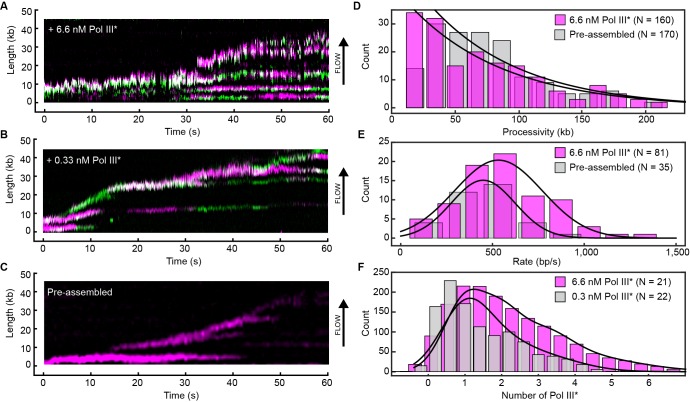
Figure 4. Rapid and frequent exchange of Pol III* is concentration dependent.
(A) and (B), Kymographs of the distributions of red Pol III* (magenta) and green Pol III* (green) on an individual DNA molecule at a total Pol III* concentration of 6.7 (A) or 0.3 nM (B). Co-localization of the two signals is shown as a bright white fluorescent spot. (C) Kymograph of a pre-assembled replisome containing red Pol III*. The intensity of the signal from the replisomal spot decreases after a Pol III* is left behind. It subsequently bleaches and the signal does not recover. (D) Histograms of the processivity of replication with Pol III* present in solution (73 ± 25 kb) and under pre-assembly conditions (76 ± 26 kb), each fit with a single exponential decay function. The errors represent the error of the fit. (E) Histograms of the rates of replication with Pol III* present in solution (561 ± 27 bp/s) and under pre-assembly conditions (445 ± 33 bp/s), each fit to a Gaussian distribution. (F) Histograms of the stoichiometry of Pol III* at the replication fork, fit to four (6.7 nM) or three (0.3 nM) Gaussians centered at integral numbers of Pol III* calculated from single Pol III core intensities (see Figure 4—figure supplement 4). The black lines represent the sums of these distributions. The errors in (E) and (F) represent the standard errors of the mean.
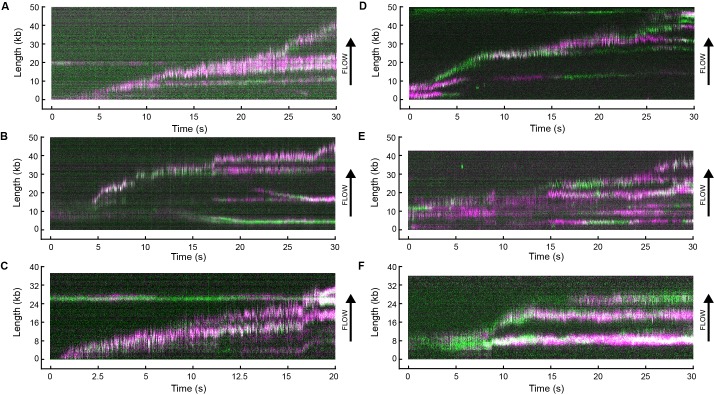
Figure 4—figure supplement 1. Example kymographs.
Figure 4—figure supplement 2. Processivity of replication challenged by Pol III core.
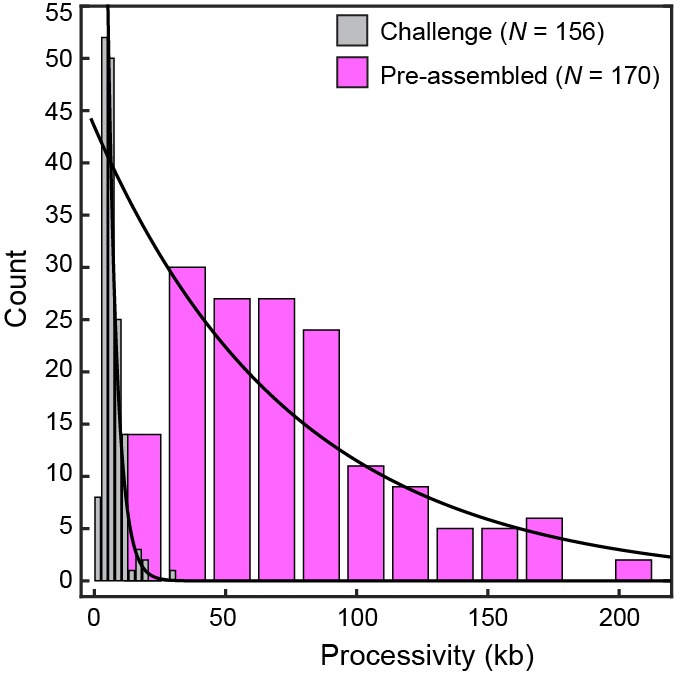
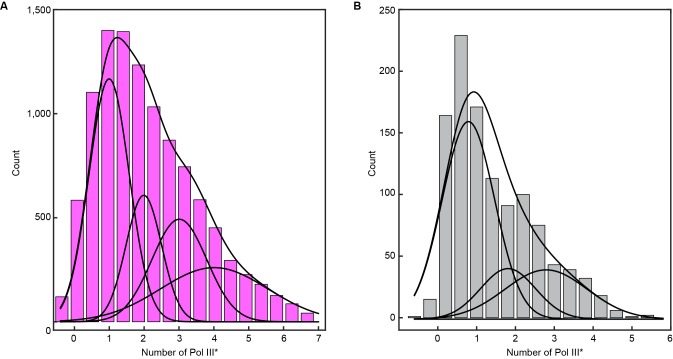
Figure 4—figure supplement 3. Histograms of the stoichiometry of Pol III* at the replication fork.
Figure 4—figure supplement 4. Histograms of the intensity distribution of single Pol III cores.
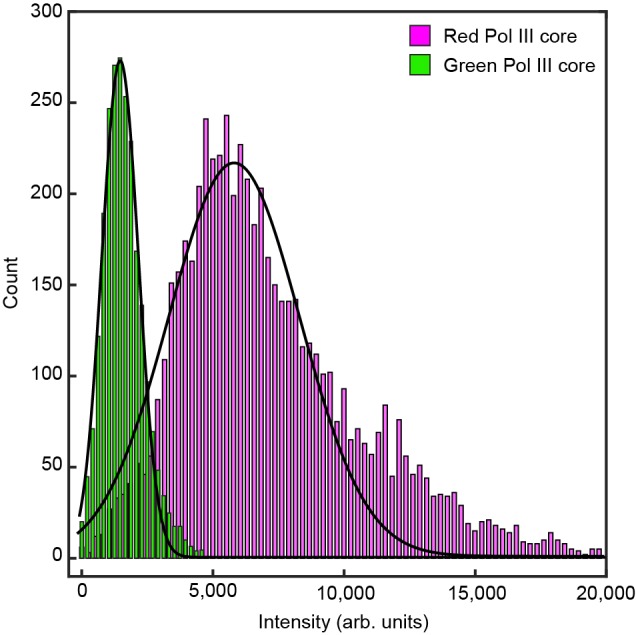
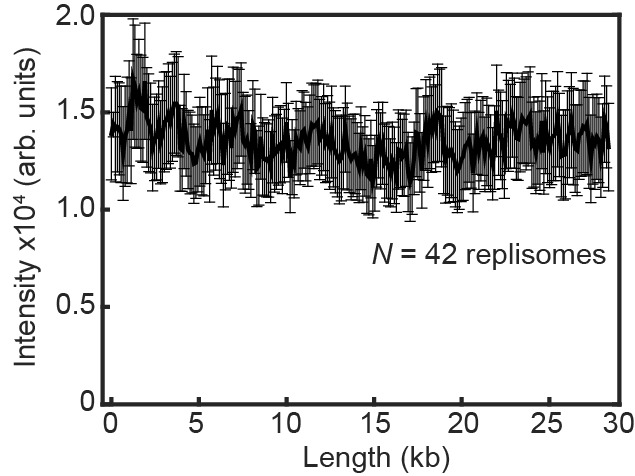
Figure 4—figure supplement 5. Fluorescence intensity of replicating Pol III* complexes does not change at longer DNA lengths under near-TIRF imaging conditions.
