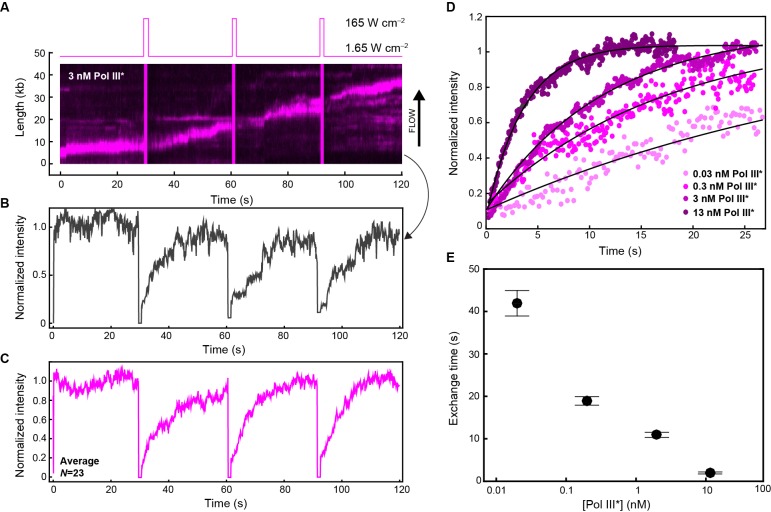
Figure 5. Quantification of Pol III* exchange time using single-molecule FRAP.
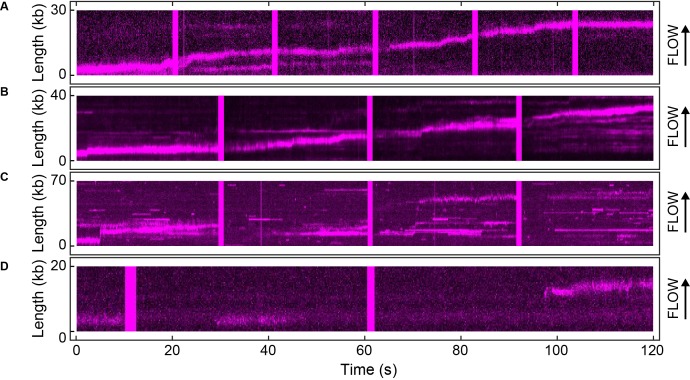
(A) (Top panel) Imaging sequence used during the FRAP experiments. Periodically, a FRAP pulse of high-laser power was used to rapidly photobleach all the Pol III* in the field of view. (Bottom panel) A representative kymograph of red Pol III*s at the replication fork. After each FRAP pulse (indicated by the magenta line), all Pol III*s have bleached, but the fluorescence intensity recovers as unbleached Pol III*s exchange into the replisome. (B) Normalized intensity over time for an individual replisome in the presence of 3 nM Pol III* in solution. (C) The average intensity over time from 23 replisomes with 3 nM Pol III* in solution. (D) The three recovery phases in (C) were averaged again to give the final averaged normalized intensity over time after a FRAP pulse. This curve was then fit to provide a characteristic exchange time. This was done for four concentrations of Pol III* ranging from 13 to 0.03 nM. (E) Exchange time as a function of Pol III* concentration.


