

Abstract
BACKGROUND
Patient‐reported outcomes (PROs) (eg, symptoms, functioning) can inform patient management. However, patients and clinicians often have difficulty interpreting score meaning. The authors tested approaches for presenting PRO data to improve interpretability.
METHODS
This mixed‐methods study included an Internet survey of cancer patients/survivors, oncology clinicians, and PRO researchers circulated via snowball sampling, plus individual in‐person interviews. Clinical importance was conveyed using 3 approaches (presented in random order): normal score range shaded green, concerning scores circled in red, and red threshold lines indicating normal versus concerning scores. Versions also tested 2 approaches to score directionality: higher = more (better for function, worse for symptoms) and higher = better for both function and symptoms. Qualitative data from online comments and in‐person interviews supplemented quantitative results on interpretation accuracy, clarity, and the “most useful” format.
RESULTS
The survey included 1113 respondents: 627 survivors, 236 clinicians, and 250 researchers, plus 10 patients and 10 clinicians who were purposively sampled interviewees. Interpretation accuracy ranged from 53% to 100%. The formats in which higher = better were interpreted more accurately versus those in which higher = more (odds ratio [OR], 1.30; 95% confidence interval [CI], 1.07‐1.58) and were more likely to be rated “very”/“somewhat” clear (OR, 1.39; 95% CI, 1.13‐1.70) and “very” clear (OR, 1.36; 95% CI, 1.18‐1.58). Red circle formats were interpreted more accurately than green‐shaded formats when the first format presented (OR, 1.29; 95% CI, 1.00‐1.65). Threshold‐line formats were more likely to be rated “very” clear than green‐shaded (OR, 1.43; 95% CI, 1.19‐1.71) and red‐circled (OR, 1.22, 95% CI, 1.02‐1.46) formats. Threshold lines were most often selected as “most useful.”
CONCLUSIONS
The current results support presenting PRO data with higher = better directionality and threshold lines indicating normal versus concerning scores. Cancer 2017;123:1848–1859. © 2017 The Authors. Cancer published byWiley Periodicals, Inc. on behalf of American Cancer Society. This is an open access article under the terms of the Creative Commons Attribution‐NonCommercial‐NoDerivs License, which permits use and distribution in any medium, provided the original work is properly cited, the use is non‐commercial and no modifications or adaptations aremade.
Keywords: cancer, clinical practice, interpretation, patient management, patient‐reported outcomes
Short abstract
Patient‐reported outcomes (PROs) (eg, symptoms, well being) can be used for patient management and monitoring. This study informs best practices for displaying PRO results so that patients and clinicians can understand what the scores mean.
INTRODUCTION
In oncology clinical practice, patients are increasingly completing standardized patient‐reported outcome (PRO) questionnaires about their symptoms, functioning, and well being, and these PRO data are being used along with other clinical information to screen for conditions, monitor progress, and inform patient management.1, 2 The use of PROs in clinical practice improves patient‐provider communication3, 4, 5, 6 and can also improve problem detection, management, and outcomes.3, 5, 6, 7, 8, 9, 10, 11, 12 Several recent studies have even demonstrated improved survival with PRO monitoring.12, 13
For PRO data to be useful in clinical practice, patients and clinicians need to understand what the scores mean. PRO scores can be difficult to interpret, because there are many different PRO questionnaires14 and no standardization in scoring, scaling, or graphical presentation. PRO questionnaires vary in whether higher scores represent better outcomes, worse outcomes, or “more” of what is measured (better for function, worse for symptoms). Some PROs are scaled from 0 to 100, with the best/worst outcomes at the extremes; whereas others are normed to, for example, a population average of 50. Approaches for presenting the data include line graphs of scores over time,15 tabulated data,16 bubble plots of scores at a single timepoint,5 and heat maps.17 This variability leads to difficulty in interpreting the PRO scores.18, 19
We previously investigated formats for individual patient PRO data presentation as part of a larger research agenda.20 Both patients and clinicians preferred line graphs of scores over time compared with other tested formats.20 However, 2 key interpretation challenges emerged: 1) the directionality of scoring (whether higher = more or higher = better) and 2) highlighting possibly concerning scores (clinical “alerts”). Using an innovative, iterative approach, we partnered with research participant volunteers to develop formats to address these interpretation challenges.21 The objective of the current study was to evaluate these formats.
MATERIALS AND METHODS
Study Design
This mixed‐methods study included an Internet survey that was circulated to broad samples of cancer survivors, oncology clinicians, and PRO researchers (not necessarily cancer‐focused), plus 1‐on‐1, in‐person interviews with survivors and clinicians. In‐person interviewees completed the Internet survey while verbalizing thoughts and responding to prompts. We evaluated the interpretation accuracy and clarity of different approaches for highlighting possibly concerning scores and for dealing with score directionality (ie, higher = more vs higher = better).
In total, there were 6 survey versions. Each version presented 3 line‐graph formats for displaying individual patient PRO scores on physical function, emotional function, fatigue, and pain (Fig. 1): green‐shaded normal range, red‐circled possibly concerning scores, and red threshold‐lines between normal and concerning scores. Although the figures were presented in color, they were also designed to be interpretable in grayscale. On the basis of our previous research,20, 21 all 3 formats included y‐axis labels (eg, from “none” to “severe” for symptoms; from “very poor” to “very high” for function) along with the numeric scores. Explanations for how to interpret an upwardly trending line were included under the domain labels. We presented the formats in 3 different orders (assigned randomly), such that each format was presented first, second, or third, depending on the version. In addition, one‐half of the sample was randomized to formats with higher = more (better for function, worse for symptoms) and one‐half was randomized to formats with higher = better (Fig. 2, Supporting Figs. 1 and 2), such that respondents received either the “more” or “better” versions of the formats, but not both.
Figure 1.
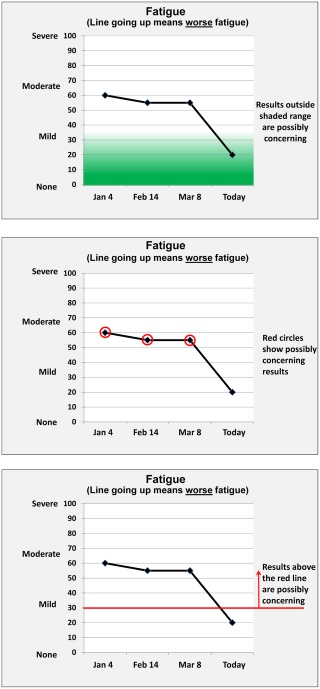
Examples of the 3 formats tested are illustrated: green shading, red circles, and threshold line.
Figure 2.

Examples of (a) higher indicating “more” and (b) higher indicating “better” are illustrated using the threshold‐line format.
Population and Settings
Internet survey
The Internet survey was conducted in adult cancer survivors, cancer clinicians, and PRO researchers. Participants selected the category they most closely identified with: PRO researcher, health care provider to adult patients with cancer, or cancer patient/survivor. Participants who selected “none of the above” were excluded. There were no other eligibility criteria, but the survey was in English only.
Survey participants were recruited in partnership with our Stakeholder Advisory Board, using e‐mail lists and associations of cancer patients (eg, Stupid Cancer), oncology clinicians (eg, MDRing), and PRO researchers (eg, International Society for Quality of Life Research). We used snowball sampling, whereby respondents were invited to share the survey link with anyone they thought might be eligible and interested. The instructions noted that participation was voluntary and that survey completion represented consent to participate. The Internet survey was deemed exempt by the Johns Hopkins School of Medicine Institutional Review Board. There was no target sample size. Participants could enter for a chance at a $100 Amazon gift card.
In‐person interviews
To supplement the Internet survey, we conducted 1‐on‐1, in‐person interviews with cancer survivors and clinicians recruited from the Johns Hopkins Clinical Research Network, a mid‐Atlantic consortium of academic and community health systems. The in‐person interviews were conducted concurrently with the Internet survey.
Survivor participants were aged ≥21 years, had been diagnosed with cancer (except nonmelanoma skin) ≥6 months previously, were not currently receiving acute treatment, were able to communicate in English, and had known education status. We purposively sampled to ensure ≥10% of the sample had less than a college degree and so that sample recruitment was ≥30% from Johns Hopkins and ≥30% from the other sites.
Clinician participants had to be actively involved in treating adult cancers (medical oncologists, radiation oncologists, surgical oncologists, gynecologic oncologists/urologists, oncology nurse practitioners/physician assistants, oncology fellows). We purposively sampled to have ≥1 clinician from each specialty, with ≥30% from Johns Hopkins and ≥30% from the other sites.
The in‐person interview protocol was reviewed and approved by the Johns Hopkins School of Medicine Institutional Review Board, and survivor and clinician participants provided written informed consent. We aimed to recruit 10 survivors and 10 clinicians, with the option to continue recruiting if thematic saturation had not been achieved. All participants received a $35 gift card.
Survey Content and Study Conduct
Instructions described the use of individual patient PRO data for patient management and informed participants that they would see different ways of displaying PRO data. Participants then viewed the 3 formats in random order. For the first format, the data shown and questions asked were constant—the only difference was whether the data were displayed using green shading, red circles, or threshold lines. Similarly, the data and questions for the second and third formats were the same across versions, but different from each other. A screen warned of changes to the data between formats. The only difference in the survey versions with higher = more formats versus higher = better formats was the directionality on the y‐axis (Fig. 2, Supporting Figs. 1 and 2); the data and questions were the same.
For the first format, 2 questions assessed directionality interpretation accuracy (ie, do the data show the patient is getting better or worse), 1 question assessed participants' ability to identify a 10‐point score change (to ascertain respondents' ability to identify clinically important changes), and 1 question assessed ability to identify scores highlighted as possibly concerning. Participants rated the format on a 4‐point scale from “very confusing” to “very clear” and could provide free‐text comments. The second and third formats each had 1 question about directionality, 1 question about concerning scores, the clarity rating, and the comment field. At the end of the survey, participants were asked to select the most useful format and to comment on their choice. The survey was pilot‐tested before fielding, and the estimated completion time was from 5 to 10 minutes.
For the in‐person interviews, survivor and clinician participants completed the Internet survey in the presence of a research coordinator. In these audio‐recorded encounters, participants verbalized their thoughts while completing the survey and in response to prompts. The audio‐recordings were transcribed and coded in Atlas.ti by 1 researcher and reviewed by a second. The codebook was developed based on the formats and directionality, such that comments were coded based on whether they referred to, for example, green shading, and/or to the interpretation of lines trending up or down.
Analysis
Sample characteristics were summarized descriptively, as were the interpretation accuracy items and clarity ratings for each of the 6 formats. After the descriptive summaries, statistical testing was conducted for interpretation accuracy and clarity ratings using multivariable logistic regression models. Specifically, we calculated odds ratios for the association between format (green shading, red circles, threshold lines), directionality (higher = more vs higher = better), and respondent type (survivor, clinician, or researcher) for accuracy and clarity. Twelve items evaluated the first format presented: 2 questions evaluated directionality, 5 response options (check all that apply) evaluated the interpretation of “possibly concerning scores,” and 5 response options evaluated the interpretation of a “10‐point change.” Regression models used generalized estimating equations with the respondent as the cluster unit. We also examined all 24 accuracy items, including questions about the format when it was the first, second, or third presented, thus including all respondents. These multivariable models also included a fixed effect for each of the 24 items. For the clarity measures, we analyzed the number of respondents who rated each format “very” or “somewhat” clear and only “very” clear using a similar modeling approach. Finally, we analyzed the proportion of respondents who selected each format as “most useful” using chi‐square tests. The qualitative data were analyzed in conjunction with a review of the survey data with the objective of explaining the responses generated. Team members reviewed the Atlas reports and an output of the online survey comments; 1 team member took the lead in summarizing emergent themes, and other team members provided additional input.
RESULTS
Sample Description
The survey was completed by 1113 respondents (Table 1). The mean age of survivors (n = 627) was 59 years, 85% were women, 96% were white, 20% had less than a college degree, and 56% had survived breast cancer. The mean age of clinicians (n = 236) was 45 years, 44% were medical oncologists, and they had been in practice for an average of 17 years. The mean age of researchers (n = 250) was 46 years, and 45% had >10 years of experience. Of the 10 in‐person patient interviewees, 30% were breast cancer survivors, 70% were recruited from Johns Hopkins, and 30% had less than a college degree. The 10 clinician interviewees included at least 1 participant from each medical specialty, and 40% were from Johns Hopkins.
Table 1.
Sample Characteristicsa
| No. of Respondents (%) | |||
|---|---|---|---|
| Characteristic | Survivors, n = 627 | Clinicians, n = 236 | Researchers, n = 250 |
| Age: Mean ± SD, y | 59.1 ± 11.81 | 45.1 ± 12.57 | 45.6 ±12.72 |
| Men | 76 (14.7) | 85 (41.5) | 64 (28.2) |
| Race | |||
| White | 494 (95.6) | 150 (73.2) | 193 (84.6) |
| Black/African‐American | 8 (1.5) | 4 (2) | 4 (1.8) |
| Asian | 10 (1.9) | 38 (18.5) | 19 (8.3) |
| Other | 5 (1) | 13 (6.3) | 12 (5.3) |
| Hispanic | 14 (2.7) | 11 (5.4) | 12 (5.3) |
| Country | |||
| United States | 462 (89) | 108 (52.9) | 101 (45.3) |
| Education | |||
| <High school graduate | 4 (0.8) | ||
| High school graduate | 29 (5.6) | ||
| Some college | 70 (13.5) | ||
| College graduate | 192 (37) | ||
| Any postsecondary work | 224 (43.2) | ||
| Cancer type, all that apply | |||
| Breast | 348 (55.5) | ||
| Bladder | 42 (6.7) | ||
| Colorectal | 37 (5.9) | ||
| Prostate | 29 (4.6) | ||
| Gynecological | 26 (4.1) | ||
| Other | 111 (17.7) | ||
| Time since diagnosis, y | |||
| <1 | 26 (5.1) | ||
| 1‐5 | 224 (43.6) | ||
| 6‐10 | 124 (24.1) | ||
| ≥11 | 140 (27.2) | ||
| History of cancer | 18 (8.8) | 13 (5.7) | |
| Provider specialty | |||
| Medical oncology | 90 (43.9) | ||
| Radiation oncology | 20 (9.8) | ||
| Surgical oncology | 20 (9.8) | ||
| Gynecologic oncology/urology | 2 (1) | ||
| Oncology nurse practitioner/physician assistant | 17 (8.3) | ||
| Other | 56 (27.3) | ||
| Provider years in practice: Mean ± SD | 17.0 ± 11.90 | ||
| PRO researcher expertise, all that apply | |||
| Patient perspective | 34 (13.6) | ||
| Clinician | 25 (10) | ||
| Clinician‐scientist | 54 (21.6) | ||
| PRO assessment/psychology/sociology | 128 (51.2) | ||
| Clinical trial methods/analysis | 63 (25.2) | ||
| Psychometrics | 72 (28.8) | ||
| Policy/public health | 47 (18.8) | ||
| Journal editor | 9 (3.6) | ||
| Frequent journal reviewer | 56 (22.4) | ||
| Regulator/health administrator | 2 (0.8) | ||
| Other | 23 (9.2) | ||
| PRO research experience | |||
| Student | 20 (8.8) | ||
| Postdoctorate | 18 (7.9) | ||
| <5 y | 35 (15.4) | ||
| 5‐10 y | 53 (23.2) | ||
| >10 y | 102 (44.7) | ||
Abbreviations: PRO, patient‐reported outcomes; SD, standard deviation.
Demographic data were missing for 108 to 110 survivors, 31 to 34 clinicians, and 22 to 27 researchers, depending on the question.
Accuracy of Interpretation
Directionality
Interpretation accuracy was high across formats (Table 2). The proportion responding correctly across the 4 directionality items ranged from 82% to 99% for survivors, from 80% to 100% for clinicians, and from 74% to 100% for researchers. The qualitative comments suggested that some formats were helpful in identifying whether higher scores were good or bad. For example, the green shading made it, “apparent even without reading indicators of ‘line going up means worse,’ which areas were good, which areas were bad, which areas were concerning,”; although others thought that, “having the graph in the shaded area would mean worse, like the ‘danger zone’.” The threshold lines were considered “…helpful, especially with the arrow reinforcing the direction of ‘concerning’,” although others noted, “you have to pay attention… where the instructions say results above or below…”
Table 2.
Accuracy of Interpretation for Directionality
| No. of Respondents (%) | ||||||
|---|---|---|---|---|---|---|
| Question | Green Shading: “More” | Red‐Circles: “More” | Threshold Line: “More” | Green Shading: “Better” | Red Circles: “Better” | Threshold Line: “Better” |
| Survivors | ||||||
| First format | N = 104 | N = 104 | N = 105 | N = 105 | N = 104 | N = 105 |
| Physical | n = 96 | n = 95 | n = 98 | n = 93 | n = 93 | n = 98 |
| Better | 6 (6.2) | 10 (10.5) | 6 (6.1) | 4 (4.3) | 9 (9.7) | 11 (11.2) |
| Worse b | 87 (90.6) | 82 (86.3) | 86 (87.8) | 84 (90.3) | 84 (90.3) | 83 (84.7) |
| Not sure | 3 (3.1) | 3 (3.2) | 6 (6.1) | 5 (5.4) | 0 (0) | 4 (4.1) |
| Pain | n = 92 | n = 92 | n = 95 | n = 91 | n = 92 | n = 96 |
| Better | 10 (10.9) | 9 (9.8) | 11 (11.6) | 8 (8.8) | 6 (6.5) | 10 (10.4) |
| Worse b | 80 (87) | 82 (89.1) | 83 (87.4) | 80 (87.9) | 83 (90.2) | 84 (87.5) |
| Not sure | 2 (2.2) | 1 (1.1) | 1 (1.1) | 3 (3.3) | 3 (3.3) | 2 (2.1) |
| Second format | N = 105 | N = 104 | N = 104 | N = 105 | N = 105 | N = 104 |
| Emotional | n = 90 | n = 88 | n = 85 | n = 91 | n = 87 | n = 90 |
| Better | 5 (5.6) | 3 (3.4) | 3 (3.5) | 4 (4.4) | 2 (2.3) | 1 (1.1) |
| Worse b | 81 (90) | 81 (92) | 81 (95.3) | 85 (93.4) | 81 (93.1) | 85 (94.4) |
| Not sure | 4 (4.4) | 4 (4.5) | 1 (1.2) | 2 (2.2) | 4 (4.6) | 4 (4.4) |
| Third format | N = 104 | N = 105 | N = 104 | N = 104 | N = 105 | N = 105 |
| Fatigue | n = 84 | n = 90 | n = 88 | n = 89 | n = 90 | n = 87 |
| Better b | 72 (85.7) | 79 (87.8) | 72 (81.8) | 85 (95.5) | 89 (98.9) | 82 (94.3) |
| Worse | 10 (11.9) | 8 (8.9) | 15 (17) | 2 (2.2) | 0 (0) | 3 (3.4) |
| Not sure | 2 (2.4) | 3 (3.3) | 1 (1.1) | 2 (2.2) | 1 (1.1) | 2 (2.3) |
| Clinicians | ||||||
| First format | N = 39 | N = 40 | N = 39 | N = 39 | N = 40 | N = 39 |
| Physical | n = 35 | n = 36 | n = 35 | n = 37 | n = 40 | n = 36 |
| Better | 2 (5.7) | 1 (2.8) | 5 (14.3) | 2 (5.4) | 1 (2.5) | 2 (5.6) |
| Worse b | 33 (94.3) | 34 (94.4) | 29 (82.9) | 34 (91.9) | 38 (95) | 34 (94.4) |
| Not sure | 0 (0) | 1 (2.8) | 1 (2.9) | 1 (2.7) | 1 (2.5) | 0 (0) |
| Pain | n = 35 | n = 36 | n = 35 | n = 36 | n = 40 | n = 35 |
| Better | 2 (5.7) | 2 (5.6) | 4 (11.4) | 1 (2.8) | 2 (5) | 0 (0) |
| Worse | 33 (94.3) | 33 (91.7) | 31 (88.6) | 33 (91.7) | 37 (92.5) | 34 (97.1) |
| Not sure | 0 (0) | 1 (2.8) | 0 (0) | 2 (5.6) | 1 (2.5) | 1 (2.9) |
| Second format | N = 39 | N = 39 | N = 40 | N = 39 | N = 39 | N = 40 |
| Emotional | n = 33 | n = 35 | n = 35 | n = 33 | n = 34 | n = 40 |
| Better | 0 (0) | 0 (0) | 3 (8.6) | 0 (0) | 0 (0) | 0 (0) |
| Worse b | 31 (93.9) | 35 (100) | 32 (91.4) | 33 (100) | 31 (91.2) | 39 (97.5) |
| Not sure | 2 (6.1) | 0 (0) | 0 (0) | 0 (0) | 3 (8.8) | 1 (2.5) |
| Third format | N = 40 | N = 39 | N = 39 | N = 40 | N = 39 | N = 39 |
| Fatigue | n = 35 | n = 33 | n = 35 | n = 39 | n = 33 | n = 33 |
| Better b | 31 (88.6) | 31 (93.9) | 28 (80) | 38 (97.4) | 32 (97) | 32 (97) |
| Worse | 4 (11.4) | 2 (6.1) | 7 (20) | 1 (2.6) | 0 (0) | 1 (3) |
| Not sure | 0 (0) | 0 (0) | 0 (0) | 0 (0) | 1 (3) | 0 (0) |
| Researchers | ||||||
| First format | N = 41 | N = 42 | N = 42 | N = 42 | N = 42 | N = 41 |
| Physical | n = 38 | n = 39 | n = 41 | n = 41 | n = 41 | n = 38 |
| Better | 3 (7.9) | 2 (5.1) | 1 (2.4) | 2 (4.9) | 0 (0) | 2 (5.3) |
| Worse b | 35 (92.1) | 36 (92.3) | 39 (95.1) | 39 (95.1) | 40 (97.6) | 35 (92.1) |
| Not sure | 0 (0) | 1 (2.6) | 1 (2.4) | 0 (0) | 1 (2.4) | 1 (2.6) |
| Pain | n = 38 | n = 39 | n = 41 | n = 41 | n = 41 | n = 38 |
| Better | 4 (10.5) | 4 (10.3) | 3 (7.3) | 3 (7.3) | 0 (0) | 2 (5.3) |
| Worse b | 34 (89.5) | 35 (89.7) | 38 (92.7) | 38 (92.7) | 40 (97.6) | 36 (94.7) |
| Not sure | 0 (0) | 0 (0) | 0 (0) | 0 (0) | 1 (2.4) | 0 (0) |
| Second format | N = 42 | N = 41 | N = 42 | N = 41 | N = 42 | N = 42 |
| Emotional | n = 41 | n = 38 | n = 37 | n = 37 | n = 40 | n = 40 |
| Better | 0 (0) | 0 (0) | 0 (0) | 1 (2.7) | 1 (2.5) | 1 (2.5) |
| Worse b | 41 (100) | 38 (100) | 37 (100) | 34 (91.9) | 39 (97.5) | 39 (97.5) |
| Not sure | 0 (0) | 0 (0) | 0 (0) | 2 (5.4) | 0 (0) | 0 (0) |
| Third format | N = 42 | N = 42 | N = 41 | N = 42 | N = 41 | N = 42 |
| Fatigue | n = 37 | n = 41 | n = 38 | n = 40 | n = 36 | n = 40 |
| Better b | 30 (81.1) | 40 (97.6) | 28 (73.7) | 40 (100) | 36 (100) | 39 (97.5) |
| Worse | 6 (16.2) | 1 (2.4) | 10 (26.3) | 0 (0) | 0 (0) | 1 (2.5) |
| Not sure | 1 (2.7) | 0 (0) | 0 (0) | 0 (0) | 0 (0) | 0 (0) |
aN = total sample for that survey version; n = number with nonmissing responses to the question.
bThe answers in these rows were correct.
Clinical importance
The proportion of respondents correctly identifying the domains that changed >10 points ranged from 74% to 83% for survivors, from 80% to 98% for clinicians, and from 81% to 98% for researchers (Table 3). Survivors accurately identified possibly concerning scores 53% to 86% of the time, clinicians identified such scores 64% to 98% of the time, and researchers identified such scores 66% to 98% of the time. On the basis of the qualitative data, some respondents either did not notice or did not understand the indications of possibly concerning scores: for example, “Not sure why there is green shading. Does this represent something?” and “Not entirely sure about significance/meaning of red‐circles.” Other respondents indicated that they relied on their own judgment in deciding what was possibly concerning regardless of whether the graph highlighted it: “Pain is still within the green‐shaded area; but, since it looks like it's up trending, I'm still going to mark it as being concerning…” and “I also did fatigue, because it doesn't say that a lack of a red circle means there is no possible concerning results, and it looks like a significant increase in fatigue.”
Table 3.
Accuracy of Interpretation for Clinical Importance
| No. of Respondents (%) | ||||||
|---|---|---|---|---|---|---|
| Question | Green Shading: “More” | Red Circles: “More” | Threshold Line: “More” | Green Shading: “Better” | Red Circles: “Better” | Threshold Line: “Better” |
| Survivors | ||||||
| First format | N = 104 | N = 104 | N = 105 | N = 105 | N = 104 | N = 105 |
| Change >10 points | ||||||
| Physicala | 85 (81.7) | 85 (81.7) | 85 (81) | 83 (79) | 85 (81.7) | 86 (81.9) |
| Emotional | 4 (3.8) | 3 (2.9) | 2 (1.9) | 6 (5.7) | 4 (3.8) | 1 (1) |
| Fatiguea | 77 (74) | 84 (80.8) | 82 (78.1) | 82 (78.1) | 83 (79.8) | 80 (76.2) |
| Paina | 83 (79.8) | 85 (81.7) | 86 (81.9) | 81 (77.1) | 86 (82.7) | 87 (82.9) |
| None | 1 (1) | 2 (1.9) | 4 (3.8) | 3 (2.9) | 0 (0) | 7 (6.7) |
| Areas of concern | ||||||
| Physicala | 85 (81.7) | 83 (79.8) | 76 (72.4) | 83 (79) | 85 (81.7) | 89 (84.8) |
| Emotional | 2 (1.9) | 5 (4.8) | 11 (10.5) | 3 (2.9) | 3 (2.9) | 1 (1) |
| Fatigue | 43 (41.3) | 25 (24) | 30 (28.6) | 29 (27.6) | 30 (28.8) | 21 (20) |
| Paina | 85 (81.7) | 82 (78.8) | 85 (81) | 77 (73.3) | 89 (85.6) | 88 (83.8) |
| None | 1 (1) | 2 (1.9) | 0 (0) | 2 (1.9) | 1 (1) | 2 (1.9) |
| Second format | N = 105 | N = 104 | N = 104 | N = 105 | N = 105 | N = 104 |
| Areas of concern | ||||||
| Physical | 1 (1) | 1 (1) | 6 (5.8) | 5 (4.8) | 3 (2.9) | 0 (0) |
| Emotionala | 88 (83.8) | 82 (78.8) | 81 (77.9) | 88 (83.8) | 81 (77.1) | 86 (82.7) |
| Fatiguea | 83 (79) | 77 (74) | 67 (64.4) | 77 (73.3) | 76 (72.4) | 79 (76) |
| Pain | 19 (18.1) | 27 (26) | 14 (13.5) | 19 (18.1) | 24 (22.9) | 12 (11.5) |
| None | 1 (1) | 3 (2.9) | 1 (1) | 1 (1) | 1 (1) | 2 (1.9) |
| Third format | N = 104 | N = 105 | N = 104 | N = 104 | N = 105 | N = 105 |
| Areas of concern | ||||||
| Physical | 4 (3.8) | 12 (11.4) | 13 (12.5) | 5 (4.8) | 12 (11.4) | 7 (6.7) |
| Emotional | 5 (4.8) | 1 (1) | 6 (5.8) | 3 (2.9) | 1 (1) | 4 (3.8) |
| Fatigue | 13 (12.5) | 17 (16.2) | 23 (22.1) | 9 (8.7) | 12 (11.4) | 8 (7.6) |
| Pain | 7 (6.7) | 4 (3.8) | 11 (10.6) | 3 (2.9) | 3 (2.9) | 2 (1.9) |
| Nonea | 70 (67.3) | 70 (66.7) | 55 (52.9) | 79 (76) | 75 (71.4) | 73 (69.5) |
| Clinicians | ||||||
| First format | N = 39 | N = 40 | N = 39 | N = 39 | N = 40 | N = 39 |
| Change >10 points | ||||||
| Physicala | 34 (87.2) | 34 (85) | 32 (82.1) | 34 (87.2) | 39 (97.5) | 33 (84.6) |
| Emotional | 1 (2.6) | 1 (2.5) | 1 (2.6) | 2 (5.1) | 0 (0) | 2 (5.1) |
| Fatiguea | 34 (87.2) | 32 (80) | 31 (79.5) | 32 (82.1) | 34 (85) | 32 (82.1) |
| Paina | 33 (84.6) | 34 (85) | 33 (84.6) | 32 (82.1) | 37 (92.5) | 33 (84.6) |
| None | 0 (0) | 1 (2.5) | 0 (0) | 0 (0) | 0 (0) | 0 (0) |
| Areas of concern | ||||||
| Physicala | 34 (87.2) | 33 (82.5) | 31 (79.5) | 31 (79.5) | 39 (97.5) | 31 (79.5) |
| Emotional | 2 (5.1) | 0 (0) | 1 (2.6) | 2 (5.1) | 0 (0) | 2 (5.1) |
| Fatigue | 15 (38.5) | 9 (22.5) | 13 (33.3) | 14 (35.9) | 12 (30) | 2 (5.1) |
| Paina | 35 (89.7) | 35 (87.5) | 33 (84.6) | 31 (79.5) | 38 (95) | 33 (84.6) |
| None | 0 (0) | 0 (0) | 0 (0) | 0 (0) | 0 (0) | 0 (0) |
| Second format | N = 39 | N = 39 | N = 40 | N = 39 | N = 39 | N = 40 |
| Areas of concern | ||||||
| Physical | 0 (0) | 2 (5.1) | 1 (2.5) | 0 (0) | 0 (0) | 0 (0) |
| Emotionala | 32 (82.1) | 35 (89.7) | 32 (80) | 33 (84.6) | 33 (84.6) | 36 (90) |
| Fatiguea | 26 (66.7) | 31 (79.5) | 26 (65) | 34 (87.2) | 27 (69.2) | 33 (82.5) |
| Pain | 15 (38.5) | 11 (28.2) | 7 (17.5) | 4 (10.3) | 11 (28.2) | 13 (32.5) |
| None | 1 (2.6) | 0 (0) | 1 (2.5) | 0 (0) | 1 (2.6) | 1 (2.5) |
| Third format | N = 40 | N = 39 | N = 39 | N = 40 | N = 39 | N = 39 |
| Areas of concern | ||||||
| Physical | 3 (7.5) | 4 (10.3) | 3 (7.7) | 2 (5) | 6 (15.4) | 0 (0) |
| Emotional | 1 (2.5) | 0 (0) | 2 (5.1) | 0 (0) | 0 (0) | 1 (2.6) |
| Fatigue | 7 (17.5) | 8 (20.5) | 6 (15.4) | 5 (12.5) | 6 (15.4) | 1 (2.6) |
| Pain | 3 (7.5) | 2 (5.1) | 4 (10.3) | 0 (0) | 0 (0) | 0 (0) |
| Nonea | 28 (70) | 25 (64.1) | 27 (69.2) | 34 (85) | 27 (69.2) | 31 (79.5) |
| Researchers | ||||||
| First format | N = 41 | N = 42 | N = 42 | N = 42 | N = 42 | N = 41 |
| Change >10 points | ||||||
| Physicala | 37 (90.2) | 38 (90.5) | 39 (92.9) | 39 (92.9) | 41 (97.6) | 34 (82.9) |
| Emotional | 0 (0) | 0 (0) | 1 (2.4) | 1 (2.4) | 0 (0) | 0 (0) |
| Fatiguea | 35 (85.4) | 36 (85.7) | 36 (85.7) | 39 (92.9) | 40 (95.2) | 33 (80.5) |
| Paina | 36 (87.8) | 37 (88.1) | 38 (90.5) | 39 (92.9) | 41 (97.6) | 37 (90.2) |
| None | 0 (0) | 0 (0) | 0 (0) | 0 (0) | 0 (0) | 0 (0) |
| Areas of concern | ||||||
| Physicala | 36 (87.8) | 38 (90.5) | 36 (85.7) | 40 (95.2) | 40 (95.2) | 35 (85.4) |
| Emotional | 5 (12.2) | 1 (2.4) | 0 (0) | 0 (0) | 1 (2.4) | 2 (4.9) |
| Fatigue | 14 (34.1) | 6 (14.3) | 6 (14.3) | 15 (35.7) | 7 (16.7) | 7 (17.1) |
| Paina | 34 (82.9) | 35 (83.3) | 36 (85.7) | 38 (90.5) | 41 (97.6) | 35 (85.4) |
| None | 0 (0) | 0 (0) | 0 (0) | 0 (0) | 0 (0) | 0 (0) |
| Second format | N = 42 | N = 41 | N = 42 | N = 41 | N = 42 | N = 42 |
| Areas of concern | ||||||
| Physical | 2 (4.8) | 2 (4.9) | 0 (0) | 1 (2.4) | 0 (0) | 0 (0) |
| Emotionala | 36 (85.7) | 36 (87.8) | 37 (88.1) | 34 (82.9) | 39 (92.9) | 39 (92.9) |
| Fatiguea | 38 (90.5) | 34 (82.9) | 34 (81) | 32 (78) | 36 (85.7) | 37 (88.1) |
| Pain | 5 (11.9) | 12 (29.3) | 2 (4.8) | 6 (14.6) | 10 (23.8) | 2 (4.8) |
| None | 0 (0) | 0 (0) | 0 (0) | 1 (2.4) | 0 (0) | 1 (2.4) |
| Third format | N = 42 | N = 42 | N = 41 | N = 42 | N = 41 | N = 42 |
| Areas of concern | ||||||
| Physical | 3 (7.1) | 2 (4.8) | 2 (4.9) | 6 (14.3) | 4 (9.8) | 0 (0) |
| Emotional | 2 (4.8) | 0 (0) | 0 (0) | 4 (9.5) | 1 (2.4) | 0 (0) |
| Fatigue | 4 (9.5) | 4 (9.5) | 10 (24.4) | 6 (14.3) | 4 (9.8) | 1 (2.4) |
| Pain | 3 (7.1) | 0 (0) | 4 (9.8) | 4 (9.5) | 0 (0) | 0 (0) |
| Nonea | 33 (78.6) | 37 (88.1) | 27 (65.9) | 33 (78.6) | 31 (75.6) | 39 (92.9) |
The answers in these rows were correct.
Multivariable models
Few differences were observed in pair‐wise comparisons of the formats, although red circles were interpreted more accurately than green shading when the first format shown (odds ratio [OR], 1.29; 95% confidence interval [CI], 1.00‐1.65) (Fig. 3a). Formats with higher = better were interpreted more accurately versus higher = more across all format questions (OR, 1.30; 95% CI, 1.07‐1.58) (Fig. 3c). The qualitative comments support this finding: “Maybe improvements should always go up and worse things should always go down. I confused this at first on the bottom 2 charts,” and “I want all the worse to be down or all the better to be up.”
Figure 3.
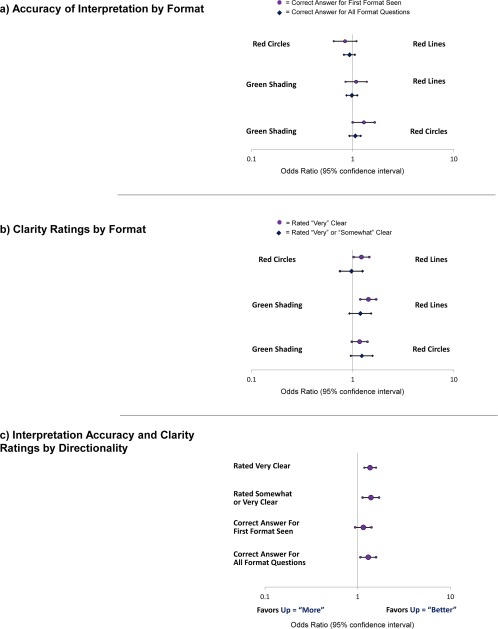
Results from the multivariable generalized estimating equation models are illustrated for (a) accuracy of interpretation by format, (b) clarity ratings by format, and (c) interpretation accuracy and clarity ratings by directionality. Models also were adjusted for respondent type (survivor, clinician, and researcher).
Clarity Ratings and Most Useful Format
Clarity ratings were high across formats and respondent types. The proportion who rated the formats “somewhat” or “very” clear ranged from 83% to 90% for survivors, from 75% to 85% for clinicians, and from 75% to 93% for researchers. In the multivariable models, the threshold‐line formats were more likely to be rated “very” clear compared with green shading (OR, 1.43; 95% CI, 1.19‐1.71) and red circles (OR, 1.22, 95% CI, 1.02‐1.46) (Fig. 3b). In terms of directionality, compared with formats that used higher = more, formats that used higher = better were more likely to be rated “very” or “somewhat” clear (OR, 1.39; 95% CI, 1.13‐1.70) and “very” clear (OR, 1.36; 95% CI, 1.18‐1.58) (Fig. 3c). Across survivors, clinicians, and researchers and both “more” and “better” directionalities, threshold lines were selected as the most useful (Fig. 4). This preference was statistically significant, except for survivors who were randomized to the “more” directionality.
Figure 4.
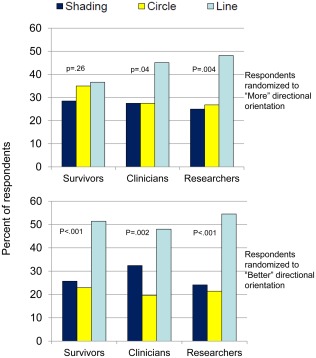
The proportions of survivors, clinicians, and researchers who selected each format as “most useful” are illustrated. P values are from chi‐square tests for whether the observed frequencies varied from the theoretical distribution of equally proportioned responses.
The qualitative comments provide additional insights. The green shading was considered “user friendly, easy on the eye and brain, in that the shaded areas represent optimal zones.” The red circles were considered helpful: “instantly conveys ‘Hey, warning—look at this!’”; however, some considered them to be “a distraction,” and there was some concern that they would “cause alarm.” The red‐circle formats also “don't provide as much background regarding normal range….” The threshold‐line formats were considered “very easy to read and understand,” but some patients preferred to avoid red: “I hate red areas. As a cancer patient, these make my stomach hurt.”
DISCUSSION
With the increasing collection of PRO data for patient management, information on how to present the data so that patients and clinicians can understand the meaning of PRO scores and use them to inform management is critical. Addressing the interpretation barriers identified by previous research,18, 19, 20, 21 we evaluated approaches for presenting line graphs of scores over time to promote accurate interpretation and clarity. We observed that higher = better directionality was both more accurately interpreted and more likely to be rated clear. All 3 approaches for presenting clinical importance were interpreted accurately, with threshold lines more likely to be rated very clear than red circles or green shading. Threshold lines were selected as “most useful” across respondent types and directionality. The findings from this study can inform the presentation of PRO results at the individual clinic, institutional, or even electronic health record vendor level. They may also inform the development of standards for individual patient PRO data presentation, along with other, smaller studies that have investigated this question.22, 23, 24
The findings of this study should be interpreted in the context of its design and limitations. The Internet survey relied on convenience samples. The survivor sample was particularly skewed toward well educated US white female breast cancer survivors. However, the in‐person interviews enabled purposive sampling and did not identify systematic differences in the qualitative feedback. Although the overall sample was large, once divided across 6 survey versions, the ability to analyze subgroups was limited. Several attributes of the formats tested, such as the descriptive labels along the y‐axis, assume that such information is available for PRO measures; however, in many cases, more research will be needed to identify cutoffs for categories.25 When highlighting possibly concerning scores, we only considered absolute values and not changes from the previous assessment. The 10‐point change question aimed to ascertain whether respondents could identify important worsening; and, in fact, the qualitative comments suggested that respondents took this into account when responding about possibly concerning domains. Finally, we evaluated the 3 formats among naive respondents. Whether learning effects associated with use of the formats longitudinally would affect the findings is unknown.
Despite these limitations, the current study, with its large sample, combination of quantitative and qualitative data, and elegant design using randomized orders and versions, can inform the presentation of PRO data to improve interpretability. In particular, these results suggest that higher = better directionality and threshold lines indicating normal versus concerning scores are more accurately interpreted and more likely to be clear. Given the value of these data for promoting patient‐centered care, it is critical that patients and clinicians be able to answer the very basic question: “What do the scores mean?”
FUNDING SUPPORT
This work was supported by the Patient‐Centered Outcomes Research Institute (PCORI) (R‐1410‐24,904). Drs. Snyder and Smith are members of the Johns Hopkins Sidney Kimmel Comprehensive Cancer Center (P30CA006973).
CONFLICT OF INTEREST DISCLOSURES
The authors made no disclosures.
AUTHOR CONTRIBUTIONS
All authors contributed to 1) conception and design, data acquisition, or analysis/interpretation; 2) drafting the article or revising it critically; 3) final approval; and 4) agreement to be accountable.
Supporting information
Supporting Information Figure 1.
Supporting Information Figure 2.
The PRO Data Presentation Stakeholder Advisory Board includes Neil K. Aaronson, PhD (Netherlands Cancer Institute); Patricia A. Ganz, MD (University of California‐Los Angeles and Jonsson Comprehensive Cancer Center); Ravin Garg, MD (Anne Arundel Medical Center); Michael Fisch, MD (The University of Texas MD Anderson Cancer Center); Vanessa Hoffman, MPH (Bladder Cancer Advocacy Network); Bryce B. Reeve, PhD (University of North Carolina at Chapel Hill and Lineberger Comprehensive Cancer Center); Eden Stotsky‐Himelfarb (Johns Hopkins Sidney Kimmel Comprehensive Cancer Center); Ellen Stovall (National Coalition for Cancer Survivorship); and Matthew Zachary (Stupid Cancer). The Johns Hopkins Clinical Research Network (JHCRN) site investigators and staff include: Ravin Garg, MD, and Steven P. DeMartino, CCRC, CRT, RPFT (Anne Arundel Medical Center); Melissa Gerstenhaber, MAS, MSN, RN, CCRN (JHCRN/Anne Arundel Medical Center); Gary Cohen, MD, and Cynthia MacInnis, BS, CCRP (Greater Baltimore Medical Center); Sandra Schaefer, BSN, RN, OCN (JHCRN/Inova Health System); Paul Zorsky, MD, Lynne Armiger, MSN, CRNP, ANP‐C, Sandra L. Heineken, BS, RN, OCN, and Nancy J. Mayonado, MS (Peninsula Regional Medical Center); Michael Carducci, MD (Johns Hopkins Sibley Memorial Hospital); Carolyn Hendricks, MD, Melissa Hyman, RN, BSN, OCN, and Barbara Squiller, MSN, MPH, CRNP (Suburban Hospital). We are most appreciative to all the individuals and organizations that assisted us in circulating the Internet survey.
All statements in this report, including its findings and conclusions, are solely those of the authors and do not necessarily represent the views of the Patient‐Centered Outcomes Research Institute or its Board of Governors or Methodology Committee.
REFERENCES
- 1. Greenhalgh J. The applications of PROs in clinical practice: what are they, do they work, and why? Qual Life Res. 2009;18:115–123. [DOI] [PubMed] [Google Scholar]
- 2. Jensen RE, Snyder CF, Abernethy AP, et al. A review of electronic patient reported outcomes systems used in cancer clinical care. J Oncol Pract. 2014;10:e215–e222. [DOI] [PMC free article] [PubMed] [Google Scholar]
- 3. Velikova G, Booth L, Smith AB, et al. Measuring quality of life in routine oncology practice improves communication and patient well being: a randomized controlled trial. J Clin Oncol. 2004;22:714–724. [DOI] [PubMed] [Google Scholar]
- 4. Berry DL, Blumenstein BA, Halpenny B, et al. Enhancing patient‐provider communication with the Electronic Self‐Report Assessment for Cancer: a randomized trial. J Clin Oncol. 2011;29:1029–1035. [DOI] [PMC free article] [PubMed] [Google Scholar]
- 5. Santana MJ, Feeny D, Johnson JA, et al. Assessing the use of health‐related quality of life measures in the routine clinical care of lung‐transplant patients. Qual Life Res. 2010;19:371–379. [DOI] [PubMed] [Google Scholar]
- 6. Detmar SB, Muller MJ, Schornagel JH, Wever LD, Aaronson NK. Health‐related quality‐of‐life assessments and patient‐physician communications. A randomized clinical trial. JAMA. 2002;288:3027–3034. [DOI] [PubMed] [Google Scholar]
- 7. Greenhalgh J, Meadows K. The effectiveness of the use of patient‐based measures of health in routine practice in improving the process and outcomes of patient care: a literature review. J Eval Clin Pract. 1999;5:401–416. [DOI] [PubMed] [Google Scholar]
- 8. Marshall S, Haywood K, Fitzpatrick R. Impact of patient‐reported outcome measures on routine practice: a structured review. J Eval Clin Pract. 2006;12:559–568. [DOI] [PubMed] [Google Scholar]
- 9. Haywood K, Marshall S, Fitzpatrick R. Patient participation in the consultation process: a structured review of intervention strategies. Patient Educ Couns. 2006;63:12–23. [DOI] [PubMed] [Google Scholar]
- 10. Cleeland CS, Wang XS, Shi Q, et al. Automated symptom alerts reduce postoperative symptom severity after cancer surgery: a randomized controlled trial. J Clin Oncol. 2011;29:994–1000. [DOI] [PMC free article] [PubMed] [Google Scholar]
- 11. McLachlan SA, Allenby A, Matthews J, et al. Randomized trial of coordinated psychosocial interventions based on patient self‐assessment versus standard care to improve the psychosocial functioning of patients with cancer. J Clin Oncol. 2001;19:4117–4125. [DOI] [PubMed] [Google Scholar]
- 12. Basch E, Deal AM, Kris MG, et al. Symptom monitoring with patient‐reported outcomes during routine cancer treatment: a randomized controlled trial. J Clin Oncol. 2016;34:557–565. [DOI] [PMC free article] [PubMed] [Google Scholar]
- 13. Denis F, Lethrosne C, Pourel N, et al. Overall survival in patients with lung cancer using a web‐application‐guided follow‐up compared to standard modalities: results of phase III randomized trial [abstract]. J Clin Oncol. 2016;34(suppl). Abstract LBA9006. [Google Scholar]
- 14. ePROVIDE . Getting started with ePROVIDE. Available at: https://eprovide.mapi-trust.org/. Accessed July 15, 2016.
- 15. Snyder CF, Jensen R, Courtin SO, Wu AW. PatientViewpoint: a website for patient‐reported outcomes assessment. Qual Life Res. 2009;18:793–800. [DOI] [PMC free article] [PubMed] [Google Scholar]
- 16. Abernethy AP, Wheeler JL, Zafar SY. Management of gastrointestinal symptoms in advanced cancer patients: the rapid learning cancer clinic model. Curr Opin Support Palliat Care. 2010;4:36–45. [DOI] [PMC free article] [PubMed] [Google Scholar]
- 17. HealthMeasures . PROMIS software demonstration. Available at: http://nihpromis.org/software/demonstration. Accessed July 15, 2016.
- 18. Jones JB, Snyder CF, Wu AW; for the Website for Outpatient QOL Assessment Research Network . Issues in the design of Internet‐based systems for collecting patient‐reported outcomes. Qual Life Res. 2007;16:1407–1417. [DOI] [PubMed] [Google Scholar]
- 19. Snyder CF, Blackford AL, Wolff AC, et al. Feasibility and value of PatientViewpoint: a web system for patient‐reported outcomes assessment in clinical practice. Psychooncology. 2013;22:895–901. [DOI] [PMC free article] [PubMed] [Google Scholar]
- 20. Brundage MD, Smith KC, Little EA, Bantug ET, Snyder CF; PRO Data Presentation Stakeholder Advisory Board . Communicating patient‐reported outcome scores using graphic formats: results from a mixed methods evaluation. Qual Life Res. 2015;24:2457–2472. [DOI] [PMC free article] [PubMed] [Google Scholar]
- 21. Smith KC, Brundage MD, Tolbert E, et al. Engaging stakeholders to improve presentation of patient‐reported outcomes data in clinical practice. Support Care Cancer. 2016;24:4149–4157. [DOI] [PubMed] [Google Scholar]
- 22. Bantug ET, Coles T, Smith KC, et al. Graphical displays of patient‐reported outcomes (PRO) for use in clinical practice: what makes a PRO picture worth a thousand words? Patient Educ Couns. 2016;99:483–490. [DOI] [PubMed] [Google Scholar]
- 23. Kuijpers W, Giesinger JM, Zabernigg A, et al. Patients' and health professionals' understanding of and preferences for graphical presentation styles for individual‐level EORTC QLQ‐C30 scores. Qual Life Res. 2016;25:595–604. [DOI] [PMC free article] [PubMed] [Google Scholar]
- 24. Hartzler AL, Izard JP, Dalkin BL, Mikles SP, Gore JL. Design and feasibility of integrating personalized PRO dashboards into prostate cancer care. J Am Med Inform Assoc. 2016;23:38–47. [DOI] [PMC free article] [PubMed] [Google Scholar]
- 25. Snyder CF, Aaronson NK, Choucair AK, et al. Implementing patient‐reported outcomes assessment in clinical practice: a review of the options and considerations. Qual Life Res. 2012;21:1305–1314. [DOI] [PubMed] [Google Scholar]
Associated Data
This section collects any data citations, data availability statements, or supplementary materials included in this article.
Supplementary Materials
Supporting Information Figure 1.
Supporting Information Figure 2.