Abstract
Background:
This study aimed to explore the correlation between microRNA-155 (miR-155), interleukin 17A (IL-17), and late preeclampsia (PE) using biochemical parameters in maternal serum and urine.
Methods:
Sixty patients with PE were recruited to this study and were divided into 3 groups according to levels of urinary protein: mild urinary protein group (group A); moderate urinary protein group (group B); and severe urinary protein group (group C). All subjects presented with late onset PE (≥32 weeks). In addition, 20 healthy pregnant women were recruited as a normal group (NP). Maternal serum and urine samples were obtained from all participants and assayed using immunofluorescence, transmission electron and immune electron microscopy, and western blot. Furthermore, placentas were also collected and miR-155 and IL-17 expression was measured using an enzyme-linked immunosorbent assay.
Results:
Levels of miR-155 and IL-17 expression were found to be increased in PE placentas and serum, compared to the normal group (P <.05). IL-17 levels and podocytes had a positive association in the serum of patients with PE. In addition, over-expression of miR-155 resulted in increased IL-17 production by CD4+ T cells in vitro, and nephrin expression was decreased in podocytes. Furthermore, IL-17 reduced nephrin expression in podocytes and podocyte apoptosis in a dose and time-dependent manner.
Conclusion:
The results of this study demonstrate a correlation between miR-155 and IL-17 in the formation of proteinuria during late onset PE.
Keywords: IL-17, miR-155, preeclampsia, proteinuria
1. Introduction
Preeclampsia (PE) is a pregnancy-specific disorder that affects ∼7% of pregnancies.[1–4] It is characterized by hypertension and proteinuria,[5–7] which can significantly increase the risk of maternal complications and prenatal mortality.[8] Previous reports have suggested that the presence of both proteinuria and hypertension during PE resulted in preterm deliveries and maternal mortality in 15% and 16% cases studied, respectively.[9–10]
Previous studies reported that several factors can lead to PE, such as a loss of vascular endothelial growth factor (VEGF) activity[11–12] or glomerular endotheliosis.[13] In addition, podocyturia (the presence of podocytes in the urine sediment) and nephrinuria (soluble nephrin in the urine) have been detected in the urine of patients with PE.[14–16] Podocytes are glomerular epithelial cells that regulate filtration of circulating plasma proteins from the capillary lumen into Bowman's space.[17–18] Nephrin is a podocyte-specific transmembrane protein that is predominantly localized to the glomerular slit diaphragm of podocytes.[19] Thus, podocytes and nephrin expression are key factors in the assessment of proteinuria in patients with PE.
MicroRNAs (miRNAs) are a major class of tissue-specific regulators of gene expression.[20] In 2007, Pineles et al[21] reported a relationship between PE and aberrant miRNA expression in the placenta. Among miRNAs, microRNA-155 (miR-155) is a known oncogene and is upregulated in immune cells following exposure to inflammatory stimuli, suggesting an important role in immune regulation.[21] Studies found that miR-155 expression is increased in the placentas of women with PE at the time of delivery.[22–23] Another study revealed that miR-155 contributes to the pathogenesis of PE by downregulating cysteine-rich 61 (CYR61).[23] It has also been reported that IL-17 expression is elevated in the circulation and placenta in PE, and could be involved in the pathogenesis of PE.[24] We speculate that, in addition to CYR61, there may be other miR-155 and IL-17 targets in the occurrence of PE, because an individual miRNA has the potential to target multiple protein-coding genes.
The aim of this study is to test the hypothesis that miR-155 and IL-17 have a positive association in the formation of proteinuria during late onset PE.
2. Materials and methods
2.1. Study design and participants
The present study was performed using serum, urine, and placental tissues collected from 60 patients with PE and 20 normal pregnant women from the Second Xiangya Hospital, Central South University. The study was approved by the Medical Ethical Committee of the Second Xiangya Hospital and written informed consent was obtained from all participants. Normal pregnancy was defined as subjects who were normotensive during pregnancy and who, both previously and presently, had delivered a healthy neonate after 37 weeks of gestation. Late onset PE (≥32 weeks) was defined as those patients who displayed gestational hypertension and proteinuria without a history of hypertension, presenting with systolic blood pressure ≥140 mm Hg and/or diastolic blood pressure ≥90 mm Hg. Subjects who had complications of renal disease, spontaneous abortion, gestational diabetes, fetal chromosomal, or congenital abnormalities were excluded from this study.
Urinary samples were divided into 4 groups, according to levels of urinary protein: mild urinary protein group (group A); moderate urinary protein group (group B); severe urinary protein group (group C); and a normal group (NP).
2.2. Sample collection and preparation
Serum samples were collected at the time of delivery via cesarean section and centrifuged at 4000 rpm for 30 minutes at 4°C. Serum obtained was tested for liver and renal function, as well as IL-17 and miR-155 expression. Urine samples were obtained after every 24 hours from 3 days before cesarean section, and tested for urine protein excretion per 24 hours and podocyturia. Placental tissue was collected during cesarean section for testing IL-17 mRNA and miR-155 expression.
2.3. Immunofluorescence and microscopy
Frozen sections of placenta tissue (6 μm) were transferred onto slides and washed with cold phosphate buffer saline (PBS). Sections were fixed with chilled acetone for 10 minutes at –20°C and incubated with 0.1% Triton X-100 in PBS at 37°C for 15 minutes. After washing with PBS, sections were blocked with 1% bovine serum albumin for 30 minutes and stained with goat anti-human nephrin (1:50; R&D Systems, Minneapolis, MN) for 12 hours at 4°C, followed by rhodamine-conjugated rabbit anti-goat immunoglobulin G (1:100; Santa Clara, CA). Control sections were stained with a nonassociated primary antibody instead of anti-nephrin. Sections were examined by fluorescence microscopy (BX251 microscope; Olympus, Tokyo, Japan). Images were captured using a spot charge-coupled device camera (Olympus). Exposure settings were kept constant for each primary antibody.
2.4. Transmission electron microscopy
Paraformaldehyde-glutaraldehyde-fixed 1-mm blocks of renal cortex were postfixed with 1% osmium in 0.1 M cacodylate buffer for 1 hour, dehydrated through graded ethanol, embedded in Epon, sectioned, stained with uranyl acetate and lead citrate, and examined and photographed using a Hitachi H600 transmission electron microscope (Hitachi, Tokyo, Japan).
2.5. Immune electron microscopy
The paraformaldehyde-glutaraldehyde-fixed 1-mm blocks of renal cortex were washed with PBS, dehydrated through graded ethanol, and embedded in Epon. Ultrathin sections were transferred to nickel grids and blocked with 1% bovine serum albumin and 1% normal goat serum in PBS. Sections were incubated with a primary polyclonal goat anti-human nephrin antibody against the intracellular domain of nephrin (1:50; R&D Systems), then with a secondary gold-conjugated (10 nm) rabbit anti-goat secondary antibody (1:100; DAKO, DK). Sections were postfixed with 1% glutaraldehyde, contrasted with uranyl acetate and lead citrate, and observed under an electron microscope and photographed for detailed analysis.
2.6. Reverse transcription-polymerase chain reaction
Total RNA was isolated from placental tissues using Trizol reagent (Invitrogen Life Technologies, Carlsbad, CA). Total RNA (5 g) was extracted from the renal cortex and was used to synthesize cDNA, which served as a template for amplification of nephrin and glyceraldehyde-3-phosphate dehydrogenase (GAPDH) as an endogenous standard. Sequences of forward and reverse primers (Shenggong Company, Shanghai, China) were as follows: 5′-CTGTTAATGCTAATCGTGATAG-3′ and 5′-GCAGGGTCCGAGGT-3′ for miR-155 detection; 5′-CGGACTGTGATGGTCAACCT-3′ and 5′-GACCAGGATCTCTTGCTGGA-3′ for IL-17 detection; and 5′-GCACCGTCAAGGCTGAGAAC-3′ and 5′-TGGTGAAGACGCCAGTGGA-3′ for GAPDH detection. AlphaEase FC image software (Panasonic WV-Bp 330/G, Japan) was used to analyze all those data.
2.7. Western blotting
Urine samples were homogenized on ice and proteins were extracted using a lysis buffer, centrifuged at 12,000g for 15 minutes at 4°C, and the resultant supernatant was collected. Protein concentrations were determined using a BCA protein assay kit (Pierce Biotechnology, Rockford, IL). Samples were separated on an 8% polyacrylamide gel then semidry blotted onto a PVDF membrane. The blotted membrane was incubated for 2 hours at room temperature in blocking solution (5% blocking agent in 1% nonfat milk) in tris-buffered saline (TBS) with 0.02% Tween 20 (T) then washed 3 times with a washing solution.
2.8. Cell culture
Podocytes were cultured at 37°C in a water-saturated atmosphere with 5% CO2 for 5 days before initiation of experiments. Podocytes were separately exposed to Dkk1 (R&D Systems) or NS-398 (Sigma Chemical Co., St Louis, MO) in serum-free DMEM containing peptidase inhibitors (1 μM phosphoramidon, 4 μg/mL bacitracin and 1 μM captopril; Sigma) for 15 minutes at 37°C in a water-saturated atmosphere with 5% CO2. The cells were then treated with IL-17 and continuously stimulated with TWS119 (Cayman Chemical, Ann Arbor, MI) or Wnt-3a (R&D Systems) for 8, 12, or 24 hours in DMEM at 37°C. Podocytes were treated with different concentrations of IL-17.
2.9. Cell co-culture
The CD4+ T cells were transfected with a miR-155 mimic or a miR-155 mimic negative control; the CD4+ T cells and podocytes were co-cultured. Nephrin expression was measured using western blot. Podocyte apoptosis was assessed using flow cytometry (Annexin V-FITC Apoptosis Detection Kit I, BD Bioscience, San Jose, CA).
2.10. Statistical analysis
Results were analyzed using SPSS 19.0 (SPSS Inc., Chicago, IL). Student's t-test was used to ascertain the significance of differences between mean values of 2 continuous variables. A chi-squared test was used to analyze differences in proportions of categorical variables among different groups. Spearman correlation analysis was used to evaluate the relationship between 2 indexes. A P-value <.05 was considered significant.
3. Results
3.1. Basic clinical characteristics among different preeclampsia groups
Eighty patients were divided into 3 groups: a normal group (NP) (n = 20), a mild PE group (MPE) (n = 26) and a severe PE group (SPE) (n = 34), according to the degree of PE. The basic characteristics of gestational age, systolic pressure (SBP), diastolic pressure (DBP), and quantitation of 24-hour urinary protein (24U-pro) were analyzed and compared among the different groups (Table 1). Significant differences in gestational age, SBP, DBP, and 24U-pro were found between the NP and MPE groups and the NP and SPE groups (P <.05, Table 1). Similarly, significant differences in gestational age, SBP, DBP and 24U-pro were found between the MPE and SPE groups (P <.05, Table 1).
Table 1.
Basic clinical characteristics among different preeclampsia groups.

3.2. Clinical indexes at different urine protein levels
Values of urine protein levels were used to divide the 80 samples into 4 groups: NP, A, B, and C. Gestational age and albumin levels were higher in group NP than in groups A, B, and C, while SBP, DBP, UA, 24U-pro values, and podocyte numbers were significantly lower in group NP than in groups A, B, and C (P <.05, Table 2). Differences in all measurements were compared among groups A, B, and C using a one-way analysis of variance. The differences in gestational age among the 3 groups were significant (F = 3.27, P <.05, Table 2). A LSD-t test was used to compare between groups A, B, and C. Similarly, albumin levels showed significant differences among the 3 groups (P <.05, Table 2). A Kruskal–Wallis test was used to analyze the 24U-pro data, and results showed significant differences among groups A, B, and C (P <.05, Table 2). Results were similar for the podocyte numbers among the 3 groups (P <.05, Table 2, Fig. 1). However, no significant differences in SBP, DBP, and UA were found among the 3 groups.
Table 2.
Clinical indexes at different protein levels.

Figure 1.
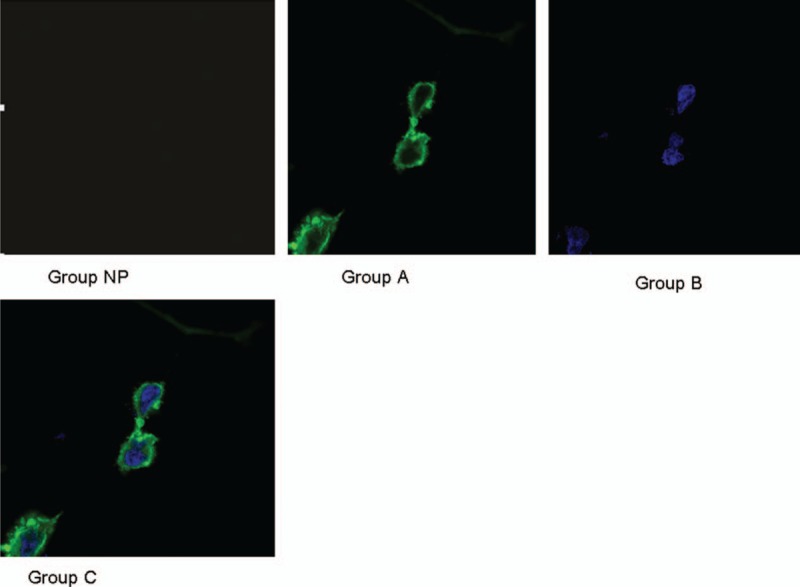
Podocyte in different urine protein level groups.
3.3. Newborn outcomes at different urine protein levels
Placenta weight in the NC group was significantly higher in groups A, B, and C (P <.05, Table 3). Moreover, birth weight, 1-minute Apgar score,[25] and 5-minute Apgar score were significantly higher in the group NC than in groups A and B (P <.05, Table 3). The LSD-t test was used to analyze the placenta weight, birth weight, 1-minute Apgar score, and 5-minute Apgar score data were significant differences among groups A, B, and C (P <.05, Table 3).
Table 3.
Newborn outcomes at different urine protein levels.

3.4. Nephrin expression at different urine protein levels
Results of western blot of urine nephrin expression at different urine protein levels showed that the relative mean value was 1.071 in the NC group, while they were 3.450, 6.500, and 8.783 in the group A, B, and C, respectively. Significant differences were found among the 4 groups (P <.05, Fig. 2A–C).
Figure 2.
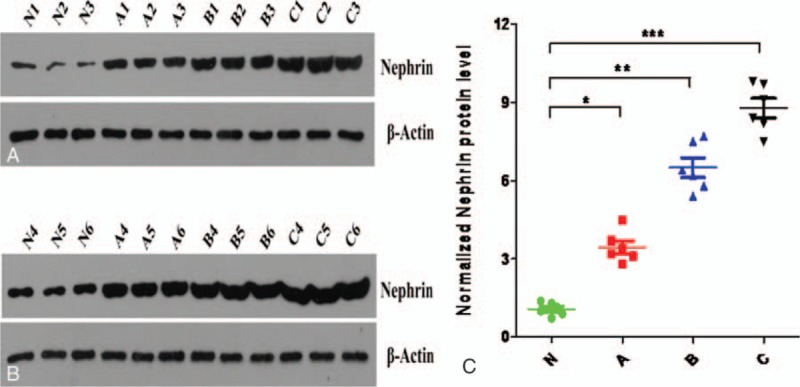
(A–C) Urine nephrin expression at different urine protein levels.
3.5. Correlation analysis between 24-hour urine protein and different indexes
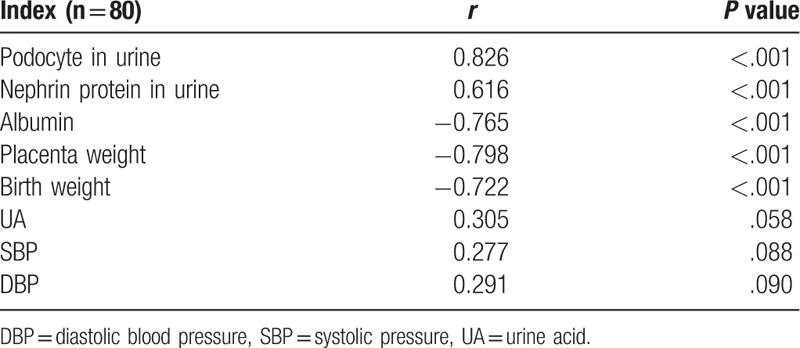
Positive correlations were found between 24-hour urine protein levels, the number of podocytes, and nephrin expression in the urine (P <.001, Table 4). However, negative correlations were noted between 24-hour urine protein levels and placental weight, serum albumin, and birth weight (P <.001, Table 4).
Table 4.
Correlation between 24-hour urine protein and different indexes.
3.6. miR-155 and IL-17 mRNA expressions in serum and placenta
Multiple methods were used to compare the expressions of miR-155 and IL-17 in serum and placenta (Table 5). Significant differences in miR-155 and IL-17 expressions in the serum and placenta were found among the 4 groups (P <.01 Table 4, Figs. 3–6).
Table 5.
MiRNA-155 and IL-17 expressions in serum and placenta.

Figure 3.
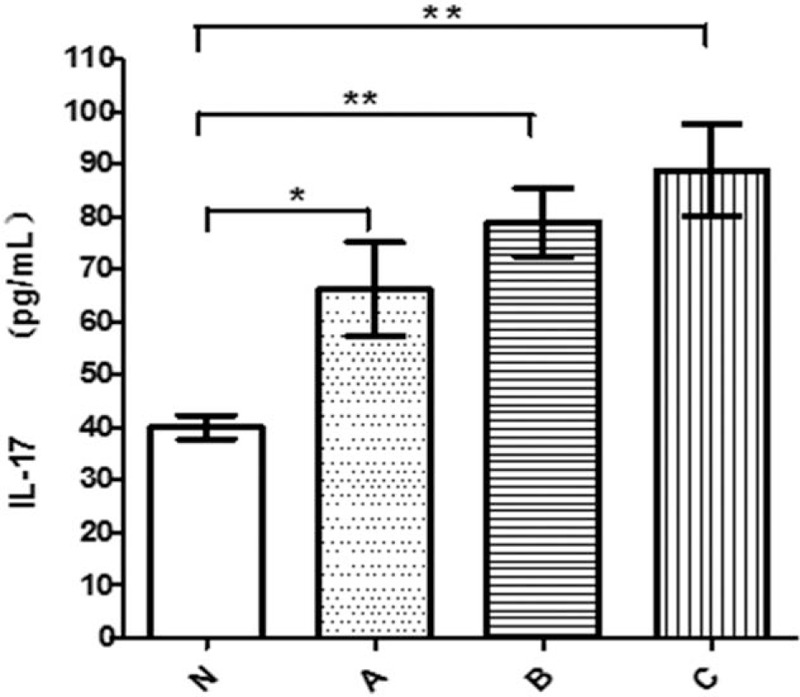
IL-17 in serum in different groups. IL-17 = interleukin 17.
Figure 6.
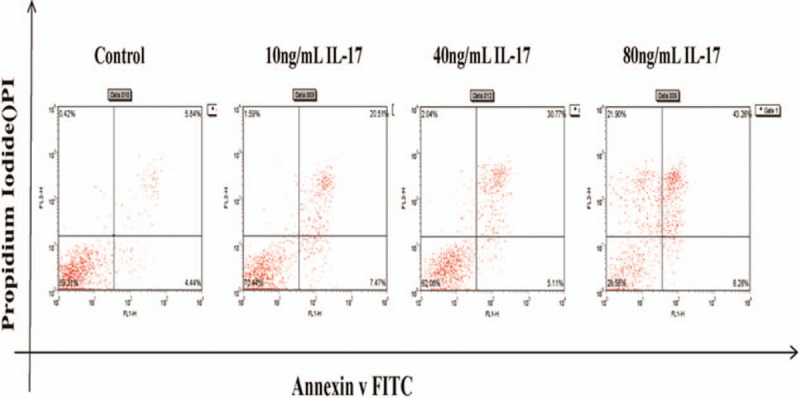
Apoptosis rate at different concentration.
Figure 4.
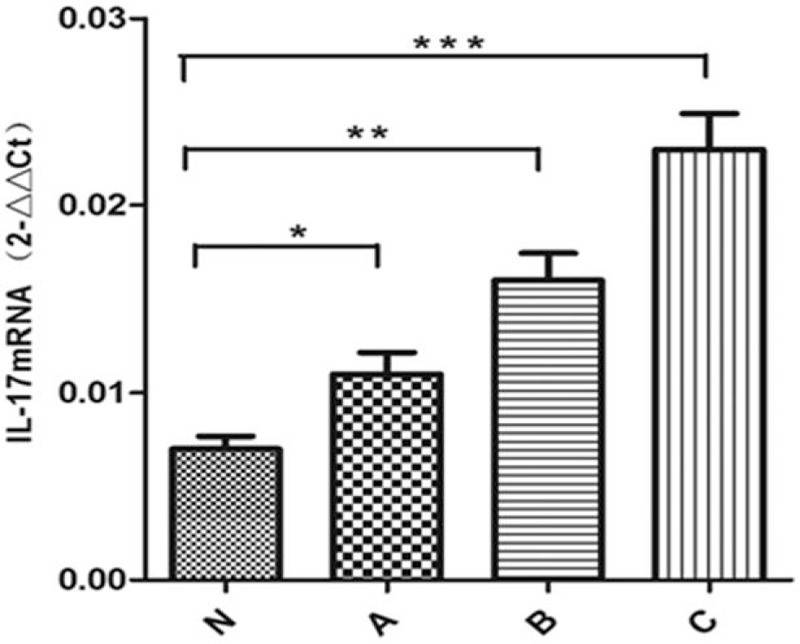
IL-17 in placenta in different groups. IL-17 = interleukin 17.
Figure 5.
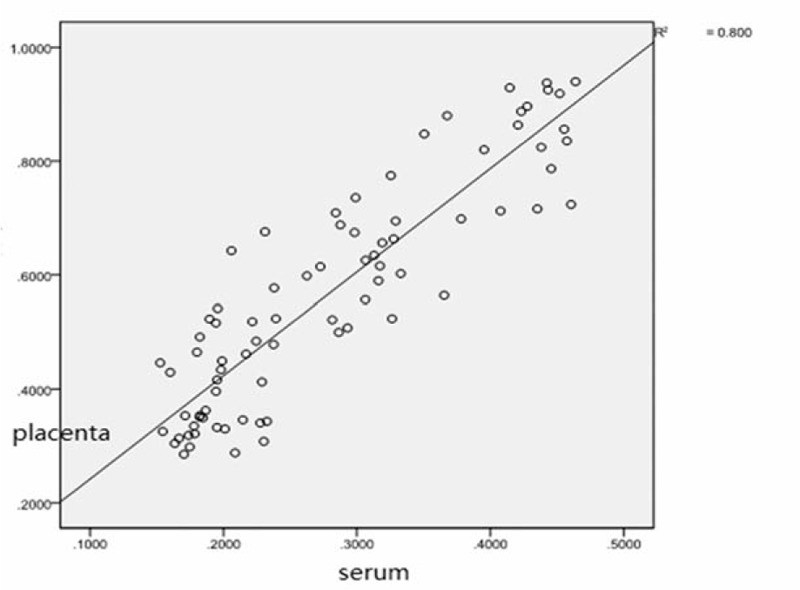
Correlation of miRNA-155 between serum and placenta. miRNA-155 = microRNA-155.
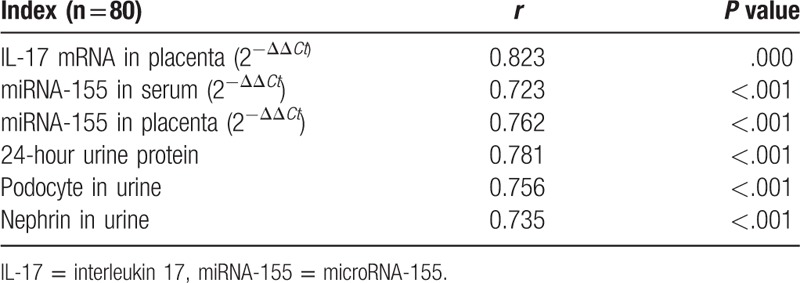
3.7. Correlation analysis between IL-17 mRNA expression and other indexes in serum
A positive correlation was found between IL-17 levels in the serum and placenta (P <.001, Table 6). In addition, a positive correlation was found between IL-17 levels in the serum and miR-155 expression in both the serum and placenta (P <.001, Table 6). Moreover, a positive correlation was found between the level of IL-17 in the serum, nephrin expression, and the number of podocytes in the urine (P <.001, Table 6).
Table 6.
Correlation between IL-17 expression and other indexes in serum.
3.8. Nephrin and podocyte apoptosis following miRNA transfection
After co-culture, nephrin expression was higher in the group transfected with a miR-155 mimic than in the group transferred with a miR-155 mimic negative control. Podocyte apoptosis was lower in the group transferred with miR-155 mimic than in the group transferred with a miR-155 mimic negative control (P <.05, Table 7).
Table 7.
Nephrin and podocyte apoptosis expression in different transfected groups.

3.9. Nephrin expression and podocyte apoptosis following IL-17 treatment
The expression of nephrin in podocytes was significantly higher in the control group than in groups treated with different concentrations of IL-17 (10, 40, or 80 ng/mL) (P <.05, Table 8). However, the apoptosis rate in podocytes was significantly lower in the control group than in the IL-17-treated groups (P <.05, Table 8, Fig. 6). A multiple comparison method was used to analyze the nephrin expression and apoptosis rate in podocytes, and significant differences were found among the 4 groups (P <.05, Table 8). The nephrin expression and apoptosis rate also showed significant differences among the 4 groups (P <.05, Table 8).
Table 8.
Nephrin and apoptosis rate in podocyte in different concentration.

3.10. Nephrin expression and apoptosis rate in podocytes at different times after IL-17 treatment
Nephrin expression in podocytes was significantly higher in the control group than in the IL-17-treated groups (40 ng/mL 8 hours, 40 ng/mL 12 hours, and 40 ng/mL 24 hours) (P <.05, Table 9). However, the apoptosis rate in podocytes was significantly lower in the control group than in the different time point groups (P <.05, Table 9, Fig. 7). A multiple comparison method was used to analyze nephrin expression and apoptosis rate in podocytes, and significant differences were found among the 4 groups (P <.05). Results of the nephrin expression apoptosis rate analysis also showed significant differences between 4 groups (P <.05, Table 9).
Table 9.
Nephrin and apoptosis rate in podocyte at different time points.

Figure 7.
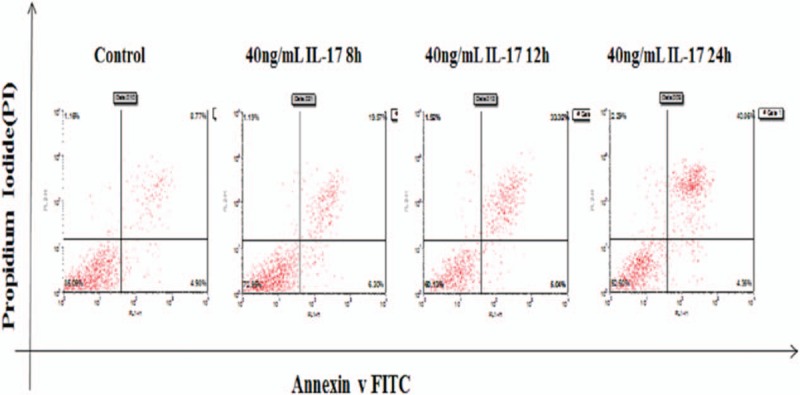
Apoptosis rate at different time points.
4. Discussion
Recent studies provide strong evidence that proteinuria in PE is associated with cytokine and T-cell disorders and results in glomerular podocyte dysfunction.[26] Furthermore, an increase in IL-13 production by CD3+, CD4+, and CD8+ T cells was shown to mediate steroid-sensitive nephrotic syndrome during relapse.[27]
It has been reported that podocyturia occurs in pregnant women with PE from the end of the second trimester until delivery time.[2] The results of the present study suggest that podocyturia identifies a subclinical disease among pregnant women who subsequently develop the clinical characteristics of PE. As such, podocyturia may serve as an early indicator and diagnostic test for PE.[28] This is supported by data from the present study. In addition, we previously demonstrated a redistribution and reduction in nephrin proteins in human podocytes treated with IL-17.[29] Exposure of nephrin molecules to IL-17 caused them move and accumulate internally toward the cytoplasmic actin filaments, suggesting that the observed redistribution and reduction in nephrin proteins could be involved in the pathogenesis of PE. These results are similar to previous findings that nephrin in podocytes is also affected by diabetic conditions, causing hyperpermeability at early stages.[30]
MicroRNAs are increasingly recognized as critical regulators of tissue-specific patterns of gene expression. For example, CD4+ T cells lacking miR-155 exhibit a bias toward Th2 differentiation, indicating that the absence of an individual miR can alter CD4+ T-cell differentiation. We have shown that miR-155 is induced upon T-cell activation and promotes Th1 differentiation when overexpressed in the activated CD4+ T cells. Antagonism of miR-155 leads to induction of interferon (IFN)-gamma receptor alpha-chain (IFN-gammaRalpha), and a functional miR-155 target site has been identified within the 3′ untranslated region of IFN-gammaRalpha.[31] These results identify IFN-gammaRalpha as a second miR-155 target in T cells and suggest that miR-155 contributes to Th1 differentiation in CD4+ T cells by inhibiting IFN-gamma signaling.[32]
We recently demonstrated that IL-17 induces apoptosis in cultured rat podocytes.[33] In IL-17-induced podocyte, apoptosis was detected using electron microscopy as well as a TUNEL assay. Nephrin expression was reduced at 8 and 12 hours. We presume that podocyte apoptosis contributes to the occurrence of proteinuria. Interestingly, a highly significant negative correlation was found between nephrin expression and apoptotic podocytes.[34] Our data show that IL-17 induced nephrin derangement or even its decrement, which may play a role in podocyte apoptosis induction.
5. Conclusion
A positive correlation was reported between the expression of miR-155 and IL-17 in the serum and placenta, and the number of podocytes in the urine in PE. Over-expression of miR-155 caused an increase in IL-17 production, which induced podocyte apoptosis in a dose- and time-dependent manner.
Footnotes
Abbreviations: 24U-pro = quantitation of 24-hour urinary protein, CYR61 = cysteine-rich 61, DBP = diastolic pressure, group A = mild urinary protein group, group B = moderate urinary protein group, group C = severe urinary protein group, IL-17 = interleukin 17A, miR-155 = microRNA-155, miRNAs = microRNAs, MPE = mild PE group, NP = a normal group, PE = preeclampsia, SBP = systolic pressure, SPE = severe PE group, TBS = tris-buffered saline, VEGF = vascular endothelial growth factor.
The authors have no conflicts of interest to disclose.
References
- [1].Redman CW, Sargent IL. Latest advances in understanding preeclampsia. Science 2005;308:1592–4. [DOI] [PubMed] [Google Scholar]
- [2].Cheng PJ, Huang SY, Su SY, et al. Prognostic value of cardiovascular disease risk factors measured in the first-trimester on the severity of preeclampsia. Medicine (Baltimore) 2016;95:e2653. [DOI] [PMC free article] [PubMed] [Google Scholar]
- [3].Yuan T, Wang W, Li XL, et al. Clinical characteristics of fetal and neonatal outcomes in twin pregnancy with preeclampsia in a retrospective case-control study: a STROBE-compliant article. Medicine (Baltimore) 2016;95:e5199. [DOI] [PMC free article] [PubMed] [Google Scholar]
- [4].Sibai B, Dekker G, Kupferminc M. Pre-eclampsia. Lancet 2005;365:785–99. [DOI] [PubMed] [Google Scholar]
- [5].Sun L, Mao D, Cai Y, et al. Association between higher expression of interleukin-8 (IL-8) and haplotype -353A/-251A/+678T of IL-8 gene with preeclampsia: A case-control study. Medicine (Baltimore) 2016;95:e5537. [DOI] [PMC free article] [PubMed] [Google Scholar]
- [6].Lim KH, Ramus RM. Preeclampsia. Available at: http://emedicine.medscape.com/article/1476919-overview (updated September 15, 2016, accessed April 18, 2017). [Google Scholar]
- [7].Cunningham FG, Leveno KJ, Bloom SL, et al. Williams Obstetrics,. 23rd ed.2010;New York: McGraw-Hill, 761–765. [Google Scholar]
- [8].Leaños-Miranda A, Méndez-Aguilar F, Ramírez-Valenzuela KL, et al. Circulating angiogenic factors are related to the severity of gestational hypertension and preeclampsia, and their adverse outcomes. Medicine (Baltimore) 2017;96:e6005. [DOI] [PMC free article] [PubMed] [Google Scholar]
- [9].Goldenberg RL, Rouse DJ. Prevention of premature birth. N Engl J Med 1998;339:313–20. [DOI] [PubMed] [Google Scholar]
- [10].Berg CJ, Chang J, Callaghan WM, et al. Pregnancy-related mortality in the United States, 1991–1997. Obstet Gynecol 2003;101:289–96. [DOI] [PubMed] [Google Scholar]
- [11].Ahmad S, Ahmed A. Regulation of soluble VEGFR-1 by VEGF and oxygen and its elevation in pre-eclampsia and fetal growth restriction. Placenta 2001;22:A.7. [Google Scholar]
- [12].Ahmad S, Ahmed A. Elevated placental soluble vascular endothelial growth factor receptor-1 inhibits angiogenesis in preeclampsia. Circ Res 2004;95:884–91. [DOI] [PubMed] [Google Scholar]
- [13].Jeyabalan A, Conrad KP. Renal function during normal pregnancy and preeclampsia. Front Biosci 2007;12:2425–37. [DOI] [PubMed] [Google Scholar]
- [14].Craici IM, Wagner SJ, Bailey KR, et al. Podocyturia predates proteinuria and clinical features of preeclampsia: Longitudinal prospective study. Hypertension 2013;61:1289–96. [DOI] [PMC free article] [PubMed] [Google Scholar]
- [15].Zhai T, Furuta I, Akaishi R, et al. Alteration of podocyte phenotype in the urine of women with preeclampsia. Sci Rep 2016;6:24258. [DOI] [PMC free article] [PubMed] [Google Scholar]
- [16].Wang Y, Zhao S, Loyd S, et al. Increased urinary excretion of nephrin, podocalyxin, and (ig-h3 in women with preeclampsia. Am J Physiol Renal Physiol 2012;302:F1084–9. [DOI] [PubMed] [Google Scholar]
- [17].Mundel P, Shankland SJ. Podocyte biology and response to injury. J Am Soc Nephrol 2002;13:3005–15. [DOI] [PubMed] [Google Scholar]
- [18].Tryggvason K, Jaakko Patrakka J, Wartiovaara J. Hereditary proteinuria syndromes and mechanisms of proteinuria. N Engl J Med 2006;354:1387–401. [DOI] [PubMed] [Google Scholar]
- [19].Ruotsalainen V, Ljungberg P, Wartiovaara J, et al. Nephrin is specifically located at the slit diaphragm of glomerular podocytes. Proc Natl Acad Sci USA 1999;96:7962–7. [DOI] [PMC free article] [PubMed] [Google Scholar]
- [20].Huntzinger E, Izaurralde E. Gene silencing by microRNAs: contributions of translational repression and mRNA decay. Nat Rev Genet 2011;12:99–110. [DOI] [PubMed] [Google Scholar]
- [21].Pineles BL, Romero R, Montenegro D, et al. Distinct subsets of microRNAs are expressed differentially in the human placentas of patients with preeclampsia. Am J Obstet Gynecol 2007;196:261. [DOI] [PubMed] [Google Scholar]
- [22].O’Connell RM, Taganov KD, Boldin MP, et al. MicroRNA-155 is induced during the macrophage inflammatory response. Proc Natl Acad Sci USA 2007;104:1604–9. [DOI] [PMC free article] [PubMed] [Google Scholar]
- [23].Zhang Y, Diao Z, Su L, et al. MicroRNA-155 contributes to preeclampsia by down-regulating CYR61. Am J Obstet Gynecol 2010;202:466.e1–7. [DOI] [PubMed] [Google Scholar]
- [24].Cornelius DC, Wallace K, Kiprono L, et al. Endothelin-1 is not a mechanism of IL-17 induced hypertension during pregnancy. Med J Obstet Gynecol 2013;1:1006. [PMC free article] [PubMed] [Google Scholar]
- [25].Gilstrap LC, 3rd, Leveno KJ, Burris J, et al. Diagnosis of birth asphyxia on the basis of fetal pH, Apgar score, and newborn cerebral dysfunction. Am J Obstet Gynecol 1989;161:825–30. [DOI] [PubMed] [Google Scholar]
- [26].AI-Mulhim AA, Abu-heija A, AI-Jamma F, et al. Preeclampsia: maternal risk factors and perinatal outcome. Fetal Diagn Ther 2003;18:275–80. [DOI] [PubMed] [Google Scholar]
- [27].Hiromura K, Haseley LA, Zhang P, et al. Podocyte expression of the CDK-inhibitor p57 during development and disease. Kidney Int 2001;60:2235–46. [DOI] [PubMed] [Google Scholar]
- [28].Ortmann J, Amann K, Brandes Rp, et al. Role of podocytes for reversal of glomerulosclerosis and proteinuria in the aging kidney after endothelin inhibition. Hypertention 2004;44:974–81. [DOI] [PubMed] [Google Scholar]
- [29].Ruotsalainen V, Ljungberg P, Wartiovaara, et al. Nephrin is specifically located at the slit diaphragm of glomerular podocytes. Proc Nati Acad Sci USA 1999;96:7962–7. [DOI] [PMC free article] [PubMed] [Google Scholar]
- [30].Tryggvason K. Unraveling the mechanism glomerular ultrafiltration nephrin, a key component of the slit diaphragm. J Am Soc Nephrol 1999;10:2440–5. [DOI] [PubMed] [Google Scholar]
- [31].Vigorito E, Perks Kl, Abreu-Goodger C, et al. MicroRNA-155 regulates the generation of immunoglobulin class-switched plasma cells. Immunity 2007;27:847–59. [DOI] [PMC free article] [PubMed] [Google Scholar]
- [32].O’Connell RM, Kahn D, Gibson WS, et al. MicroRNA-155 promotes autoimmune inflammation by enhancing inflammatory T cell development. Immunity 2010;33:607–19. [DOI] [PMC free article] [PubMed] [Google Scholar]
- [33].Yao R, Ma Y, Du Y, et al. The altered expression of inflammation-related microRNAs with microRNA-155 expression correlates with Th17 differentiation in patients with acute coronary syndrome. Cell Mol Immunol 2011;8:486–95. [DOI] [PMC free article] [PubMed] [Google Scholar]
- [34].Zheng L, Xu CC, Chen WD, et al. MicroRNA-155 regulates angiotensin II type 1 receptor expression and phenotypic differentiation in vascular adventitial fibroblasts. Biochem Biophys Res Commun 2010;400:483–8. [DOI] [PubMed] [Google Scholar]


