Abstract
Cryomacroscopy is an effective means to observe physical events affecting cryopreservation success in large-size specimens. The current study aims at integrating polarized-light in the study of large-size cryopreservation, using the scanning cryomacroscope as a development platform. Results of this study demonstrate polarized light as a visualization enhancement means, including the following effects: contaminants in the CPA solution, crystallization, fracture formation, thermal contraction, and solute precipitation. In addition, photoelasticity effects are used to demonstrate the development of residual stresses and the potential for stress relaxation above the glass transition temperature. Furthermore, this study suggests that the ability to periodically switch between non-polarized light and polarized light is an essential feature of investigation. When using polarized light for example, a dark region may represent a free-of-stress and free-of-crystals material, or fully crystallized material, which may potentially experience mechanical stress; switching to a non-polarized light would help to distinguish between the different cases. The analysis of thermo-mechanical stress in cryopreservation is essentially based on four key elements: identification of physical events, knowledge of physical properties, thermal analysis of the specimen, and description of the mechanical behavior of the cryopreserved material (also known as the constitutive law). With the above knowledge, one can investigate the conditions to preserve structural integrity. While the current study aims at identification of physical events, critical knowledge on physical properties and mechanical behavior has already been developed in previous studies. The companion manuscript (Part II) aims at providing means for thermal analysis in the specimen, which will serve as the basis for a multi-scale analysis of thermo-mechanical stress in large-size specimens.
Keywords: Cryomacroscopy, Polarized Light, Prototype, Photoelasticity, Vitrification, Crystallization, Synthetic Ice Modulator, Mechanical Stress, Fracture
Introduction
Vitrification—the suppression of ice formation—is considered an important alternative approach to cryopreservation (vitreous in Latin means glass) [13,20,21,42]. Although controlling ice formation per se has long been recognized critical to cryopreservation success [24,27,44], additional systemic phenomena may affect cryopreservation success, such as the inherent toxicity of cryoprotective agents (CPAs) [14] and thermo-mechanical stresses (also referred to as thermal stress) [31,44]. In fact, reduction of toxicity and thermal stress represent competing needs as described here on. Since the CPAs are inherently toxic, it is necessary to use their lowest possible concentration in order to promote glass formation [7,26]. In turn, the critical cooling rate to promote vitrification is inversely related to the CPA concentration necessary to promote vitrification, where the increase in cooling rate is associated with increase in thermo-mechanical stress. When the thermal stress exceeds the strength of the material, structural damage follows with fracture formation as the most spectacular outcome [39]. However, the cooling rate is not the only driving force to thermal stress, where crystallization and constrained contraction by the specimen container may also lead to structural damage [31].
At the cellular level, visualization of cryoprotocols is commonly done with cryomicroscopy means [8,19,22,25,36,40,43]. When cryomicroscopy is used to analyze large-size cryopreservation, representative micro-slices may be exposed to conditions similar to those that would exist in a large specimen at strategic points, such that a complete picture of the process can be piecewise-constructed. Unfortunately, since the kinetics of crystallization and, independently, the formation of stress are often affected by the size and shape of the sample (i.e., surface effects), the correlation between microscopic effects and large specimen vitrification may be weak. To bridge this gap, the cryomacroscope has been invented, with the objective of in situ visualization of macro-scale physical events [30].
Over the past decade, the development of cryomacroscopy has resulted in four prototypes for various applications. The first-generation prototype (Cryomacroscope I) was developed to study vitrification in a 15 mL vial, using a dedicated passive cooling mechanism, magnetic recording means, and a monochrome CCD camera [30,37]. Earlier cryomacroscopy results demonstrated that micro-fractures in the glassy state may serve as ice nucleation sites during the rewarming phase of the cryoprotocol [37], following cursory reports of this phenomenon [45,46]. That early device has been demonstrated as a critical tool to investigate mechanical stresses induced by the container walls [37]. Follow on studies focused on the correlation between crystallization, fracture formation, and functional recovery of blood vessels [1,2].
A dedicated apparatus to study solid-mechanics effects in thin films was the design objective for Cryomacroscope II [32]. This apparatus was designed to measure fracture strain, repeatability of fracturing events, patterns of fracture formation, and effects of stress concentration induced by tissue specimens [32]. In contrast to Cryomacroscope I, which was designed to study commonly practiced cryopreservation protocols, Cryomacroscope II was designed specifically to investigate solid mechanics effects, where the thin-film configuration was chosen for simplicity in modeling.
Cryomacroscope III has been designed to investigate physical events associated with vitrification in the presence of synthetic ice modulators (SIMs) [33]. The main improvement in Cryomacroscope III over Cryomacroscope I is that it has been redesigned as an add-on to a commercially available top-loading controlled-rate cooler, thereby improving its potential dissemination for the benefit of the cryobiology community. Additional improvements include a high-speed color camera, fiber-optics illumination, and a dedicated computer code to create a post-processed movie of the experimental study. Results of this study indicated improved suppression of crystallization with the application of SIMs and unexpected phenomenon of solutes precipitation during rewarming [33].
While Cryomacroscopes I–III were designed to visualize physical events with a stationary camera in a somewhat similar arrangement to the cryomicroscope, Cryomacroscope IV was designed for vertical scanning of samples larger than the field of view of the camera, using a computer-controlled stepper motor and a carriage system. Cryomacroscope IV was designed as an add-on unit for commercially available, top-loading, controlled-rate cooling chambers. These scanning capabilities enabled cryopreservation investigations on a wide range of specimen configurations, containers, and common thermal protocols [15]. Cryomacroscope IV served as a development platform for the integration of polarized-light in the current study.
The history of light polarization began with the discovery of the double refraction effect by Erasmus Bartholinus in 1669 [3]. Visualization of mechanical stresses in transparent-amorphous materials using polarized light was first documented by David Brewster in 1815 [5,6], which is also known as photoelasticity [18]. The physical principles of light, optics, and their role in photoelasticity have been well documented in the literature of the past two centuries, and are addressed herein only briefly, for the completeness of experimental-setup presentation.
When two similar polarization filters are placed on a common axis, parallel to one another in an orthogonal polarization orientation, any light ray pointing in the same axial direction will be blocked by the filters couple. The filter closer to the light source is commonly referred to as the polarizer and the other filter is commonly referred to as the analyzer or decoder. Any object placed in between the two filters may refract the propagating light, potentially causing some of it to pass through the analyzer. It is this refraction effect that may enhance visualization, even from small objects that otherwise could not have been seen using the same available optics. In the context of microscopy and cryobiology for example, Luyet [23] used polarized light to better view intermixed frozen and glassy regions in cells, whereas Menz and Luyet [25] enhanced the appearance of fractured surfaces at the cellular level.
Photoelasticity is a whole-field, stress-analysis method based on a coupled optical-mechanical property called birefringence, which is characteristic of many transparent media [18]. When a photoelastic specimen is placed between the polarizer and analyzer, fringe patterns are displayed, related to the difference between the principal stresses. In that setup, any unstressed area will appear dark as all the light will be blocked by the orthogonally oriented filters (hence the term dark-field photoelasticity). Areas of relatively higher stress will brighten due to altered polarization of the refracted light allowing it to pass through the analyzer filter, with increasing intensity that may extend over the entire visible spectrum, and even create a spectrum-repetition pattern as the stress further increases [18]. An experimenter may estimate the magnitude of the stress by quantifying the light spectra, but this process requires some a priori knowledge about the field of stress for calibration purposes.
The current study presents the first device prototype for polarized-light cryomacroscopy, using the established scanning cryomacroscope as a development platform [15]. The current study aims at demonstrating polarized-light as a visualization-enhancement means of physical events, as well as effects of photoelasticity for the study of cryopreservation by vitrification.
Experimental Apparatus
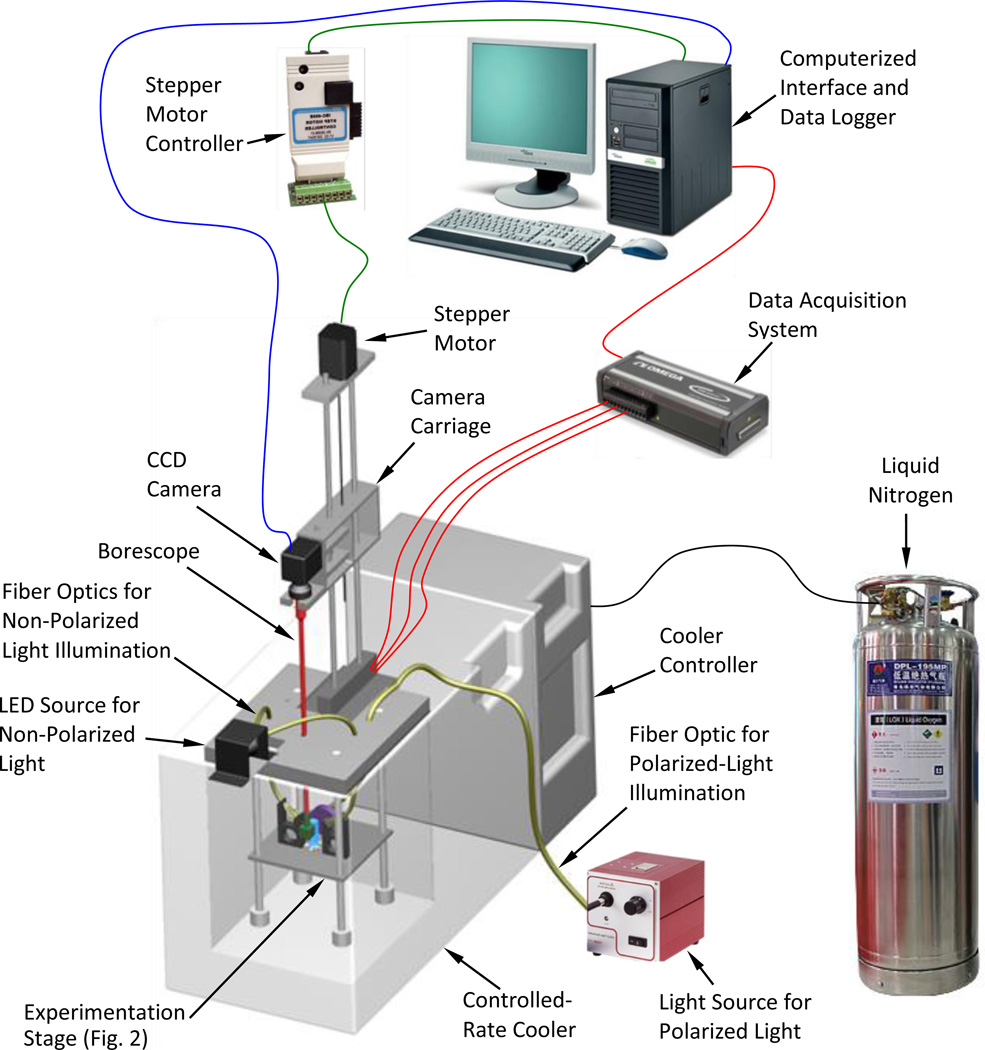
The scanning cryomacroscope has been presented previously [15] and is described here in brief only, for the completeness of presentation (Fig. 1). Emphasis in the current presentation is given to the newly added polarized-light means (Fig. 2). In general, due to the harsh environment surrounding the sample, all electronic components and mechanisms are placed externally to the cooling chamber. Light is delivered by various fiber-optics bundles, while the image of the specimen is delivered by means of a borescope (Hawkeye HH2992, Gradient Lens Corporation, Inc., NY, USA). The cryomacroscope comprises of the following key elements:
A commercial cooling chamber and controller (Kryo 10–16 controlled by Kryo 10–20, Planer PLC, UK).
A cryogenic stage placed within the cooling chamber (Fig. 2). This unit is essentially the experimentation platform, which has been modified for the purpose of the current study.
A high-speed, light-sensitive, CCD camera (Grasshopper, Point Grey Research, Inc., BC, Canada), connected to the external end of the borescope.
A stepper motor and a controller (AMH-22 controlled with DCB-274, Advanced Micro Systems, Inc., VT, USA) to facilitate vertical scanning.
A T-type thermocouples array (uncertainty of ±0.5°C or 0.4% of full scale) for monitoring the thermal history via a computerized data acquisition system (OMB-DAQ-56, Omega Engineering, Inc., controlled by DaqView™).
An LED light source and fiber-optics bundles to provide diffuse illumination onto the sample (End Glow 5/16” cables illuminated with Photon-Lite, FO Products, Inc.).
A polarized-light source, a dedicated fiber-optics bundle, a mirror, and filters, to provide polarized-light conditions as described below.
A proprietary cryomacroscope control code (C3) to (a) control the various cryomacroscope components, (b) real-time monitoring of images and temperatures, (c) data streamlining, and (d) post-processing to create a digital movie with time and temperature data overlaid.
Figure 1.
Schematic illustration of the scanning cryomacroscope incorporating polarized-light means.
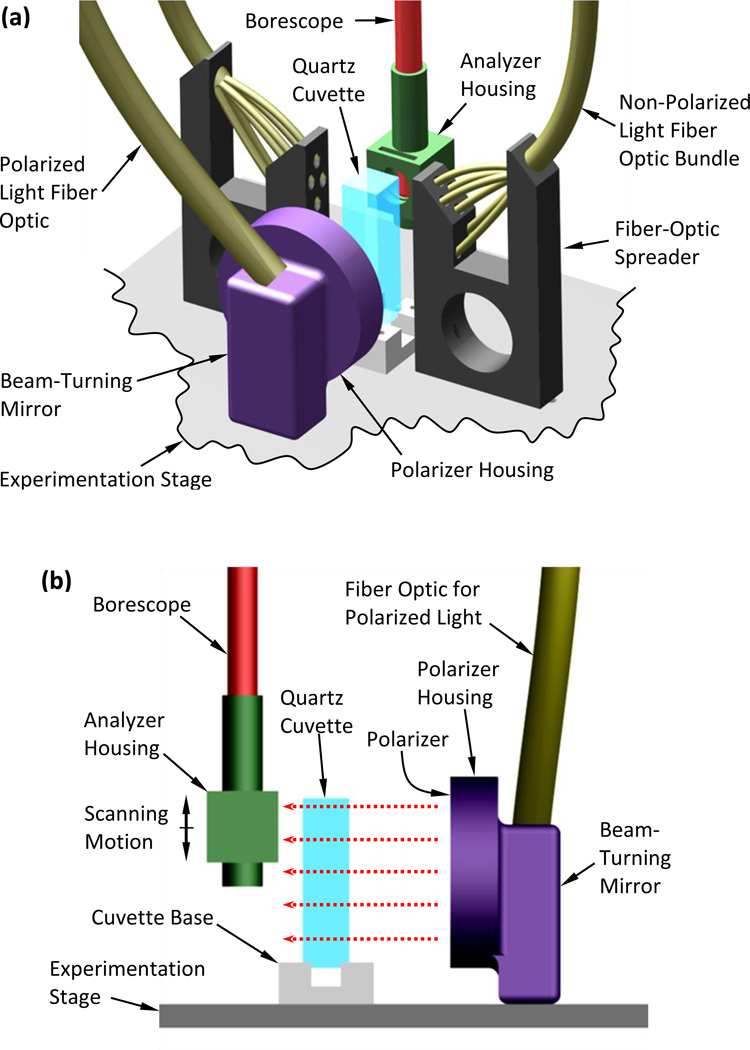
Figure 2.
Schematic illustration of the experimentation stage of the scanning cryomacroscope incorporating polarized-light means: (a) isometric view including all illumination components, (b) side view showing polarized-light components only, where the red-dashed arrows represent the direction of polarized light illumination.
While different transparent containers and vials can contain the specimen (Fig. 2), the current study uses a cuvette due to its superior optical properties and minimal specimen distortion. Two cuvette materials have been tested: a disposable polystyrene cuvette (Plastibrand, BRAND GMBH+ CO KG, Germany) and a quartz cuvette for cryogenic temperatures (NSG Precision Cells Inc.). While the polystyrene cuvette was found to be inexpensive and of acceptable optical clarity in non-polarized-light conditions [15], residual stresses and photoelastic effects prohibited its use in polarized-light conditions. While the quartz cuvette was found to be superior for photoelastic investigation, it is much more expensive and far more susceptible to structural failure when fractures form in the CPA domain. The quartz and polystyrene cuvettes are of the same dimensions (12.5 mm × 12.5 mm × 45 mm), which facilitates consistency in data analysis with previous studies [15].
The cryogenic stage is designed to alternate between non-polarized light and polarized light on demand. With reference to Fig. 2(a), the non-polarized light is directed perpendicular to the field of view, which was found to best enhance effects such as fractures and crystallization. The fiber-optics spreader has been designed and 3D-printed (ABS) for illumination at 45° to the cuvette surface, in order to further prevent reflections from the cuvette outer surfaces.
To facilitate the polarized-light investigation, light was delivered from an external halogen-light source (150W at 3200K, Thorlabs Inc.), through a high-quality fiber-optics bundle (91 cm in length, 6.4 mm in diameter; Core Fiber Bundle, Thorlabs Inc.) to an aluminum housing of a silver-coated, beam-turning mirror (97.5% reflectivity, Thorlabs Inc.). The mirror directs the light perpendicular to the polarizer (50 mm in diameter), illuminating the cuvette in the direction of the red-dashed arrows in Fig. 2(b). An analyzer (12.5 mm in diameter) has been retrofitted to the tip of the borescope by means of a 3D-printed (ABS) housing. Note that the borescope setup includes an internal 45° mirror to reflect the polarized light into the axial direction of the borescope. Both polarizer and decoder are made of a 0.3 mm-thick dichroic polarizing film sheet (>99% efficiency, Thorlabs Inc.), sandwiched between two protective glass windows. Each window has an antireflective coating which is optimized for the visible part of the spectrum (0.4 µm to 0.7 µm).
Materials and Methods
Tested Materials
Consistent with previous studies [9,11,15], three glass promoting compounds are investigated: high-concentration dimethyl sulfoxide (DMSO), the CPA cocktail DP6, and DP6 mixed with selected SIMs. It has been demonstrated that DMSO concentrations of 6M and higher serve as a good reference solution for thermo-mechanical stress analysis in large-size vitrification [29]. DP6 is a mixture of 3M DMSO and 3M propylene glycol in a buffer solution. Two buffer solutions are demonstrated in the current study, Euro-Collins and Unisol-CV, which may affect the quality of visualization [33]. In addition, DP6 combined with the synthetic ice modulator (SIM) 6% 2,3 butanediol (2,3-BD) has been investigated [33].
Thermal Protocol
Consistent with previous studies, a six-step cryogenic protocol has been applied [15,30,33]:
Precooling the specimen to about 5°C (T0), to reduce condensation effects.
Rapid cooling of the specimen at a rate of H1 down to an intermediate temperature of T1.
Slow cooling the specimen at a rate of H2 down to a storage temperature of Ts.
Storing the specimen at Ts for a potentially indefinite period of time.
Slow rewarming of the sample at a slow rate of H3 back to T1.
Rapid rewarming at a rate of H4 back to room temperature.
The temperature range between T0 and T1 is characterized by a relatively low viscosity and high probability of crystal growth. Hence H1 and H4 are selected to exceed the critical cooling and rewarming rates to suppress crystallization [33]. The temperature range between T1 and Ts is characterized by a relatively high viscosity and low probability of crystal growth, while the slow rate is designed to reduce mechanical stress (i.e., facilitating stress relaxation) and, thereby, structural damage [10,15]. The typical order of magnitude for H1, H2, H3, and H4 are 101 °C/min, 100 °C/min, 100 °C/min, and 102 °C/min respectively. The minimum rates required to suppress crystallization during the higher temperature cooling/rewarming stages are commonly referred to as the critical rates and vary among different CPAs. Note that this study focuses on observed polarized effects, which are primarily observed below T1; hence H4 was set the same as H3 as a choice of practice.
Polarized-light Protocol
Prior to experimentation, the rotational orientation of the polarizer and analyzer were set perpendicular to one another. In practice, this is achieved by rotating the polarizer in its housing until the illuminated image under investigation appears dark. Next, the brightness dial on the halogen-light source was preset in the range of 0 to 150 W, based on the particular experiment. Maintaining a repeatable illumination power is critical for a comparative study of visualization effects under similar conditions. While the highest brightness level (150W) may be optimal for detecting the onset of crystallization and early stress formation, the increasing level of stress may cause saturation to the CCD sensors, leading to blurring and low definition between repeated color-spectra in photoelasticity. For the current combination of CCD camera, polarizer, decoder, and optical components, an illumination power range of 55W to 95W was found to produce the best outcome. In particular a power setting of 55W was found most effective to visualize photoelasticity effects below glass transition, while a power setting of 95W was selected to detect early stress development and the onset of crystallization.
Results and Discussion
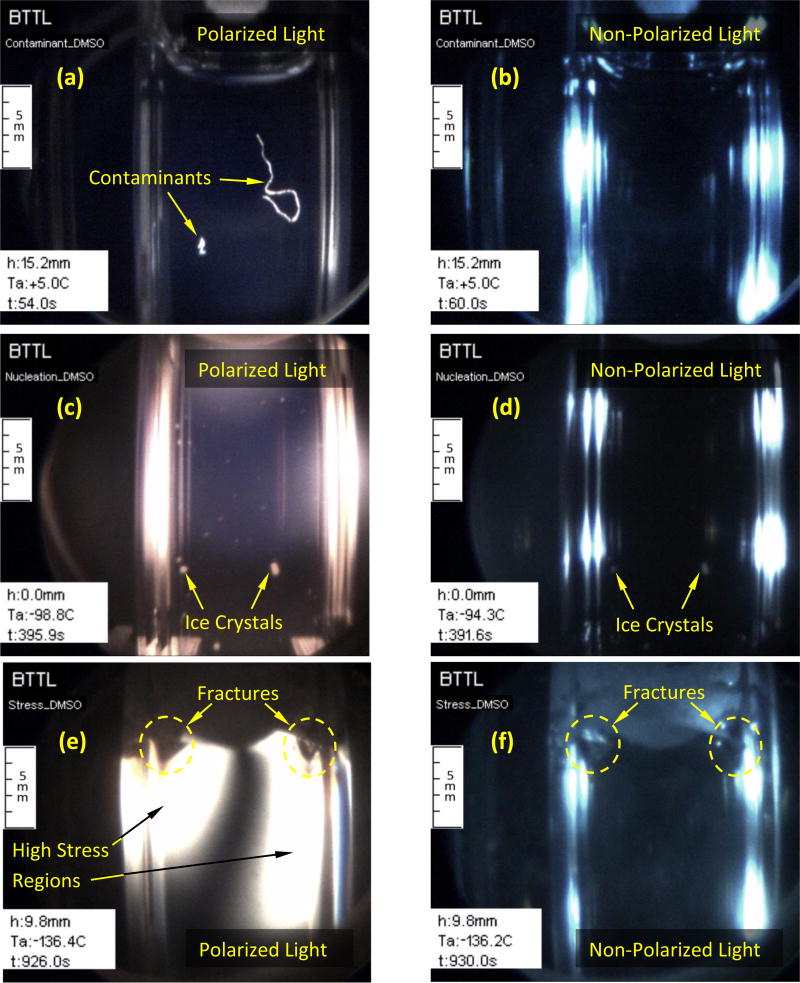
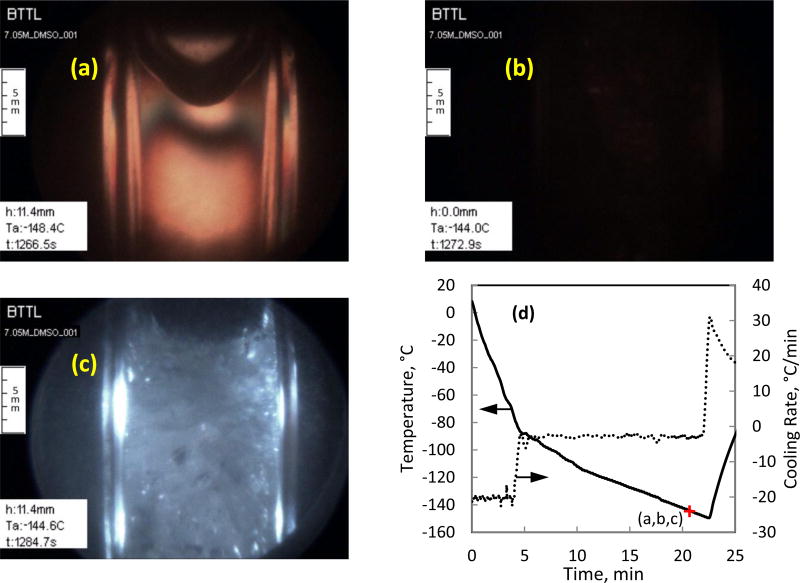
Table 1 lists the key thermal protocol parameters for experiments described below. Figure 3 demonstrates four key effects along the cryoprotocol on DMSO solutions: CPA contamination, vitrification, crystallization, and fracture formation. Three controlled parameters are displayed in Fig. 3, which are overlaid by C3 during movie post processing [15]: h is the vertical scanning distance measured from a reference point set by the operator, Ta is the current cooling chamber temperature, and t is the elapsed time from the beginning of the protocol. The thread-like contaminant in Fig. 3(a) is about 8 mm long and 0.08 ± 0.015 mm in diameter (one pixel equals up to 15 µm for the specific depth of field). Interestingly, the contaminants drift with free (natural) heat-convection currents, which are typical in the early stage of cooling, when the viscosity of the CPA is low (water-like) [10] and when the temperature gradients within the CPA are significant. Contaminants and foreign objects have been shown to serve as heterogeneous ice-nucleation sites [2,15]. Furthermore, the presence of foreign bodies may affect the developing thermo-mechanical stress, where very small tissue segments have previously been shown to either initiate or arrest fractures in the vitrified domain [32]. Figure 3(b), demonstrates that non-polarized light is ineffective for containments detection; bright light reflections mark the cuvette walls parallel to the direction of view.
Table 1.
Cryoprotocol parameters for the experiments displayed in Figs. 3–8
| Figure | Material |
H1, °C/min |
T1, °C |
H2, °C/min |
Ts, °C |
H3 and H4 °C/min |
Illumination Power, W |
|---|---|---|---|---|---|---|---|
| 3a | 7.05M DMSO | −5 | N/A | −5 | −80 | +10 | 95 |
| 3b | 6M DMSO | −25 | N/A | −25 | −150 | +10 | 95 |
| 3c | 7.05M DMSO | −10 | N/A | 10 | −150 | +10 | 95 |
| 4 | 6M DMSO | −50 | −110 | −3 | −140 | +10 | 95 |
| 5 | 7.05M DMSO | −20 | −80 | −3 | −145 | +10 | 55 |
| 6 | 7.05M DMSO | −20 | −124.4±0.3 | −3 | −145 | +10 | 95 |
| 7 | DP6 + 6% 2,3-BD | −20 | −80 | −3 | −125 | +10 | 75 |
Figure 3.
Comparison of polarized light and non-polarized light visualization on DMSO solutions: (a) large contaminants otherwise invisible in non-polarized light (b); (c) improved ability to detect crystal formation with polarized light in comparison with non-polarized illumination (d); and, (e) photoelasticity effects and fractures in comparison with non-polarized illumination (f). (a, b, e, and f, where obtained with 7.05M DMSO; c and d where obtained with 6M DMSO)
Figure 3(c) displays improved ability to detect ice crystals at earlier stages of growth due to the contrast enhancement capability of polarized light, while Fig. 3(d) displays reduced capability when non-polarized light is used. Furthermore, polarized light enables the usage of higher illumination intensity without reflections or glare.
Figure 3(e) displays two effects associated with thermo-mechanical stresses. By means of photoelasticity, the bright areas in the image represent regions of high stress. The presence of stress in the material results in altered polarization of light, where its brightness increases with the increasing stress (but not linearly). When the stress further increases, the brightness spectrum will be traversed, a dark band will appear, and another spectrum will repeat. However, the stress level in the current study is usually not high enough to display more than one or two spectra. For reference, Fig. 3(f) displays the specimen under the same condition after switching to non-polarized light. The second thermo-mechanical effect displayed in these images is fracturing, where polarized light enhances their appearance.
A fully crystallized region can be observed along the upper surface of the specimen in Fig. 3(f). Crystallization in this area is associated with interface effects (CPA-air), in addition to localized lower cooling and rewarming rates [15]. The same frozen region appears completely dark in polarized light. This observation illustrates the complexity of interpreting polarized-light images in cryopreservation processes, where a dark region may represent a free-of-stress and free-of-crystals material, or fully crystallized material, which may potentially experience mechanical stress. Hence, the ability to switch between polarized light and non-polarized light frequently is essential to alleviate difficulties in image interpretation.
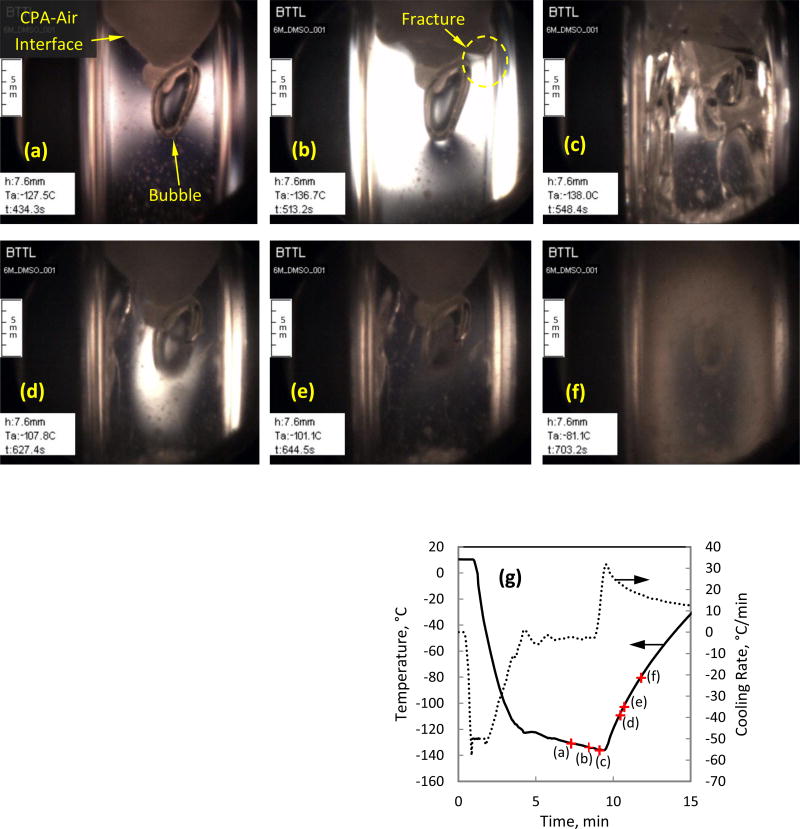
Figure 4(a) displays an air bubble trapped below a frozen interface of 6M DMSO, where its formation can be explained as follows. The CPA contracts during cooling, with a higher tendency to flow near the center of the domain, where temperatures are higher and the viscosity is lower. Due to the lower cooling rate at the upper surface, a layer of crystals forms there, which prevents the continuation of natural flow driven by thermal contraction of the CPA (associated with the physical property of thermal expansion). As the cooling process progresses, mechanical stress fractures the frozen layer and air penetrates through it, as the CPA continues to contract.
Figure 4.
Images from an experiment on 6M DMSO with polarized-light illumination: (a) early stress development in the presence of sparse ice crystals, a completely crystallized CPA-air interface, and a large air bubble trapped below the crystallized interface; (b) increased stress level throughout the vitrified domain, and early fractures; (c) increased fracturing in the vitrified domain during cooling; (d) healing of fractures and annealing of stresses during rewarming, while significant stress remains at the center of the cuvette around the air bubble; (e) advanced stress relaxation, while some fractures are still observable; (f) onset of rewarming-phase crystallization (RPC) within the CPA, preventing light transmission; and (g) thermal history in the cooling chamber.
Figure 4(a) also displays CPA crystals dispersed within the domain and an elevated level of stress on both sides of the air bubble. This stress intensifies in Fig. 4(b), as the vitrified CPA gains an elastic behavior below the glass transition temperature, Tg (in the range of −132.5°C to −131°C for 6 M DMSO [17,35]). Figure 4(b) displays a saturated CCD sensor, which may obscure the presence of multiple spectra; unfortunately a lower illumination power would degrade ice crystals detection earlier at higher temperatures. An auto-illumination power capability would alleviate this difficulty, but would require further development, which is beyond the scope of the current study. Further note the artifact of stress concentration at the bottom of the trapped air bubble in Fig. 4(b), which is associated with the small radius of interface curvature. The sporadic ice crystals do not seem to affect stress formation in those images.
Figure 4(c) displays partial fracturing throughout the vitrified domain during cooling, where photoelastic effects suggest a decreased stress level. Since the many of the fractures that can be observed in Fig. 4(c) cannot be observed in Fig. 4(d) anymore, a fracture-healing process during rewarming can be concluded, while stresses are still evident around the air bubble and some fractures are still visible in the domain. The large fracture on the left in Fig. 4(d) is actually a fracture in the cuvette wall itself, which remains visible in Fig. 4(e), after all other photoelastic effects disappeared. Note that the image in Fig. 4(e) is taken when the chamber temperature reaches −101.1°C, which has been shown as an adequate annealing temperature in previous studies [10,12,34]. The CPA viscosity at this temperature is low enough to permit flow in order to reduce stresses, but high enough to prevent any significant rate of crystallization. Figure 4(f) displays advanced rewarming-phase crystallization (RPC), where the viscosity is low enough to permit a significant rate of crystallization. Note that the entire opacity effect in Fig. 4(f) is actually the result of crystallization, but some of it may be attributed to solute precipitation [33].
Figure 5(a) displays the distribution of stress in a perfectly vitrified sample, in the absence of air bubbles, artifacts, and ice crystals. A power setting of 55 W is used during this experiment, enabling two photoelastic spectra to be visible. The relatively rapid change of colors at the upper corners represent steeper stress gradient, which may explain why fractures more frequently appear at that location. Figure 5(b) displays the effect of dramatic stress release as a result of a dense fracture network, as seen with non-polarized light in Fig. 5(c).
Figure 5.
Images from an experiment on 7.05M DMSO: (a) photoelastic effects near storage temperature; (b) polarized-light image, darkness due to intense fractures in the vitrified domain (6.4 s after image (a)); (c) non-polarized light image of the fractured material; and (d) thermal history in the cooling chamber.
Residual Stress and Annealing Effects
Residual stresses are mechanical stresses that remain in the material after their original cause has been removed [10,38]. The following thought experiment illustrates how residual stresses may develop in the cuvette during vitrification. Consider a cryoprotocol in which the wall temperature decreases at a constant rate. Further assume that cooling has prevailed for a significantly long period of time, such that every point in the cuvette is cooled at the exact same cooling rate. The cooling-rate uniformity does not prohibit temperature variation across the cuvette, where in fact the center of the cuvette would be warmer than the outer wall. The CPA contracts with the decreasing temperature, initially as a liquid and later on as a solid. If the material rate of contraction (i.e., the thermal expansion coefficient) is constant, no stresses would develop during cooling as the material approaches the glass transition temperature. Once the CPA gets to the storage temperature, cooling at the outer wall will cease and the material will approach thermal equilibrium. However, when this equilibration prevails below the glass transition temperature, differential contraction in the CPA will give rise to stresses, which are essentially the residual stresses. These residual stresses are expected to be tensile at the center of the domain when the cuvette geometry is considered [37]. If the stress level during thermal equilibration reaches the strength of the material, fracture formation will follow.
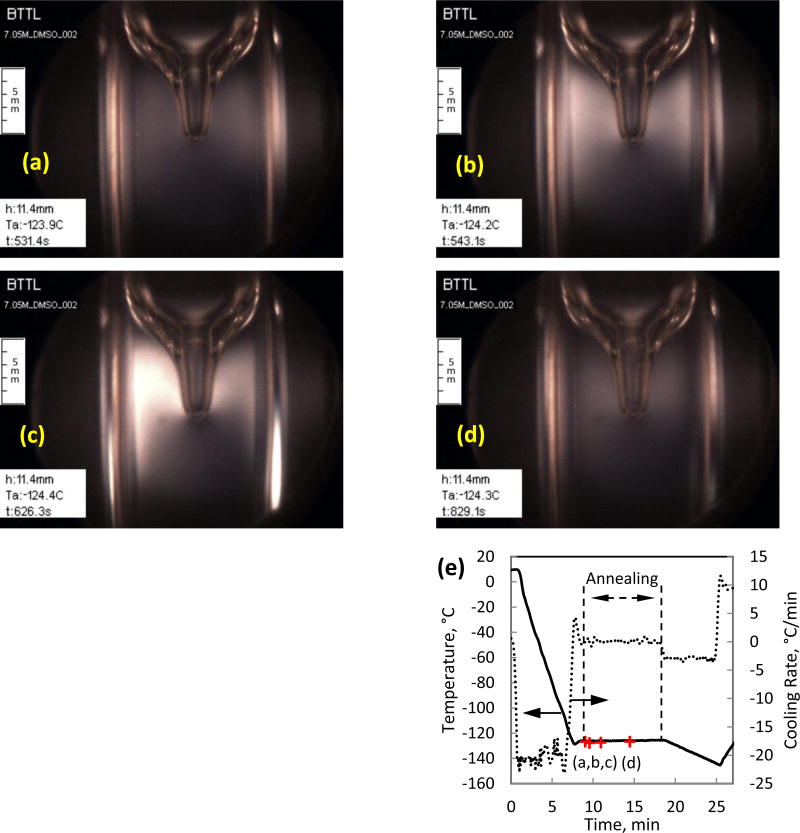
Increasing the cooling rate in order to ensure vitrification and decreasing the cooling rate in order to reduce residual stresses, represent competing needs. One possible solution to decrease the level of residual stress involves a three-stage cooling process: (i) rapid cooling at higher temperatures to prevent crystallization, (ii) thermal equilibration at an intermediate temperature above glass transition to allow for stresses due to differential contraction to creep away (also known as annealing), and (iii) slow cooling at lower temperatures to minimize the buildup of residual stresses. As a part of such a three-stage cooling protocol, Fig. 6 displays annealing effects in 7.05M DMSO. An annealing temperature of −124.4±0.3°C was selected for a duration of 10 minutes, which is about 7°C above the glass transition temperature as measured by DSC (Tg in the range of −130°C [29] and −132°C [35]).
Figure 6.
Residual stress development and stress relaxation in 7.05M DMSO, during an intermediate temperature-hold at : (a) stress starts to build up at the beginning of the temperature-hold of −124.4±0.3°C; (b) stress level continues to increase with its maximum value propagating inwards towards the cavity; (c) maximum stress observed at approximately 90 seconds after the beginning of the temperature-hold period; (d) significant stress relaxation after about 5 minutes; and (e) thermal history in the cooling chamber.
By means of photoelasticity, it can be seen from Figs. 6(a)–6(d) that stresses first develop and then creep away during the temperature-hold period. Stress development during the early stage of that period is consistent with the above thought experiment on residual stresses. Stress relaxation at a later stage of that period illustrates annealing within a practical time scale of minutes. However, the cavity that formed at the center of the CPA-air interface (appears as the top portion of a wine glass) does not disappear during the same period of time. This indicates that gravity-driven forces play no role in the process and only significant mechanical stresses can cause CPA flow at the corresponding high material viscosity [28]. Note that no crystals are observed in this experiment due to the initial high cooling rate, and no crystals formed during the intermediate hold period although it is above Tg, which is consistent with the high viscosity values [28] and the kinetics of crystallization [4]. Further discussion on the relationship between the annealing temperature and hold time is given in [10].
Solute Precipitation in CPA + SIM Cocktails
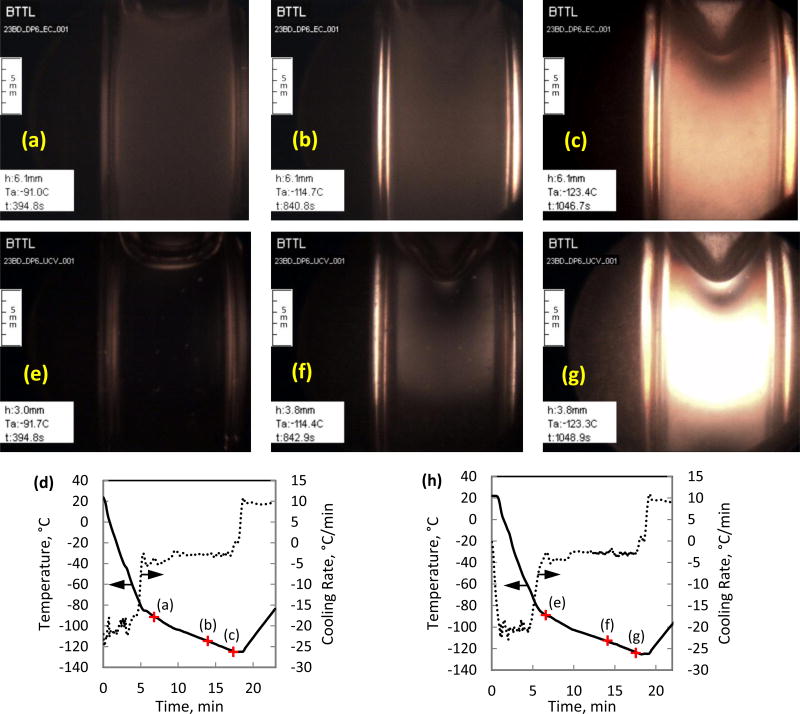
A recent study investigated precipitation of solutes during cooling of a variety of CPA cocktails and SIMs using non-polarized light [33]. While no data has been reported on the relationship between the effectiveness of cryopreservation via vitrification and solute precipitation, it has a significant effect on the ability to visualize physical events during vitrification. Figure 7 displays selected polarized-light images from two similar cryoprotocols on the cocktail DP6 + 6% 2,3-BD, where the vehicle solution used is either Euro-Collins or Unisol-CV [41] (both with a light-source power of 75W).
Figure 7.
Vitrification of DP6 combined with the SIM 6% 2,3-Butandiol, using two different vehicle solutions, Euro-Collins (a–c) and Unisol-CV (e–g), where Euro-Collins displays precipitation artifacts expressed as a cloudy image: (a) and (e) represent the lower boundary for observable precipitation, around −91.5°C; (b) and (f) were taken around −114.5°C, where the glass transition temperature of DP6 is −119°C; (c) and (g) were taken about 4.3°C below the glass transition temperature for DP6, where the material exhibits increased stress; and (d) and (h) display the thermal history in the cooling chamber, respectively.
A cloudy artifact is observed only with the Euro-Collins solution cocktail for the selected cooling protocol, Figs. 7(a)–7(c). Additional experiments revealed that the same artifact is not affected by the SIM type used, or of the buffering solution (HEPES). This artifact is believed to be associated with solute precipitation from the Euro-Collins and not with crystal formation for the following reasons: (i) this artifact is path independent, expressed in a uniform intensity at a given temperature regardless of cryogenic protocol; (ii) it is not probabilistic in nature and is independent of location; (iii) it does not exhibit growth; and, (iv) it is visible with both polarized and non-polarized light.
Summary and Conclusions
Cryomacroscopy is an effective means to observe physical events affecting cryopreservation success in large-size specimens. Four generations of cryomacroscopes have been developed in the past decade, aiming at different aspects of cryopreservation investigation. The scanning cryomacroscope represents the most development in this line of research, aiming at the in situ investigation of large specimens in commercially available, controlled-rate cooling chambers. The current study aims at the integration of polarized light means with scanning cryomacroscopy.
Results of this study demonstrate polarized light as a visualization enhancement means, including the following effects: (i) contaminants in the CPA solution, (ii) crystallization, (iii) fracture formation, (iv) thermal contraction, and (v) solute precipitation. In addition, photoelasticity is demonstrated, expressed as light spectra effects driven by mechanical stresses. By means of photoelasticity, this study explains and demonstrates the development of residual stresses and the possibility for stress relaxation above the glass transition temperature. Furthermore, this study suggests that the ability to periodically toggle between non-polarized light and polarized light is essential for the investigation of the above physical events.
The analysis of thermo-mechanical stress in cryopreservation is essentially based on four key elements: (i) identification of physical events, (ii) knowledge of physical properties, (iii) thermal analysis of the specimen, and (iv) description of the mechanical behavior of the cryopreserved material (also known as the constitutive law). With the above knowledge, one can investigate the conditions to preserve structural integrity. While the current study aims at identification of physical events, critical knowledge on physical properties and mechanical behavior has already been developed in previous studies. The companion manuscript (Part II [16]) aims at providing the means for thermal analysis in the specimen, which will serve as the basis for a multi-scale analysis of thermo-mechanical stress in the system.
Acknowledgments
This project has been supported by Award R21RR026210 from the National Center for Research Resources (NCRR), Award R21GM103407 from the National Institute of General Medical Sciences (NIGMS), and Award R01HL127618 from the National Heart Lung and Blood Institute (NHLBI). The content is solely the responsibility of the authors and does not necessarily represent the official views of the National Institutes of Health.
References
- 1.Baicu S, Taylor MJ, Chen Z, Rabin Y. Vitrification of carotid artery segments: An integrated study of thermophysical events and functional recovery towards scale-up for clinical applications. Cell Preservation Technology. 2006;4(4):236–234. doi: 10.1089/cpt.2006.9994. [DOI] [PMC free article] [PubMed] [Google Scholar]
- 2.Baicu S, Taylor MJ, Chen Z, Rabin Y. Cryopreservation of carotid artery segments via vitrification subject to marginal thermal conditions: Correlation of freezing visualization with functional recovery. Cryobiology. 2008;57(1):1–8. doi: 10.1016/j.cryobiol.2008.03.002. [DOI] [PMC free article] [PubMed] [Google Scholar]
- 3.Bartholin E. Westtown, PA: 1669. Experimenta crystalli islandici disdiaclastici quibus mira & insolita refractio detegitur (Copenhagen ("Hafniæ"), Denmark: Daniel Paulli). English translation: Experiments with the double refracting Iceland crystal which led to the discovery of a marvelous and strange refraction, tr. by Werner Brandt. 1959. [Google Scholar]
- 4.Baudot A, Alger L, Boutron P. Glass-forming tendency in the system water–dimethyl sulfoxide. Cryobiology. 2000;40(2):151–158. doi: 10.1006/cryo.2000.2234. [DOI] [PubMed] [Google Scholar]
- 5.Brewster D. Experiments on the depolarization of light as exhibited by various mineral, animal and vegetable bodies with a reference of the phenomena to the general principle of polarization. Philosophical Transactions of the Royal Society. 1815;105:29–53. [Google Scholar]
- 6.Brewster D. On the communication of the structure of doubly-refracting crystals to glass, murite of soda, flour spar, and other substances by mechanical compression and dilation. Philosophical Transactions of the Royal Society. 1816;106:156–178. [Google Scholar]
- 7.Brockbank KG, Taylor MJ. Tissue Preservation. In: Baust JG, Baust JM, editors. Advances in Biopreservation. Chap. 8. Boca Raton, USA: CRC Press; 2006. pp. 157–196. [Google Scholar]
- 8.Diller KR, Cravalho EG. A cryomicroscope for the study of freezing and thawing processes in biological cells. Cryobiology. 1970;7(4):191–199. doi: 10.1016/0011-2240(70)90021-0. [DOI] [PubMed] [Google Scholar]
- 9.Eisenberg DP, Taylor MJ, Rabin Y. Thermal expansion of DP6 combined with synthetic ice modulators in presence and absence of biological tissues. Cryobiology. 2012;65(2):117–125. doi: 10.1016/j.cryobiol.2012.04.011. [DOI] [PMC free article] [PubMed] [Google Scholar]
- 10.Eisenberg DP, Steif PS, Rabin Y. On the effects of thermal history on the development and relaxation of thermo-mechanical stress in cryopreservation. Cryogenics. 2014;64:86–94. doi: 10.1016/j.cryogenics.2014.09.005. [DOI] [PMC free article] [PubMed] [Google Scholar]
- 11.Eisenberg DP, Taylor MJ, Jimenez-Rios JL, Rabin Y. Thermal expansion of vitrified blood vessels permeated with dp6 and synthetic ice modulators. Cryobiology. 2014;68(3):318–326. doi: 10.1016/j.cryobiol.2014.04.010. [DOI] [PMC free article] [PubMed] [Google Scholar]
- 12.Eisenberg DP, Bischof JC, Rabin Y. Thermo-mechanical stress in cryopreservation via vitrification with nanoparticle heating as a stress-moderating effect. ASME Journal of Biomechanical Engineering. 2015;138(1) doi: 10.1115/1.4032053. [DOI] [PubMed] [Google Scholar]
- 13.Fahy GM, MacFarlane DR, Angell CA, Meryman HT. Vitrification as an approach to cryopreservation. Cryobiology. 1984;21(4):407–426. doi: 10.1016/0011-2240(84)90079-8. [DOI] [PubMed] [Google Scholar]
- 14.Fahy GM. The relevance of cryoprotectant “toxicity” to cryobiology. Cryobiology. 1986;23(1):1–13. doi: 10.1016/0011-2240(86)90013-1. [DOI] [PubMed] [Google Scholar]
- 15.Feig JSG, Rabin Y. The scanning cryomacroscope with applications to cryopreservation – a device prototype. Cryogenics. 2014;62:118–128. doi: 10.1016/j.cryogenics.2014.04.017. [DOI] [PMC free article] [PubMed] [Google Scholar]
- 16.Feig JSG, Solanki PK, Eisenberg DP, Rabin Y. Polarized light scanning cryomacroscopy, Part II: Thermal modeling and analysis of experimental observations. Cryobiology. 2016;73(2):272–81. doi: 10.1016/j.cryobiol.2016.06.004. [DOI] [PMC free article] [PubMed] [Google Scholar]
- 17.Hey JM, MacFarlane DR. Crystallization of ice in aqueous solutions of glycerol and dimethyl sulfoxide. 1. A Comparison of Mechanisms. Cryobiology. 1996;33(2):205–216. doi: 10.1006/cryo.1996.0021. [DOI] [PubMed] [Google Scholar]
- 18.Jessop HT, Harris FC. Photoelasticity: Principles and Methods. New York: Dover Publications; 1949. [Google Scholar]
- 19.Kroener C, Luyet BJ. Formation of cracks during the vitrification of glycerol solutions and disappearance of the cracks during rewarming. Biodynamica. 1966;10(198):47–52. [PubMed] [Google Scholar]
- 20.Luyet BJ. The vitrification of organic colloids and of protoplasm. Biodynamica. 1937;1(29):1–14. [Google Scholar]
- 21.Luyet BJ, Gehenio PM. Biodynamica. Normandy, MO: 1940. Life and Death at Low Temperatures. [Google Scholar]
- 22.Luyet B, Rapatz G. An automatic regulated refrigeration system for small laboratory equipment and a microscope cooling stage. Biodynamica. 1957;7(153–155):337–345. [PubMed] [Google Scholar]
- 23.Luyet BJ. An attempt at a systematic analysis of the notion of freezing rates and at an evaluation of the main contributory factors. Cryobiology. 1966;2(4):198–205. doi: 10.1016/s0011-2240(66)80167-0. [DOI] [PubMed] [Google Scholar]
- 24.Mazur P. Principles of Cryobiology. In: Fuller B, Lane N, Benson E, editors. Life in the Frozen State. New York, USA: CRC Press; 2004. pp. 3–67. [Google Scholar]
- 25.Menz JJ, Luyet BJ. A study of the lines of fracture observed in freeze-drying of aqueous solutions crystallized into spherulites. Biodynamica. 1965;9(191):265–275. [PubMed] [Google Scholar]
- 26.Meryman H. Cryoprotective agents. Cryobiology. 1971;8(2):173–183. doi: 10.1016/0011-2240(71)90024-1. [DOI] [PubMed] [Google Scholar]
- 27.Muldrew K, Acker JP, Elliott JAW, McGann LE. The water to ice transition: implications for living cells. In: Fuller B, Lane N, Benson E, editors. Life in the Frozen State. New York, USA: CRC Press; 2004. pp. 67–103. [Google Scholar]
- 28.Noday DA, Steif PS, Rabin Y. Viscosity of cryoprotective agents near glass transition: a new device, technique, and data on DMSO, DP6, and VS55. Exp. Mech. 2009;49(5):663–672. doi: 10.1007/s11340-008-9191-8. [DOI] [PMC free article] [PubMed] [Google Scholar]
- 29.Plitz J, Rabin Y, Walsh JR. The effect of thermal expansion of ingredients on the cocktails VS55 and DP6. Cell Preservation Technology. 2004;2(3):215–226. [Google Scholar]
- 30.Rabin Y, Taylor MJ, Walsh JR, Baicu S, Steif PS. Cryomacroscopy of vitrification, Part I: A prototype and experimental observations on the cocktails VS55 and DP6. Cell Preservation Technology. 2005;3(3):169–183. doi: 10.1089/cpt.2005.3.169. [DOI] [PMC free article] [PubMed] [Google Scholar]
- 31.Rabin Y, Steif PS. Solid mechanics aspect of cryobiology. In: Baust JG, Baust JM, editors. Advances in Biopreservation. Chap. 13. Boca Raton, USA: CRC Press; 2006. pp. 359–382. [Google Scholar]
- 32.Rabin Y, Steif PS, Hess KC, Jimenez-Rios JL, Palastro MC. Fracture formation in vitrified thin films of cryoprotectants. Cryobiology. 2006;53(1):75–95. doi: 10.1016/j.cryobiol.2006.03.013. Website in 16 conjunction with this paper: http://www.andrew.cmu.edu/user/yr25/CryomacroscopyImages02/index.htm. [DOI] [PMC free article] [PubMed] [Google Scholar]
- 33.Rabin Y, Taylor MJ, Feig JSG, Baicu S, Chen Z. A new cryomacroscope device (Type III) for visualization of physical events in cryopreservation with applications to vitrification and synthetic ice modulators. Cryobiology. 2013;67(3):264–273. doi: 10.1016/j.cryobiol.2013.08.005. [DOI] [PMC free article] [PubMed] [Google Scholar]
- 34.Rajamohan A, Leopold RA. Cryopreservation of Mexican fruit flies by vitrification: stage selection and avoidance of thermal stresses. Cryobiology. 2007;54(1):44–54. doi: 10.1016/j.cryobiol.2006.10.192. [DOI] [PubMed] [Google Scholar]
- 35.Rasmussen DH, MacKenzie AP. Phase diagram for the system water-dimethylsuphoxide. Nature. 1968;220:315–317. doi: 10.1038/2201315a0. [DOI] [PubMed] [Google Scholar]
- 36.Spindler R, Rosenhahn B, Hofmann N, Glasmacher B. Video analysis of osmotic cell response during cryopreservation. Cryobiology. 2012;64(3):250–260. doi: 10.1016/j.cryobiol.2012.02.008. [DOI] [PubMed] [Google Scholar]
- 37.Steif PS, Palastro MC, Wen CR, Baicu S, Taylor MJ, Rabin Y. Cryomacroscopy of vitrification, Part II: Experimental observations and analysis of 2 fracture formation in vitrified VS55 and DP6. Cell Preservation Technology. 2005;3(3):184–200. doi: 10.1089/cpt.2005.3.184. Website in conjunction with this paper: http://www.andrew.cmu.edu/user/yr25/CryomacroscopyImages01.htm. [DOI] [PMC free article] [PubMed] [Google Scholar]
- 38.Steif PS, Palastro MC, Rabin Y. The effect of temperature gradients on stress development during cryopreservation via vitrification. Cell Preservation Technology. 2007;5(2):104–115. doi: 10.1089/cpt.2007.9994. [DOI] [PMC free article] [PubMed] [Google Scholar]
- 39.Steif P, Noday D, Rabin Y. Can thermal expansion differences between cryopreserved tissue and cryoprotective agents alone cause cracking? Cryo Letters. 2009;29(6):414–421. [PMC free article] [PubMed] [Google Scholar]
- 40.Stott SL, Karlsson JOM. Visualization of intracellular ice formation using high-speed video cryomicroscopy. Cryobiology. 2009;58(1):84–95. doi: 10.1016/j.cryobiol.2008.11.003. [DOI] [PubMed] [Google Scholar]
- 41.Taylor MJ, Campbell LH, Rutledge RN, Brockbank KGM. Comparison of Unisol with Euro Collins solution as a vehicle solution for cryoprotectants. Transplantation Proceedings. 2001;33(1–2):677–679. doi: 10.1016/s0041-1345(00)02198-9. [DOI] [PubMed] [Google Scholar]
- 42.Taylor MJ, Song Y, Brockbank KG. Vitrification in tissue preservation: New developments. In: Fuller B, Lane N, Benson E, editors. Life in the Frozen State. New York, USA: CRC Press; 2004. pp. 603–641. [Google Scholar]
- 43.Toner M, Cravalho EG, Karel M, Armant DR. Cryomicroscopic analysis of intracellular ice formation during freezing of mouse oocytes without cryoadditives. Cryobiology. 1991;28(1):55–71. doi: 10.1016/0011-2240(91)90008-c. [DOI] [PubMed] [Google Scholar]
- 44.Wolfe J, Bryant G. Cellular cryobiology: thermodynamic and mechanical effects. International Journal of Refrigeration. 2001;24:438–450. [Google Scholar]
- 45.Williams RJ, Carnahan DL. Four modes of nucleation in viscous solutions. Cryobiology. 1989;26(6):568. [Google Scholar]
- 46.Williams RJ, Carnahan DL. Fracture faces and other interfaces as ice nucleation sites. Cryobiology. 1990;27(5):479–482. doi: 10.1016/0011-2240(90)90036-4. [DOI] [PubMed] [Google Scholar]


