Abstract
This study aims at developing thermal analysis tools and explaining experimental observations made by means of polarized-light cryomacroscopy (Part I). Thermal modeling is based on finite elements analysis (FEA), where two model parameters are extracted from thermal measurements: (i) the overall heat transfer coefficient between the cuvette and the cooling chamber, and (ii) the effective thermal conductivity within the cryoprotective agent (CPA) at the upper part of the cryogenic temperature range. The effective thermal conductivity takes into account enhanced heat transfer due to convection currents within the CPA, creating the so-called Bénard cells. Comparison of experimental results with simulation data indicates that the uncertainty in simulations due to the propagation of uncertainty in measured physical properties exceeds the uncertainty in experimental measurements, which validates the modeling approach. It is shown in this study that while a cavity may form in the upper-center portion of the vitrified CPA, it has very little effect on estimating the temperature distribution within the domain. This cavity is driven by thermal contraction of the CPA, with the upper-center of the domain transitioning to glass last. Finally, it is demonstrated in this study that additional stresses may develop within the glass transition temperature range due to nonlinear behavior of the thermal expansion coefficient. This effect is reported here for the first time in the context of cryobiology, using the capabilities of polarized-light cryomacroscopy.
Keywords: Cryomacroscopy, Vitrification, Glass Transition, Polarized Light, Photoelasticity, Mechanical Stress, Structural Damage, Crystallization, Finite Element Analysis, Heat Transfer
Introduction
Cryomacroscopy has been demonstrated as an effective means to observe physical events affecting cryopreservation success in large-size specimens [9]. In Part I of this study, polarized light capabilities have been demonstrated in two modes: (i) as a means to detect physical effects such as contamination in the CPA solution, crystallization, fracture formation, thermal contraction, and solute precipitation; and (ii) as a tool to study thermo-mechanical stress by means of photoelasticity. Analyses of those effects rely on the ability to reconstruct the thermal history in the domain, which is the focus the current Part II of this study.
Thermal analysis relies on the knowledge of physical properties within the domain (i.e., CPA-cuvette system), and boundary conditions of the system within the cryogenic chamber environment. The observed convection currents within the CPA at higher cryogenic temperatures, as indicated by circulation of contaminants (Fig. 3(a) of Part I of this study [9]), call for a special heat transfer analysis in this temperature range. Furthermore, the rate of heat transfer between the cuvette and its cryogenic environment cannot be predicted a priori and must be analyzed from specific experimental data. Part II of this study aims at developing thermal analysis tools to explain observed phenomena, while paying a special attention to (i) convection effects between the cuvette and its environment, and (ii) heat convection within the CPA at higher cryogenic temperatures. This study further uses thermal analysis results to explain observed solid mechanics effects.
Mathematical Formulation
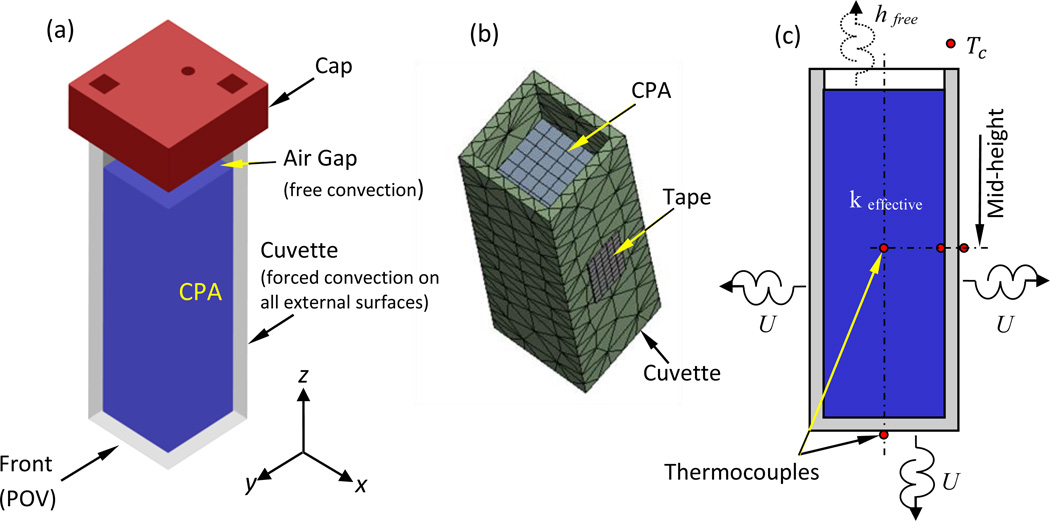
Figure 1 displays the cuvette-CPA system, the computer-simulated model, and a graphical depiction of the cuvette, where boundary conditions are also illustrated. Heat transfer within the CPA domain and the cuvette walls is assumed to prevail by conduction:
| (1) |
where ρ is the density, Cp is the specific heat, T is temperature, t is time, and k is the thermal conductivity. An effective thermal conductivity at the upper part of the cryogenic temperature range is assumed within the CPA, to account for the contribution of convection currents observed in Part I of this study. The parametric estimation of the effective thermal conductivity is described below.
Figure 1.
Schematic illustration of: (a) the sample assembly including the cuvette, CPA, and cap; (b) ANSYS mesh rendering for the CPA, cuvette, and adhesive tape; and (c) thermocouple layout used for the purpose of parametric estimation, where the wall-mounted thermocouples are placed with a tape, and the thermocouples placed inside the CPA are held with a special holder in the cap. The free stream temperature is recorded by the thermocouple represented by Tc. The cuvette internal dimensions are 10 × 10 × 45 mm3, its wall thickness is 1.25 mm, and it is filled with 3.5 ml of CPA such that the average air gap height is 9 mm on average (considering the CPA-air interface curvature).
Continuity in temperature and heat flux is assumed at the internal boundaries between the CPA and the cuvette. The boundary condition between the cuvette and the environment is represented by means of an overall heat transfer coefficient, U, combining convective and radiative effects:
| (2) |
where kw is the thermal conductivity in the cuvette wall, n̂ is the normal to the wall’s outer surface and the derivative is calculated within the wall, the subscripts s and c denote the outer wall surface and the cooling chamber, respectively.
Note that heat conduction from the base of the cuvette to the experimentation stage is neglected, since the cuvette is supported at the base only at its bottom corners, as illustrated in Fig. 2(a) of Part I [9]. The overall contact area with the cuvette base is less than 10% of the area of the cuvette bottom surface and less than 0.7% of the overall cuvette outer surface. Furthermore, the cuvette base is a 3D-printed structure, made of Acrylonitrile Butadiene Styrene (ABS) [9], which is considered a thermal insulator . With this particular thermal design of the cuvette holder, heat transfer by forced convection is assumed from the remaining 90% of the cuvette bottom surface [9]. Finally, due to the 3D-printed cap of the cuvette [9], only free convection is assumed at the CPA-cooling chamber interface (upper surface).
Figure 2.
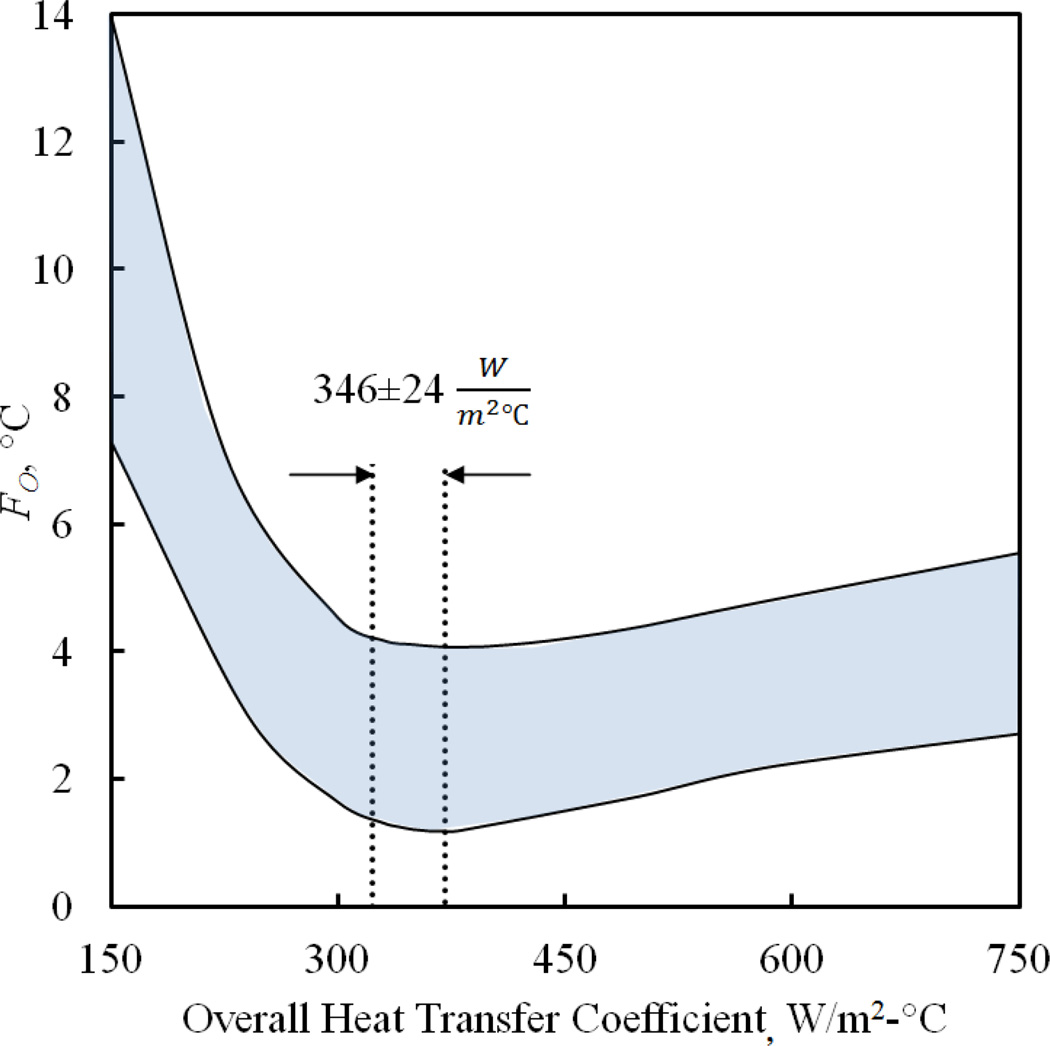
Parametric estimation results for the overall heat transfer coefficient, U, where F is the objective function for minimization, Eq. (4). The upper and lower boundaries for FO represent the worst and the best parametric estimation results, respectively, while the highlighted range between them represents a total of 10 experiments. Consistently, the overall heat transfer coefficient range corresponds to the best-fit results obtained in the above experiments.
Materials and Methods
The thermal analysis is focused on 7.05M DMSO, which has been demonstrated as an adequate reference solution for thermal and thermo-mechanical analyses of vitrification in large samples [23]. Table 1 lists the thermophysical properties for the various materials analyzed in this study. While most of the properties are readily available in the literature, special attention is paid to the specific heat in the amorphous state, the overall heat transfer coefficient, and the thermal conductivity within the CPA at higher cryogenic temperatures, all of which are parametrically estimated as described below.
Table 1.
Material properties used for thermal analysis in the current study (temperature is in °C).
| Material | Property | Value | |
|---|---|---|---|
| 7.05M DMSO | Density, kg/m3 | ρ = 1058 − 0.41 T [16] | |
| Specific Heat, J/kg °C | Eq. (3) [*] | ||
| Thermal Conductivity, W/m °C | k = 0.899 + 1.01×10⁻² T [*] | −60°C < T < 25°C @ 50°C/min | |
| k = 0.694 + 6.65×10⁻³ T [*] | −60°C < T < 25°C @ 20°C/min | ||
| k = 0.609 + 5.24×10⁻³ T [*] | −60°C < T < 25°C @ 10°C/min | ||
| k = 0.546 + 4.18×10⁻³ T [*] | −60°C < T < 25°C @ 5°C/min | ||
| k = 0.332 + 6.12×10⁻⁴ T [5] | −60°C < T < 25°C, Intrinsic | ||
| k = 0.312 + 2.54×10⁻⁴ T [3] | −170°C < T < 60°C, Intrinsic | ||
|
| |||
| Polystyrene Cuvette | Density, kg/m3 | ρ = 1055 − 0.26 T [22] | |
| Specific Heat, J/kg °C | Cp = 1121 + 3.94 T [11] | ||
| Thermal Conductivity, W/m °C | k = 0.14 + 1.3×10⁻⁴ T [34] | ||
|
| |||
| Quartz Cuvette | Density, kg/m3 | ρ = 2655 − 0.75 T [18] | |
| Specific Heat, J/kg °C | Cp = 692.89 + 1.852 T − 0.0031 T2 + 4.902×10⁻⁶ T3 [19] | ||
| Thermal Conductivity, W/m °C | k = 6.57 + 0.016 T [28] | ||
|
| |||
| Polyethylene Tape | Density, kg/m3 | ρ = 931 − 0.49 T − 0.00091 T2 [14] | |
| Specific Heat, J/kg °C | Cp = 1031 + 3.57 T − 0.014 T2 − 6.17×10⁻⁵ T3 [10] | ||
| Thermal Conductivity, W/m °C | k = 0.39 + 5.2×10⁻⁴ T [29] | ||
Parametric estimation in the current study
Specific Heat
In the absence of more detailed information, the specific heat capacity of DMSO during vitrification was compiled from the literature using the Einstein model for internal energy storage [4]:
| (3) |
where the value 3 represents the number of degrees of freedom in a simple harmonic oscillator, N is the number of oscillators, κb is the Boltzmann constant (1.38064852×10⁻²³ J/K), Mu is the molecular weight (specified in kg/mol in order for the specific heat to be presented in SI units), T is the absolute temperature, θE is the Einstein temperature, ℏ is the reduced Planck’s constant (1.0545718×10⁻³⁴ J s), and ω is the frequency of oscillation of the molecule (6.415×10¹³ Hz). The frequency of oscillation was calculated by substituting the Einstein temperature derived from least-square estimation in Eq. (3). The Einstein model assumes each molecule to be an independent harmonic oscillator that only interacts with its nearest neighbors. In broad terms, the Einstein model does not fully capture the long-range behavior of ordered materials (i.e., having a crystalline configuration); nonetheless, it has shown to provide a good approximation for disordered materials (i.e., in the amorphous state) [2].
Temperature-dependent specific heat of varying concentrations of aqueous DMSO solutions above the solidification temperature has been reported by Westh [33]. Since glasses resemble liquids at the atomic scale (i.e., the lack of long-range order), and since the Einstein model is known to be an acceptable approximation of the heat capacity in amorphous materials, the Einstein model was best-fitted to Westh’s experimental data in the current study. By best-fitting with a least-square approximation method, the Einstein temperature, which is the only material-dependent property in the Einstein model, was found to be 494±1 K for 6.5M DMSO. Here, 6.5M in the temperature range of −30°C to 20°C is the closest concentration for which specific heat data is available [33] with reference to the experimented 7.05M DMSO. Note that the specific heat is expected to be a weak function of the concentration in the amorphous state, within the 8% concentration difference between 6.5M and 7.05M DMSO.
The Einstein model was further used to extrapolate specific heat values at lower temperatures, while neglecting the entropic effects of a second-order phase transition during vitrification [12,32]. Note that the specific heat of a liquid is expected to be between 10% (a strong material) to 80% (a fragile material) higher than that that of glass across the glass transition temperature range [1]. For 7.05M DMSO for example, 18% decrease in specific heat upon glass transition could be expected [20]. The Appendix to the current manuscript suggests that an uncertainty of 10% in the specific heat of 7.05M DMSO yields an uncertainty in temperature simulations of nearly 2°C. However, the above literature data should not be confused with the uncertainty analysis presented in the Appendix of the current manuscript, with the cited literature referring to changes in specific heat upon glass transition only, while the Appendix analysis refers to uncertainty all across the temperature range of interest. Furthermore, the current study neglects specific heat changes upon glass transition, which is expected to have little influence on the simulation results in this study since those are carried down to only a few degrees below glass transition, while the majority of the heat transfer process under investigation is in the liquid phase. On average, the best-fitted Einstein model deviates from the experimental data [33] by less than 1% within the available literature data temperature range.
Overall Heat Transfer Coefficient
The overall heat transfer coefficient, U, is conveniently defined as an average quantity around the cuvette surface, combining radiative and convective heat transfer effects. Due to the highly convective environment within the cooling chamber (an average velocity of 25±5 m/s was measured with a hot-wire anemometer) and the specific cryogenic-stage setup, the heat transfer coefficient by convection cannot be estimated a priori to an acceptable level of certainty. Instead, an experimental approach is taken where U is parametrically estimated by fitting heat transfer simulation results with experimental data. First, experimental temperature data are obtained for a specific protocol by five temperature sensors (thermocouples) at the points illustrated in Fig. 1(c). Next, a computer simulation of the CPA-cuvette system is executed using the properties listed in Table 1, the measured chamber thermal history (Tc in Fig. 1(c)), and an initially assumed U value (see uncertainty analysis in Appendix A for simulated results and measured data). An overall agreement quality parameter between experimental results and simulated data, FO, is calculated as follows:
| (4) |
where Fi is the agreement quality parameter at location i (equals 1 at the center of the CPA, 2 on the wall’s inner surface, and 3 on the wall’s outer surface), Tm,i is the measured data at location i, Ts,i is the simulated temperature at the same location, p is the time index of the measurement, and n is the total number of sampling instances (taken at 1 Hz throughout experimentation). Finally, the best-fit U value is searched by minimizing F. Note that the sensor at the bottom surface of the cuvette is used for interpretation of experimental results, but is not considered in the analysis in the context of Eq. (4). It is further noted that temperature differences of the order of 15°C were observed between the two outer surface sensors, which may help explaining axial effects occurring along the cuvette.
Finally, due to the design of the 3D-printed cuvette cap, only heat transfer by free convection prevails at the CPA-air interface, where its actual rate can be neglected as demonstrated below.
Thermal Conductivity of the CPA
Convection currents have been observed within the CPA at a temperature range of −60°C to room temperature, as indicated by circulation of contaminants (Fig. 3(a) of Part I [9]). This flow is essentially driven by free convection effects within the CPA, in a pattern known as the Bénard cell [13]. Due to the exponential increase of viscosity with the decreasing temperature [21], this effect has been observed to vanish at −60±5°C for 7.05M DMSO.
Figure 3.
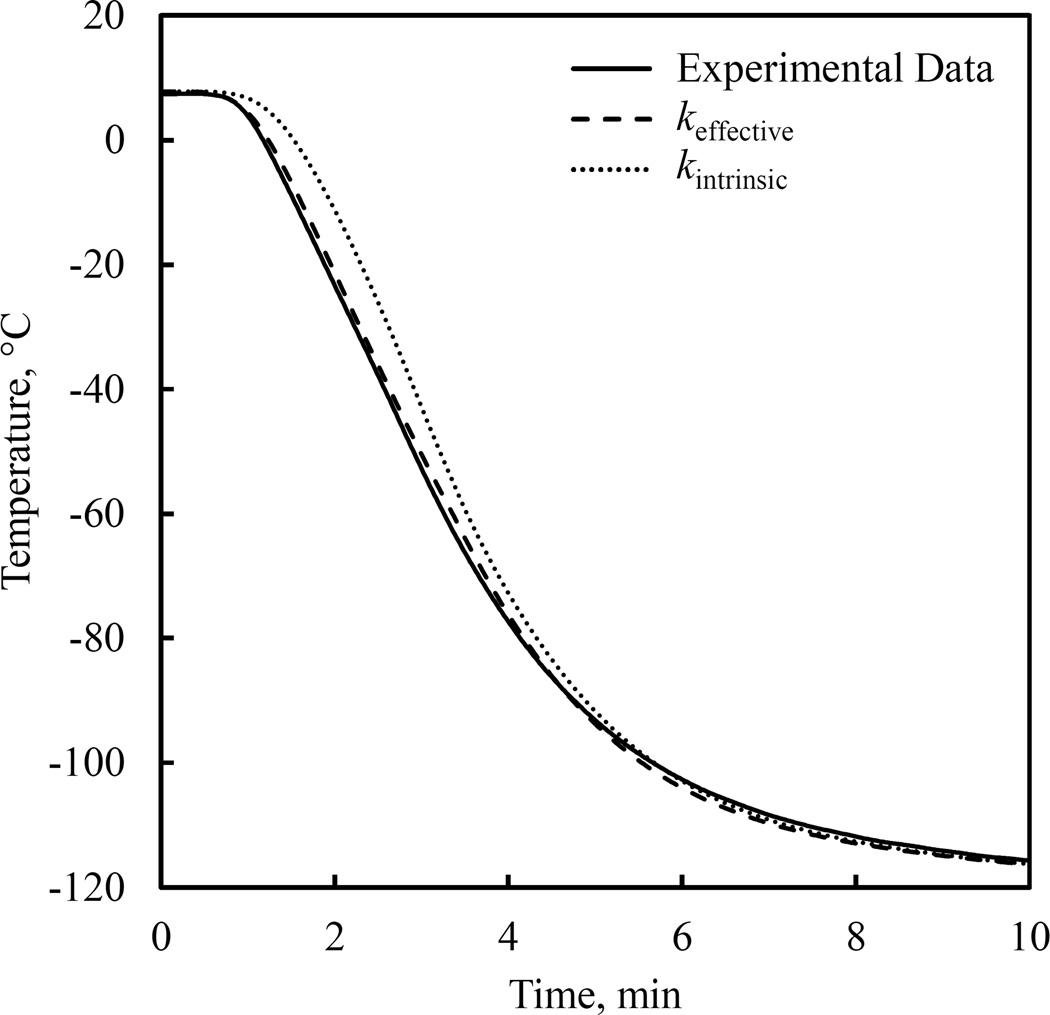
Representative results for the temperature at the center of the domain for a constant cooling rate of 50°C/min.
While the thermal analysis in the current study is based on heat conduction within the CPA, an effective thermal conductivity is assumed in order to capture this free convection effect in the temperature range of interest. The effective thermal conductivity is found by a least-square approximation method, following a similar procedure to the one described above for U and Eq. (4). For the case of pure conduction, thermal conductivity of 7.05M DMSO has been recently observed to be linearly dependent on temperature [3]. Hence, the best-fitted effective thermal conductivity is also assumed to be linearly dependent on temperature, but at a higher rate. This rate—the derivative of thermal conductivity with respect to temperature—is further assumed to be cooling-rate dependent, where free convection is expected to be intensified by the increased temperature gradients as the cooling rate increases.
Since the overall heat transfer coefficient U is considered a first-order effect, while the effective thermal conductivity within the CPA is only a second-order effect, parametric estimation of those two parameters has been performed sequentially in the order of significance.
Experimental Protocol
The protocol for preparing the sample and the scanning cryomacroscope for experimentation is overviewed in Part I of this study [9] and presented in detail previously [8]. The following additional measures have been included in this protocol in the current study. As illustrated in Fig. 1(b), T-type thermocouples (36 gage wires) were attached to the cuvette wall by a 5 mm × 5 mm strip of polyethylene tape, having a thickness of 0.15 mm. These thermocouples were placed at the geometric center of the outer surface of one of the cuvette walls, on the inner surface of the same wall across from the first sensor, and at the center of the base of the cuvette on the outer surface. In addition, one thermocouple was placed at the geometric center of the cuvette (immersed in the CPA) by means of a special holder, 3D-printed onto the cuvette cap (ABS material). Finally, a thermocouple was placed within the free stream within the cooling chamber, adjacent to the wall’s outer surface thermocouple. Contact resistance between thermocouples and the solid surface to which they were attached were neglected in the current thermal analysis.
Note that the ABS material exhibits thermal diffusivity and thermal expansion characteristics in close range to that of CPA, as would be the general case for polymeric materials [26]. Hence, the 3D printed ABS did not show propensity to cause factures in the reported experiments. Further note, that due to the small diameter of the thermocouple holder, the extension of the thermocouple from the holder (about 3 mm), and availability of specific thermal diffusivity data of ABS at cryogenic temperatures, geometric modeling of the thermocouple holder during simulations is deemed unwarranted. Variable thermal protocols within the cooling-rate range of 5°C/min to 50°C/min and a rewarming rate of 10°C/min were tested, as specified in the Results and Discussion sections. Temperature data were obtained at a constant rate of 1 Hz throughout the experiments, while digital movies of the experiments were routinely recorded by the cryomacroscope camera.
Computer Simulations
The thermal process was simulated using the finite elements software ANSYS 14 using the thermal properties listed in Table 1 and the measured temperature data described above. Figure 1(b) displays the ANSYS mesh rendering for the CPA, cuvette, and adhesive tape. Tetrahedral (SOLID87) elements were used to model the cuvette, while hexahedral (SOLID90) elements were used to model the CPA and the tape, totaling approximately 2500 elements. A solution convergence study was performed and it was found that further refining the finite elements mesh affects the simulation results by less than the uncertainty in temperature measurements. Simulations were executed on an Intel Core i7 960 machine, having 8GB RAM, with a typical run time of about 15 minutes.
Results and Discussion
Results were obtained in the cooling rate range of 5°C/min and 50°C/min, where the upper boundary was dictated by the cooling chamber capabilities, while the lower boundary was chosen to ensure vitrification of 7.05M DMSO, as was verified by visualization means.
Parametric Estimation
Figure 2 displays least-square estimation results for the overall heat transfer coefficient, U. It is noted that a temperature difference in the range of 5°C and 15°C was measured between the outer surface of the cuvette and the inner wall of the cooling chamber during various experiments. This means that, if calculated separately, the radiative heat transfer coefficient [13] is two orders of magnitude smaller than the convective heat transfer coefficient, implying that heat transfer within the cooling chamber is primarily by convection (this would also be a plausible thermal design objective for the cooling chamber). Further note that the heat transfer coefficient by free convection in air is typically about two orders of magnitude smaller than the estimated overall heat transfer value of 346 W/m2-°C. This means that a more detailed analysis of the boundary condition at the CPA-interface would not significantly affect the simulation results.
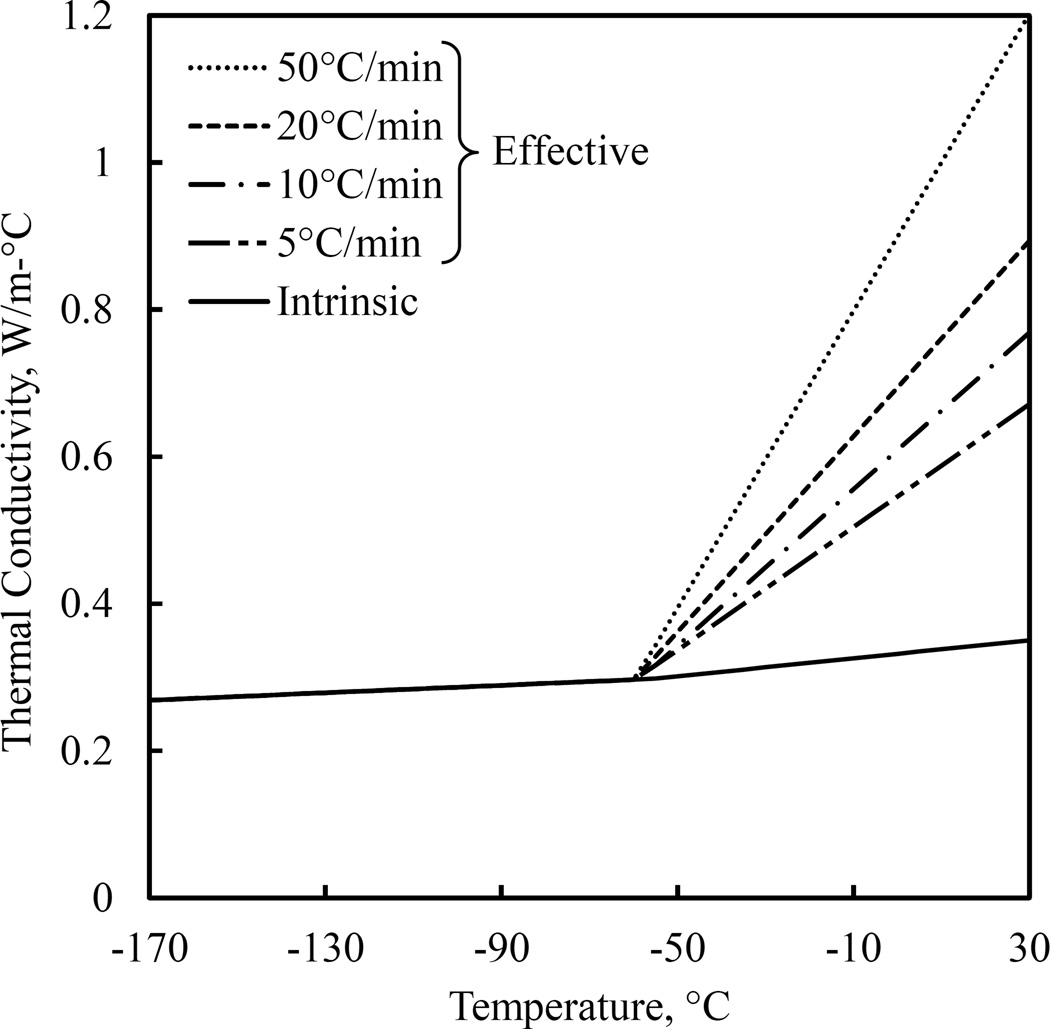
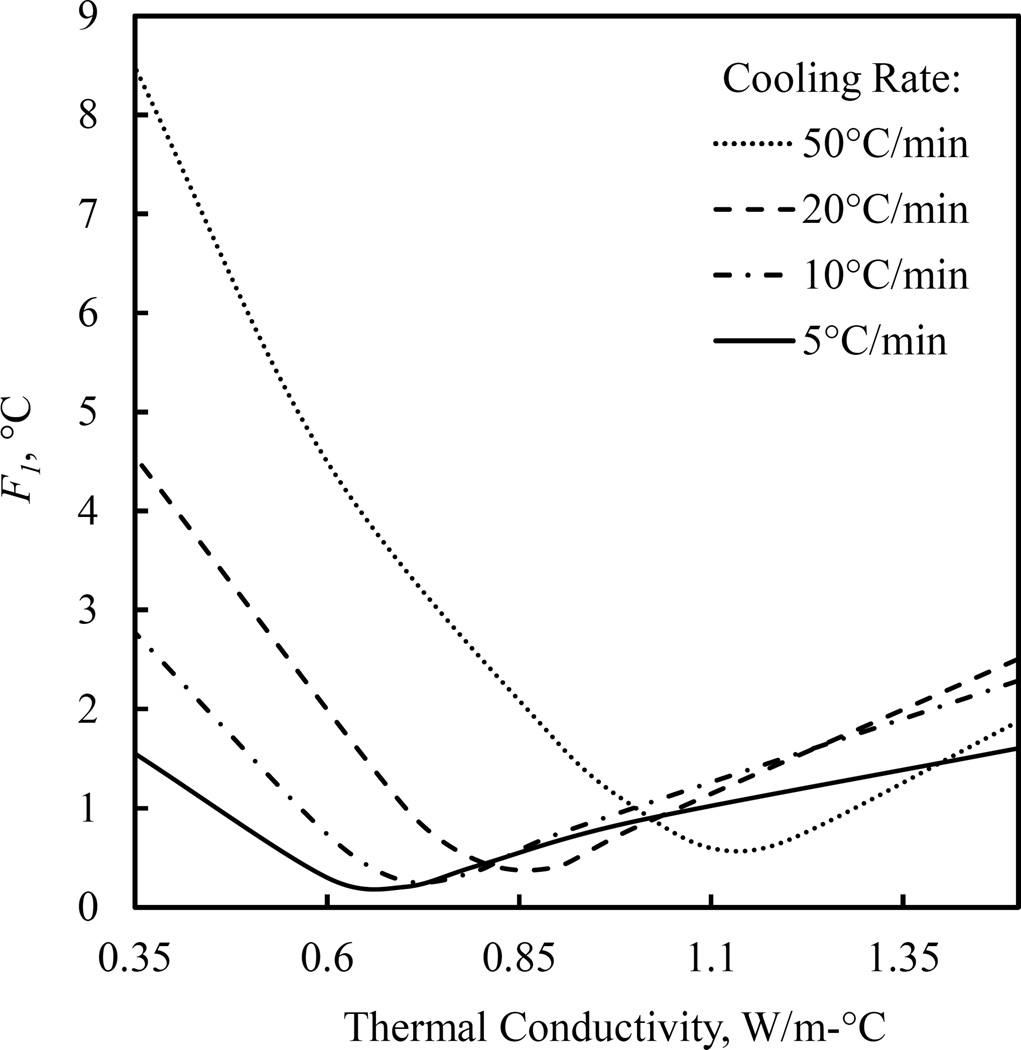
Figure 3 displays the thermal history results for parametric estimation of the thermal conductivity for a constant cooling rate of 50°C/min, which represents the worst-case scenario since it corresponds to the maximum deviation of the effective thermal conductivity from its intrinsic value. While the effective thermal conductivity within the CPA is a global property, results displayed in Fig. 3 demonstrated its effectiveness in capturing the increased heat transfer rate at the center of the domain—a local effect. As can be seen from Fig. 4, the effective CPA thermal conductivity for the simulated case represented in Fig. 3 is three fold higher than the intrinsic property at 0°C for the case of 50°C/min cooling rate. It can further be seen from Fig. 4 that even for a cooling rate of 5°C/min, the effective thermal conductivity is 64% higher than the intrinsic thermal conductivity at 0°C. These observations imply that the effect of convection currents cannot be neglected even at low cooling rates.
Figure 4.
Parametrically estimated thermal conductivity in the current study. The dashed lines represent the effective thermal conductivity as a result of the formation of Bénard cells.
In general, it can be seen from Figs. 4 that the effective thermal conductivity increases with the increased cooling rate, which is consistent with the expectation of increased natural convection effects with the increasing temperature gradients within the CPA. Overall, the effective thermal conductivity leads to an average temperature mismatch between experiments and simulations at the center of the domain to be less than 0.5°C for all experimented thermal histories, as evident from Fig. 5. Note that Fig. 5 displays only the temperature mismatch at the center of the domain only, F1, as the convective currents primarily affect the temperature distribution within the CPA. This mismatch is comparable with the uncertainty in temperature measurements using thermocouples and is smaller than the uncertainty in simulation results (Appendix A), which suggest that the chosen effective thermal conductivity model provides an adequate approximation for heat transfer simulation purposes. Note that the end result for each simulation is history-dependent, which signifies the quality of the above match. A second attempt to repeat parametric estimation for U, this time integrating the recently estimated values for the effective thermal conductivity, yielded no significant change in U, verifying that the effective thermal conductivity is indeed a second-order effect to U.
Figure 5.
Graphical illustration of parametric estimation results for the effective thermal conductivity at 25°C, where the intrinsic value of the thermal conductivity is 0.347 W/m-°C and the thermal conductivity through the entire range of interest is displayed in Fig. 4. F1, represents the mismatch between measured and simulated data at the center of the CPA domain (see Fig. 1 and Eq. (4)).
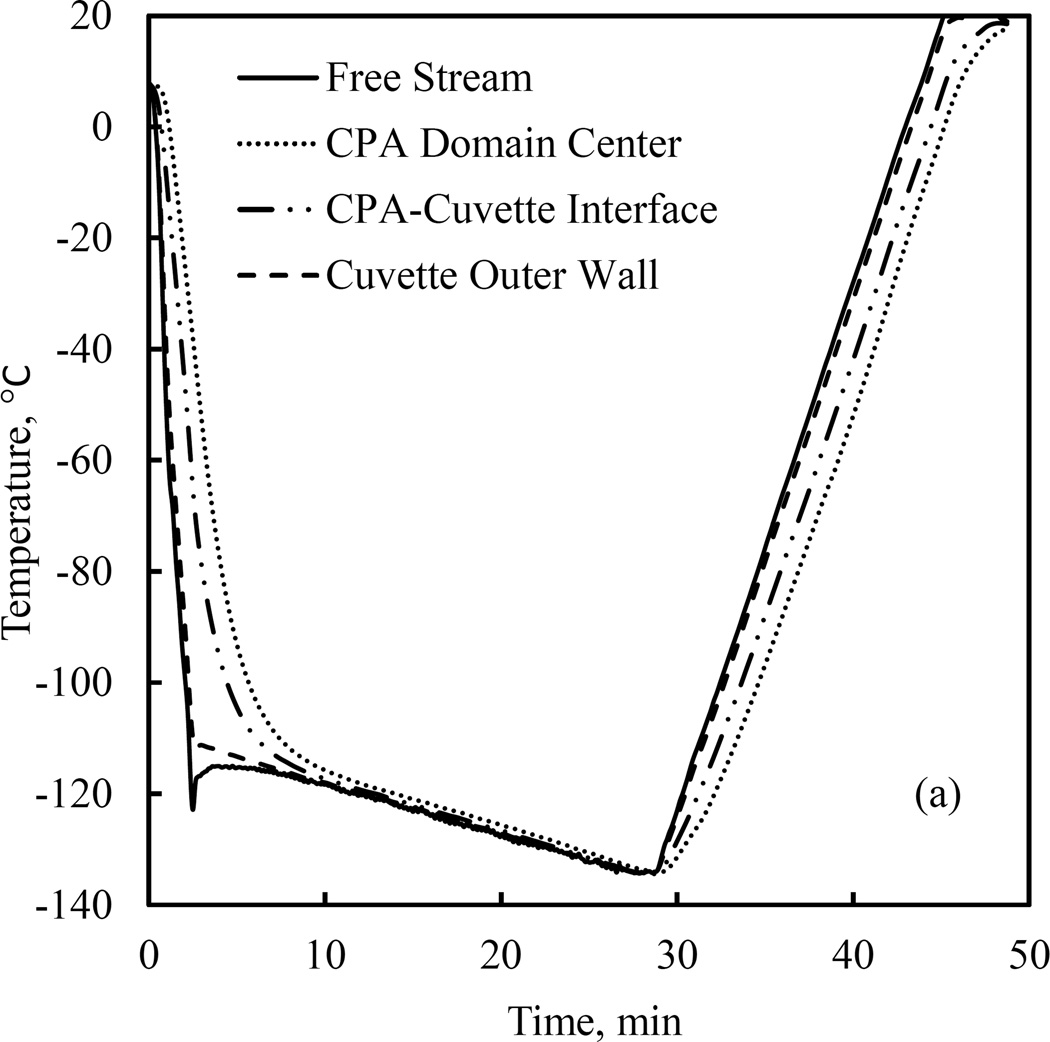
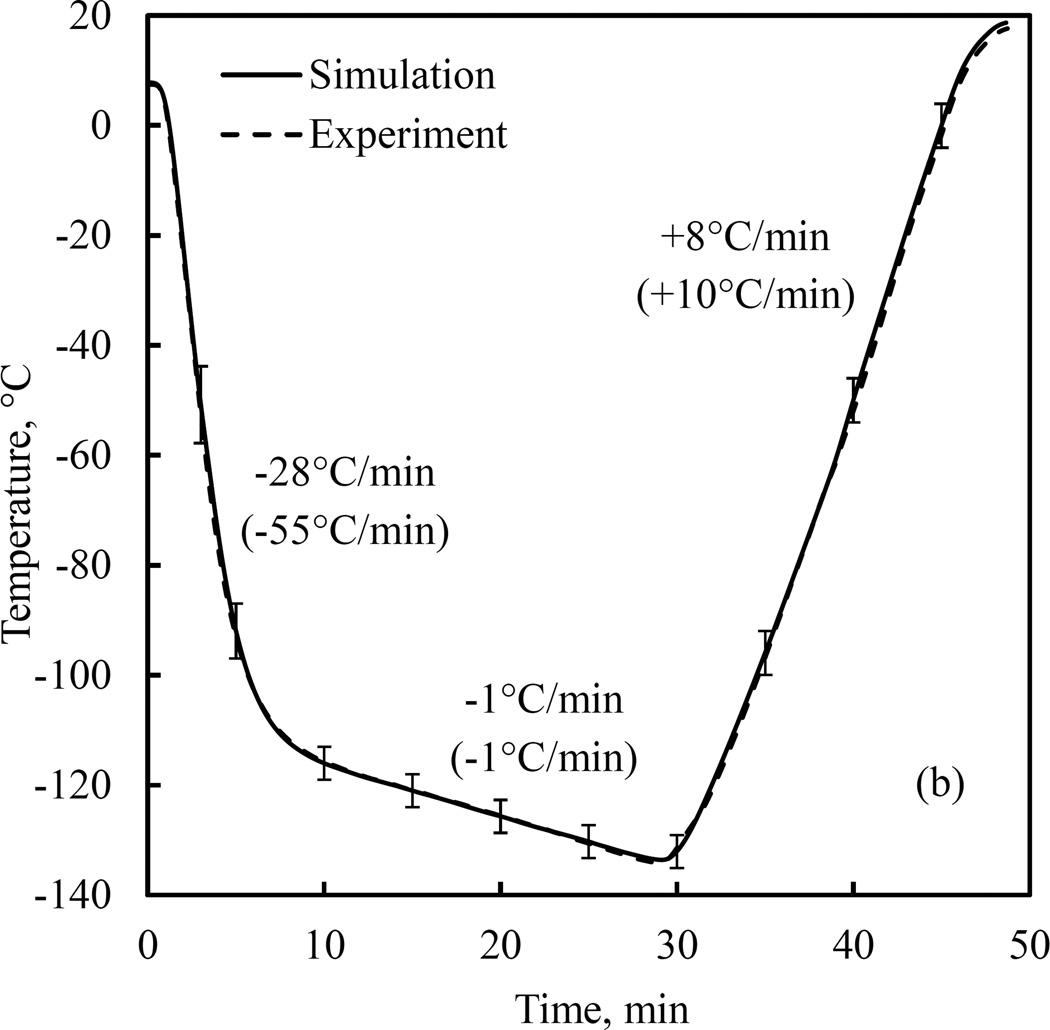
Figure 6 displays a representative comparison of simulation results with experimental data using the parametric-estimated values. The thermal history of the cooling chamber in this case consists of an initial cooling rate of 55°C/min down to −110°C, followed by a slow cooling rate of 1°C/min down to −130°C, and quick rewarming to room temperature at a rate of 10°C/min. Figure 6(a) displays the measured data while Fig. 6(b) displays the comparison of results at the center of the CPA, which is also the point associated with the highest level of uncertainty in simulations due to propagation of uncertainty in thermal properties [24]. Analysis of uncertainty in simulated results is described in the Appendix A, where its estimated average value is ±2.94°C or 1.96% of the overall temperature range during experimentation (Table A.1).
Figure 6.
Comparison of computer simulation results with experimental data: (a) experimental data at the sensor locations displayed in Fig. 1(c), and (b) comparison of measured data and simulation results at the center of the CPA domain. Values in parentheses relate to the cooling chamber, while the nominal rates correspond to the cooling rate at the point of measurement at the center of the domain. The error bars refer to the estimated uncertainty in simulation results, as discussed in the Appendix.
Also shown in Fig. 6(b) are the corresponding rates at the point of measurement (center of the domain), which deviate from the imposed cooling chamber cooling rates, as dictated by the principles of heat transfer within the domain. Such a variation in cooling rate across the specimen may intensify thermo-mechanical stress due to differential thermal expansion [7]. As cryobiologists attempt to increase the size of cryopreserved specimen, special attention must be paid to satisfying the critical cooling and rewarming rates needed for successful vitrification, while reducing differential thermal expansion effects, which may lead to structural damage.
Effects of Cavity Formation on the Stress Field
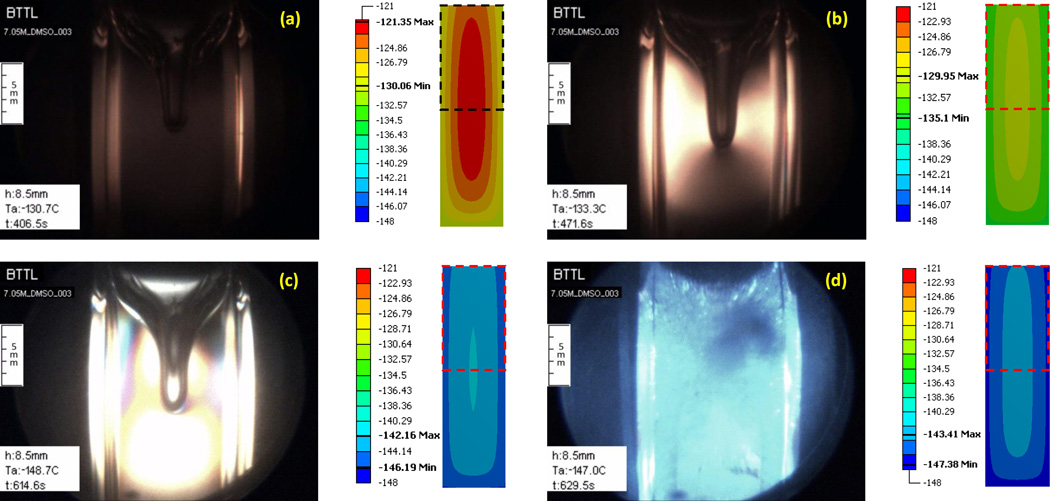
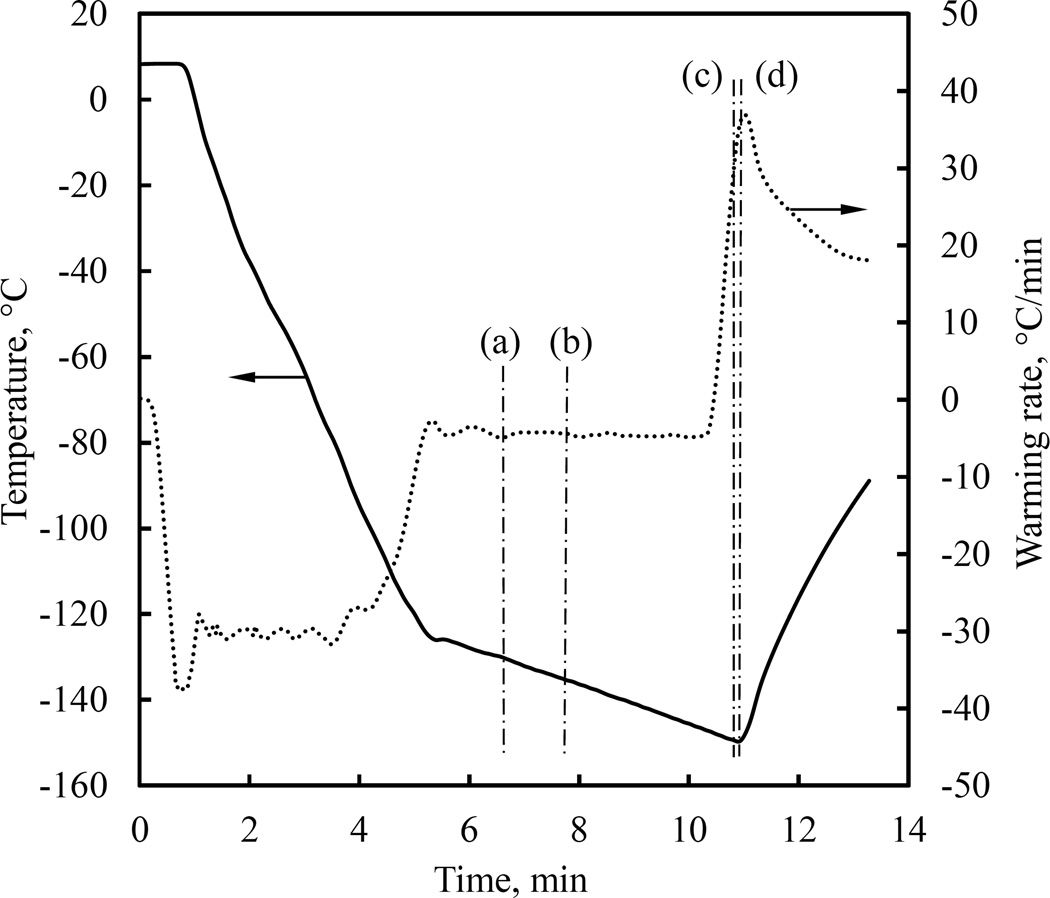
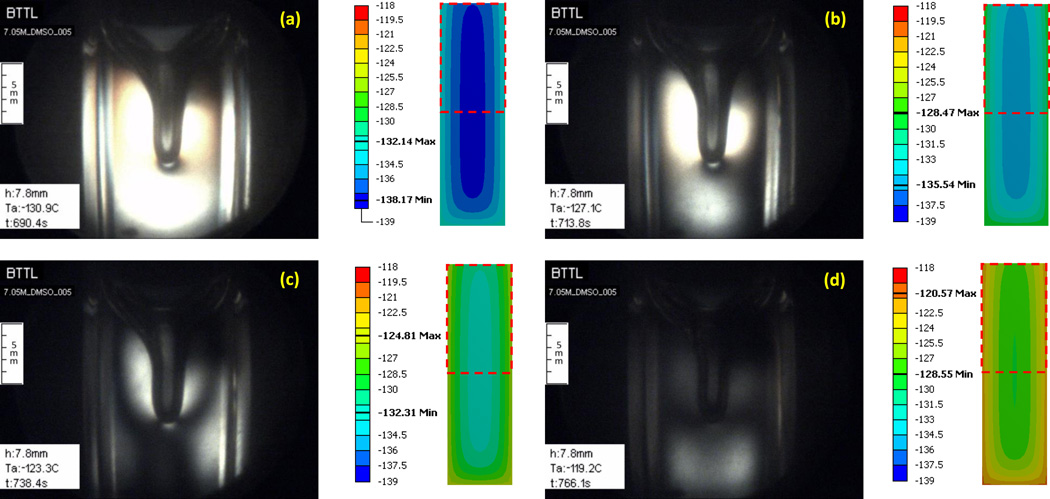
Figure 7 displays four representative images taken along the thermal protocol presented in Fig. 8. Three controlled parameters are also displayed in Fig. 7: h is the vertical scanning distance measured from a reference point set by the operator, Ta is the current cooling chamber temperature, and t is the elapsed time from the beginning of the protocol. The simulated thermal field in a cross section through the center of the sample is presented to the right of each image to help interpret results, where a dashed-squared contour on the temperature map illustrates the corresponding frame of view by the cryomacroscope.
Figure 7.
Experimental results demonstrating the formation of a large cavity in 7.05M DMSO and polarized light effects for the thermal protocol displayed in Fig. 8. Simulation results for the temperature field at corresponding point in time are displayed to the right of each image, where the dashed-squared contour represents the frame of view by the cryomacroscope, the temperature scale is presented in Celsius degrees, and the maximum (Max) and minimum (Min) temperature observed in the field of view are highlighted in the scale. Events: (a) stress starts to form near walls where the material approaches the glass transition; (b) stress is evident across the domain with the higher intensity between the wall and cavity; (c) a display of more than one polarized light spectrum, while brightness increases to the point of saturation of the CCD sensors at the center of the image; (d) intense fracturing in the domain visualized with visible light.
Figure 8.
Thermal history in the cooling chamber (Tc in Fig. 1(c)) for the experimental results displayed in Fig. 7.
The thermal simulation results are presented for a simplified system, where the observed cavity extending from the surface of the domain downwards is ignored. This simplification originates from the difficulty in simulating such huge material deformations, which would otherwise necessitate special thermo-mechanical stress analysis tools; these tools are being developed in a parallel study. Nonetheless, it can be seen that the cavity forms along the upper portion of the centerline of the domain, where the expected temperature gradients are the lowest (zero at the center by definition), and thus the simplified system is deemed beneficial for the purpose of the current discussion. However, a coupled thermo-mechanical stress analysis cannot neglect the same cavity, which may contribute to stress concentration, potentially leading to extreme values resulting in structural damage.
Note that the CPA-center sensor used for parametric estimation, Fig. 1(c), has been placed well below the tip of the cavity (at a depth of about twice the length of the cavity), and hence the presence of the cavity is not expected to affect the above parametric-estimation results (recall that the lowest temperature gradients are around that sensor).
It can be seen from Fig. 7(a) that the stress starts to develop first at the walls, in this inward cooling process, where the viscosity rapidly increases as the material approach its glass transition temperature, which is in the range of −130°C and −132°C [23,27] for 7.05M DMSO. Recall that polarized light can visualize mechanical strain, which in general is proportional to the mechanical stress, and which facilitates a qualitative discussion about the resulting stress. The temperature at which stress was first observed did not appear to vary with the changing cryoprotocol and the resulting cavity formation, which is due to thermal expansion [8]. As summarized in a recent study [5], two effects contribute significantly to stress development: (i) thermal expansion mismatch between the CPA and the cuvette and (ii) thermal gradients within the CPA. The stress due to thermal expansion mismatch is essentially temperature-dependent, while the stress due to temperature gradients is primarily cooling-rate dependent. Since the stress initially appears at the same temperature regardless of cooling protocol, it is likely that thermal expansion mismatch plays a more significant role in the cases under investigation.
Figure 7(b) is related to the point in time at which the center of the domain reaches the glass-transition temperature, after which the entire domain essentially behaves as a solid. While the pattern of observed stress remained consistent among experiments from variable cooling rates, the intensity of observed stress had increased with the cooling rate, and so had the depth of the cavity. These observations imply that faster cooling rates result in greater stresses due to either the effect of the cavity on stress concentration, the steeper temperature gradients resulting in higher thermo-mechanical stresses, or a combination of the above.
Figure 7(c) displays a repeated strain-spectrum pattern, when the sample temperature is well below glass transition. Unfortunately, the strain changes dramatically upon glass transition, and the challenging illumination conditions enable either focusing on lower strains above glass transition, or higher strains in the solid state. The high brightness at the center of the sample is an indication of saturation of the CCD sensors of the camera. A self-adjusting illumination mechanism could solve the problem in future studies. However, polarized light is not only about intensity but also about the color spectrum, where higher strains cause a color shift towards blue; with a repeated spectra pattern as the strain intensifies [15]. With appropriate calibration, the strain level can be extracted from polarized light images, but the means for that in cryogenic temperatures remained to be developed.
Figure 7(d) displays fractures using non-polarized light, when the temperature at the center of the domain reaches about 10°C below the glass transition. Note that in order to achieve high-quality polarized-light images, a quartz cuvette was used. The frequency of fractures could be decreased by using the more common polymethyl methacrylate (PMMA) cuvettes, due to a better thermal expansion match between the PMMA and the CPA. Furthermore, PMMA is more compliant than quartz, making it less likely to fracture. Unfortunately, residual stresses from the PMMA cuvette fabrication could also be detected with polarized light, which make it a poor choice as a container material for a CPA-polarized light studies; residual stresses were not observed in the quartz cuvettes. While the quartz cuvette has resulted in more frequent fractures, this information is valuable for extracting the yield strain of the CPA by simulating the CPA-cuvette system, with well characterized quartz properties [26].
Glass Transition Temperature Range Effects
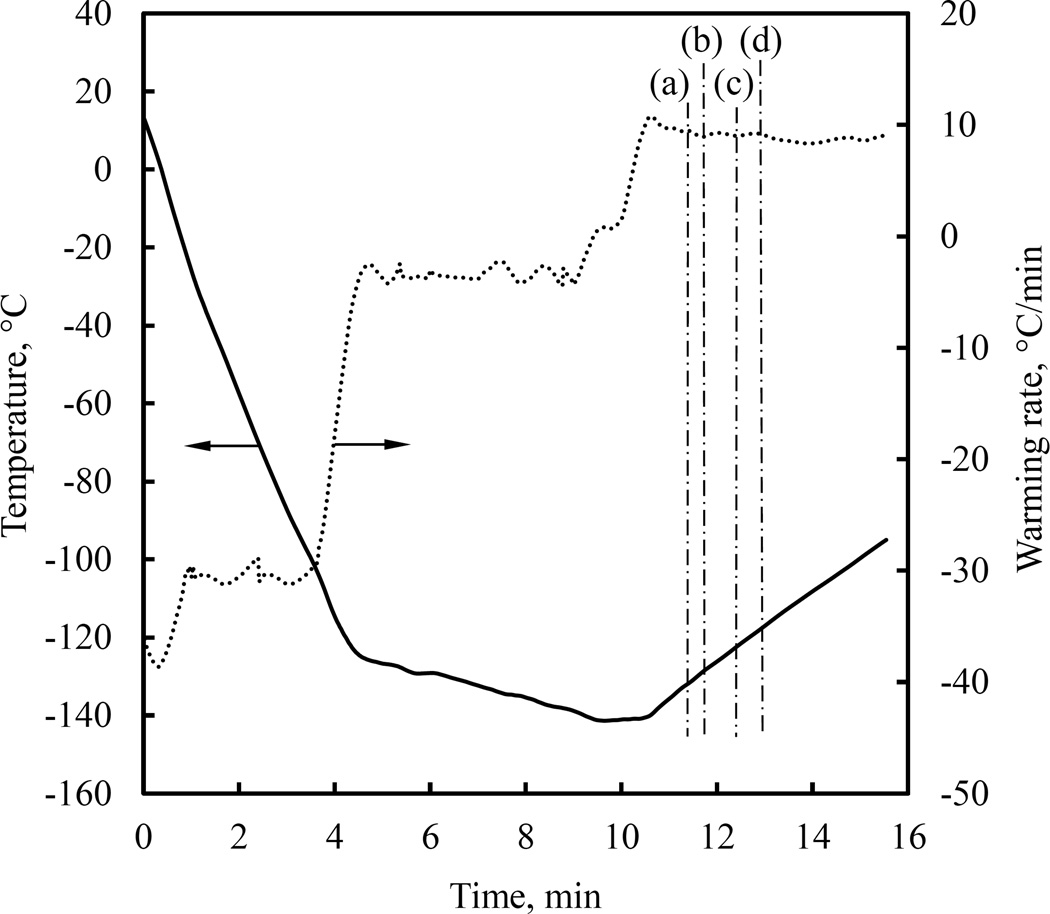
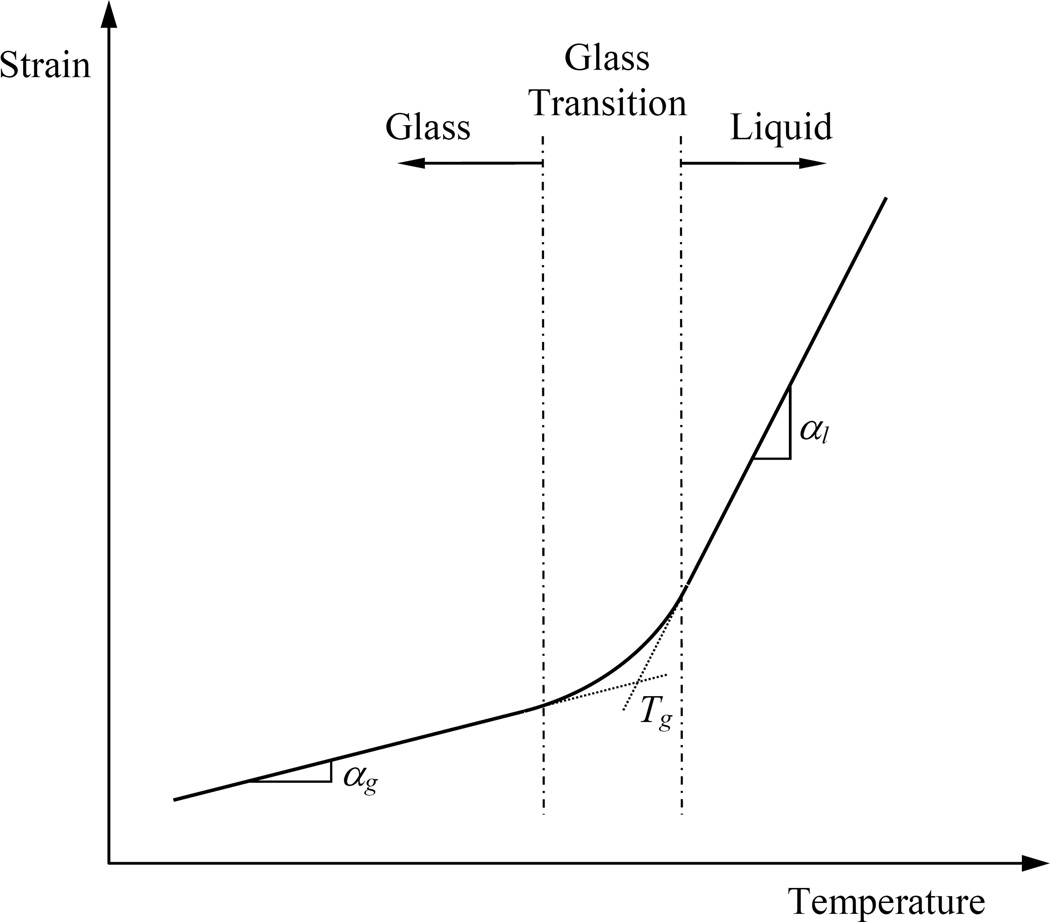
Figures 9 displays polarized-light images taken during the rewarming phase of the cryogenic protocol displayed in Fig. 10. Interpretation of the corresponding observations is associated with the thermal expansion history of the material along the cryoprotocol. A generic thermal expansion coefficient curve is schematically illustrated in Fig. 11 [16]. At high temperatures, the material molecules are free to move and rearrange to conform with the material’s tendency to contract with the decreasing temperature (thermal contraction is essentially thermal expansion with a negative sign). This effect results in a free-of-stress thermal straining typical to fluids, and the slope (i.e., the thermal expansion coefficient) is denoted αl in Fig. 11.
Figure 9.
Experimental results demonstrating stress relaxation in 7.05M DMSO during rewarming for the thermal protocol displayed in Fig. 10. Simulation results for the temperature field at corresponding point in time are displayed to the right of each image, where the dashed-squared contour represents the frame of view by the cryomacroscope, the temperature scale is presented in Celsius degrees, and the maximum (Max) and minimum (Min) temperature observed in the field of view are highlighted in the scale.
Figure 10.
Thermal history in the cooling chamber (Tc in Fig. 1(c)) for the experimental results displayed in Fig. 9.
Figure 11.
Typical thermal strain curve during constant-rate cooling in a free-of-stress glass forming process.
Once the material gets cold enough and its viscosity reaches extremely high values, the tendency of the material to contract with temperature is limited by the inability of its molecules to freely rearrange. This effect results in a macro-response of a reduced thermal expansion coefficient over any practical period of time, denoted αg in Fig. 11. It is the slope transition from αl to αg that serves as an alternative means to define the glass transition temperature range, where the asymptotic interception of αl and αg defines the glass transition temperature, Tg. This thermal strain behavior in glassy CPAs and tissues has been experimentally investigated [6,16,17,23].
Note that the upper temperature boundary below which the material starts to exhibit a solid-like mechanical behavior may even be higher than the upper boundary of the glass transition temperature range, which has be defined as the set-temperature in previous studies [30]. These are the thermal expansion coefficient changes within the glass transition temperature range associated with the ability of the material to sustain mechanical stress below the set-temperature, which are likely to be responsible for the effects observed in Fig. 9.
Figure 9(a) displays significant stresses at the beginning of rewarming, when the entire CPA domain is below the glass transition temperature. The stresses observed in Fig. 9(a) are associated with residual stresses developed at the end of cooling, when the vitrified material equilibrates at the storage temperature [5,30], stresses that would develop even if the material experienced free-of-stress cooling [25]. The inverted stress distribution at the onset of rewarming may intensify these stresses [5,26]. Contributing to the overall level of stress is the thermal expansion mismatch between the cuvette and the CPA in the glassy state [26,31].
While the thermal expansion mismatch decreases upon rewarming, and while some possible stress relaxation may start to take place as the material approaches the glass transition temperature, a new effect may locally elevate the level of mechanical stress—the increasing thermal expansion coefficient as the material passes again through the glass transition temperature range. Figure 9(b) displays the decreasing stress during rewarming as an overall decrease of image brightness. In Fig. 9(c) however, the CPA near the wall re-brightens which is the area to first pass the glass-transition temperature range upon rewarming. This re-brightening is associated with increased stress as a result of the above change in thermal expansion coefficient. As the process progresses, the brightness peak gradually moves toward the center of the cuvette, Fig. 9(d), while its intensity fades away, which is consistent with the movement of the glass transition temperature range towards the center of the domain. Eventually, the entire domain darkens when the material is warm enough to undergo significant stress relaxation.
Finally, a note about differences between cooling and rewarming around the glass transition temperature range. It has already been demonstrated that rewarming is not the inverse of cooling in terms of thermo-mechanical stress [5,25,31]. As has been observed experimentally and analyzed theoretically, thermo-mechanical stress may only intensify at the onset of rewarming, whether in a crystallization-based or vitrification-based processes. The core difference between cooling and rewarming is that the material can only transform into solid free of stresses at the solidification front. By contrast, there is no reason to assume that the solid material cannot sustain significant stresses just before returning to the liquid state, even at close vicinity to the melting front. Based on similar arguments, the non-uniform straining effect within the glass transition temperature range, observed in Fig. 9, is expected to be more significant during rewarming than during cooling.
Summary and Conclusions
The current study (Part II) focuses on the development of a thermal model to explain photoelasticity observations and glass transition effects associated with thermo-mechanical stress. Thermal modeling is based on FEA where two model parameters are best-fit approximated from experimental data: (i) the overall heat transfer coefficient between the cuvette and the cooling chamber, U, and (ii) the effective thermal conductivity within the CPA at the upper part of the cryogenic temperature range, keff. The effective thermal conductivity is designed to take into account convection currents within the CPA, following the pattern of the so-called Bénard cells.
Analysis of experimental results suggests a U value of 346 W m−2 °C−1 within a 7% range around the nominal value for the applicable cooling rates in the cooling chamber. Analysis of experimental results further indicate keff in a wide range of values, up to three folds of the intrinsic property at the maximum cooling rate achievable within the cooling chamber. It is concluded from the thermal analysis that U is a first-order effect on the parametric estimation process, while keff is only a secondary effect. Comparison of experimental results with simulation data indicates that the uncertainty in simulations due to propagation of uncertainty in measured physical properties exceeds the uncertainty in experimental measurements, which reaffirms the modeling approach.
It is shown in this study that while a cavity may form at the upper-center portion of the vitrified CPA, it has a very little effect on estimating the temperature distribution within the domain. This cavity is driven by thermal contraction within the CPA, with the upper-center of the domain transitioning last to glass. Slower cooling rates led to smaller cavities. However, using polarized light, it is demonstrated that the thermo-mechanical stress in the same region may reach very high values. As one would expect, the curvature along the cavity surface leads to strain concentration, and therefore stress concentration.
Finally, it is suggested that additional stress may develop within the glass transition temperature range due to the nonlinear nature of the thermal expansion coefficient. This effect is reported here for the first time in the context of cryobiology, using the capabilities of polarized-light cryomacroscopy.
Acknowledgments
This project has been supported in parts by award R21RR026210 from the National Center for Research Resources (NCRR), award R21GM103407 from the National Institute of General Medical Sciences (NIGMS), and award R01HL127618 from the National Heart Lung and Blood Institute (NHLBI). The content is solely the responsibility of the authors and does not necessarily represent the official views of the National Institutes of Health.
Appendix
Uncertainty Analysis
When comparing experimental data with simulation results, uncertainty in both measurements and in simulations must also be evaluated. Here, uncertainty in simulation results is the combined outcome of uncertainty in the input parameters, including material properties, sensor location, sample geometry, and measurement hardware specifications. Uncertainty in the current study follows the general model for the propagation of uncertainty in measurements into heat transfer simulations [24]. Assuming that the sources of uncertainty in the model parameters are independent of one another and have the same probability distribution, the uncertainty in the simulated temperature (i.e., the dependent variable) is given by:
| (A.1) |
where δT is the uncertainty in the simulated temperature, a is an independent input parameter, j is an index of all input parameters, the derivative ∂T/∂a represents the sensitivity of the simulated temperature to a variation in an input parameter, δa represents the uncertainty in the measured value of a, Δj represents the uncertainty in the simulated temperature solely as a result of uncertainty in the input value of aj. This evaluation approach is quite similar to the analysis of uncertainty in experimental measurements [24].
Table A.1 lists results from a sensitivity analysis of the worst-case scenario of 50°C/min. The uncertainty associated with sensor positioning and geometry is dictated by manufacturer specifications. The uncertainty assigned to the Einstein model is discussed in the Materials and Methods section. For cases of unknown uncertainty in input parameters in Table A.1, the worst-case scenario for the respective experimental measurement technique is assumed, which leads to a conservative estimation of the overall uncertainty in simulations. Note that the overall uncertainty is also expected to vary with time in the course of the transient simulation. Finally, note that uncertainty is listed only for the volumetric specific heat but not to its primitive quantities (ρ and Cp) separately, since the latter are not used independently in the heat transfer simulation.
It can be seen from Table A.1 that the maximum uncertainty in the simulated temperature is found at the geometric center of the CPA, having a time-average value of 2.94°C. The corresponding uncertainty values at the wall inner and outer surfaces are 1.76°C and 0.38°C, respectively. When comparing simulation results with experimental data, a value of 0.5°C or 0.4% of full temperature scale should be considered for the T-type thermocouples used, whichever value is greater. The linearly proportional uncertainty component (i.e., 0.4% of full scale) translates to a value of 0.68°C when the T-type thermocouple is used to measure the temperature difference between normal room temperature of 20°C and the minimum temperature achieved in the current study of −150°C. This uncertainty component increases to 0.86°C in the worst-case scenario, when the thermocouple is immersed in liquid nitrogen. During thermocouple fabrication in the current study, all sensors were immersed in a water-ice mixture (0°C) and boiling liquid nitrogen at standard atmospheric pressure (−195.8°C) to demonstrate readings within those standard limits.
Table A.1.
Summary of uncertainty analysis results, where Δmax represents the maximum uncertainty in the simulated temperature at some point in time along the thermal history, Δave represents the history-average of the uncertainty in the simulated temperature, and ΔFS is Δave normalized by the full scale of the simulated temperatures (20°C to −130°C); Δ stands for uncertainty in the simulated temperature solely as a result of uncertainty in the corresponding input parameter value, while δT is the overall uncertainty in the simulated temperature at the specific location. Presented uncertainty data correspond to a simulated cooling rate of 50°C/min, which represents the worst-case scenario in the cooling chamber.
| Parameter | Uncertainty Range |
Uncertainty in Simulation Results at Sensor Locations (Fig. 1) | |||||||||
|---|---|---|---|---|---|---|---|---|---|---|---|
| Center of Sample | Inner Wall | Outer Wall | |||||||||
| Δmax, °C | Δave, °C | ΔFS, % | Δmax, °C | Δave, °C | ΔFS, % | Δmax, °C | Δave, °C | ΔFS, % | |||
| DMSO | k | 10% | 2.14 | 0.85 | 1.6 | 0.46 | 0.13 | 0.3 | 0.06 | 0.02 | 0.0 |
| ρCP | 10% | 4.72 | 1.99 | 3.4 | 2.60 | 1.24 | 1.9 | 0.37 | 0.18 | 0.3 | |
| Polystyrene | k | 10% | 1.79 | 0.81 | 1.3 | 1.78 | 0.85 | 1.3 | 0.18 | 0.05 | 0.1 |
| ρCP | 10% | 0.24 | 0.11 | 0.2 | 0.27 | 0.12 | 0.2 | 0.12 | 0.03 | 0.1 | |
| Polyethylene | k | 10% | 0.01 | 0.00 | 0.0 | 0.01 | 0.00 | 0.0 | 0.03 | 0.01 | 0.0 |
| ρCP | 10% | 0.01 | 0.00 | 0.0 | 0.01 | 0.00 | 0.0 | 0.04 | 0.00 | 0.0 | |
| CPA-Air Interface | Free Convection * | 5 to 25 W/m2-°C | 0.79 | 0.37 | 0.6 | 0.84 | 0.39 | 0.6 | 0.61 | 0.26 | 0.4 |
| Center of Sample Sensor Location |
z | 1 mm | 0.18 | 0.07 | 0.1 | n/a | n/a | n/a | n/a | n/a | n/a |
| y | 1 mm | 0.73 | 0.28 | 0.5 | n/a | n/a | n/a | n/a | n/a | n/a | |
| x | 1 mm | 0.70 | 0.26 | 0.5 | n/a | n/a | n/a | n/a | n/a | n/a | |
| Inner Wall Sensor Location |
z | 1 mm | n/a | n/a | n/a | 0.32 | 0.07 | 0.2 | n/a | n/a | n/a |
| x or y | 1 mm | n/a | n/a | n/a | 0.07 | 0.03 | 0.1 | n/a | n/a | n/a | |
| Inner Wall Sensor Location |
z | 1 mm | n/a | n/a | n/a | n/a | n/a | n/a | 0.14 | 0.05 | 0.1 |
| x or y | 1 mm | n/a | n/a | n/a | n/a | n/a | n/a | 0.10 | 0.05 | 0.1 | |
| Geometry | CPA Height | 2 mm | 0.05 | 0.02 | 0.0 | 0.26 | 0.09 | 0.2 | 0.40 | 0.16 | 0.3 |
| Cuvette Dimensions | 0.1 mm | 1.78 | 0.81 | 1.3 | 1.76 | 0.82 | 1.3 | 0.29 | 0.11 | 0.2 | |
| Tape Thickness | 0.01 mm | 0.01 | 0.00 | 0.0 | 0.01 | 0.00 | 0.0 | 0.04 | 0.01 | 0.0 | |
| Overall Heat Transfer Coefficient |
U | 24 W/m2-°C | <0.01 | <0.01 | <0.01 | <0.01 | <0.01 | <0.01 | <0.01 | <0.01 | <0.01 |
| Uncertainty in simulated temperature, δT, Eq. (A.1) | n/a ** | 2.94 | 1.96 | n/a ** | 1.76 | 1.17 | n/a ** | 0.38 | 0.25 | ||
Note that the full range of possible free convection values is considered
Δmax for different input parameters is observed at various times, hence Eq. (A.1) has no meaning for the combined data.
References
- 1.Angell CA. Formation of glasses from liquids and biopolymers. Science. 1995;267(5206):1924–1935. doi: 10.1126/science.267.5206.1924. [DOI] [PubMed] [Google Scholar]
- 2.Cahill DG, Pohl RO. Lattice vibrations and heat transport in crystals and glasses. Ann. Rev. Phys. Chem. 1988;39:93–121. [Google Scholar]
- 3.Ehrlich LE, Feig JSG, Schiffres SN, Malen JA, Rabin Y. A new device and technique for thermal conductivity measurements of glass-forming materials with application to cryopreservation; ASME Summer Heat Transfer Conference; 2013. [Google Scholar]
- 4.Einstein A. Die plancksche theorie der strahlung und die theorie der spezifischen warme (heat capacities of solids with quantized energy) Annalen der Physik. 1906;22:180–190. [Google Scholar]
- 5.Eisenberg DP, Steif PS, Rabin Y. On the effects of thermal history on the development and relaxation of thermo-mechanical stress in cryopreservation. Cryogenics. 2014;64:86–94. doi: 10.1016/j.cryogenics.2014.09.005. [DOI] [PMC free article] [PubMed] [Google Scholar]
- 6.Eisenberg DP, Taylor MJ, Jimenez-Rios JL, Rabin Y. Thermal expansion of vitrified blood vessels permeated with DP6 and synthetic ice modulators. Cryobiology. 2014;68(3):318–326. doi: 10.1016/j.cryobiol.2014.04.010. [DOI] [PMC free article] [PubMed] [Google Scholar]
- 7.Eisenberg DP, Bischof JC, Rabin Y. Thermo-mechanical stress in cryopreservation via vitrification with nanoparticle heating as a stress-moderating effect. ASME Journal of Biomechanical Engineering. 2015;138(1) doi: 10.1115/1.4032053. [DOI] [PubMed] [Google Scholar]
- 8.Feig JSG, Rabin Y. The scanning cryomacroscope with applications to cryopreservation – a device prototype. Cryogenics. 2014;62:118–128. doi: 10.1016/j.cryogenics.2014.04.017. [DOI] [PMC free article] [PubMed] [Google Scholar]
- 9.Feig JSG, Eisenberg DP, Rabin Y. Polarized light scanning cryomacroscopy, Part I: Experimental apparatus and observations of vitrification, crystallization, and photoelasticity effects. Cryobiology. 2016;73(2):261–71. doi: 10.1016/j.cryobiol.2016.06.005. [DOI] [PMC free article] [PubMed] [Google Scholar]
- 10.Gaur U, Wunderlich B. Heat capacity and other thermodynamic properties of linear macromolecules. V. polyethylene. J. Phys. Chem. 1982;10(1):119–152. [Google Scholar]
- 11.Gaur U, Wunderlich B. Heat capacity and other thermodynamic properties of linear macromolecules. V. polystyrene. J. Phys. Chem. 1982;11(2):313–325. [Google Scholar]
- 12.Graeser KA, Patterson JE, Zeitler JA, Rades T. The role of configurational entropy in amorphous systems. Pharmaceutics. 2010;2:224–244. doi: 10.3390/pharmaceutics2020224. [DOI] [PMC free article] [PubMed] [Google Scholar]
- 13.Holman JP. Heat Transfer. 9th. McGraw Hill; 2002. [Google Scholar]
- 14.Hunter E, Oakes WG. The effect of temperature on the density of polythene. Trans. Faraday Soc. 1944;41:49–56. [Google Scholar]
- 15.Jessop HT, Harris FC. Photoelasticity: Principles and Methods. New York: Dover Publications; 1949. [Google Scholar]
- 16.Jimenez-Rios JL, Rabin Y. Thermal expansion of blood vessels in low cryogenic temperatures, Part II: Measurements of blood vessels vitrified with VS55, DP6, and 7.05 M DMSO. Cryobiology. 2006;52(2):284–294. doi: 10.1016/j.cryobiol.2005.12.006. [DOI] [PMC free article] [PubMed] [Google Scholar]
- 17.Jimenez-Rios JL, Steif PS, Rabin Y. Stress-strain measurements and viscoelastic response of blood vessels cryopreserved by vitrification. Annals of Biomedical Engineering. 2007;35(12):2077–2086. doi: 10.1007/s10439-007-9372-0. [DOI] [PMC free article] [PubMed] [Google Scholar]
- 18.Lager GA, Jorgensen JD, Rotella FJ. Crystal structure and thermal expansion of quartz SiO2 at low temperatures. J. Applied Physics. 1982;53(10):6751. [Google Scholar]
- 19.Lord RC, Morrow JC. Calculation of the heat capacity of quartz and vitreous silica from spectroscopic data. J. Chemical Physics. 1957;26(2):230–232. [Google Scholar]
- 20.Mandumpal JB, Krecka CA, Mancera RL. A molecular mechanism of solvent cryoprotection in aqueous DMSO solutions. Phys. Chem. Chem. Phys. 2011;13:3839–3842. doi: 10.1039/c0cp02326d. [DOI] [PubMed] [Google Scholar]
- 21.Noday DA, Steif PS, Rabin Y. Viscosity of cryoprotective agents near glass transition: a new device, technique, and data on DMSO, DP6, and VS55. J. Experimental Mechanics. 2009;49(5):663–672. doi: 10.1007/s11340-008-9191-8. [DOI] [PMC free article] [PubMed] [Google Scholar]
- 22.Patnode W, Scheiber WJ. Density, thermal expansion, vapor pressure, and refractive index of styrene, and the density and thermal expansion of polystyrene. J. Am. Chem. Soc. 1939;61(12):3449–3451. [Google Scholar]
- 23.Plitz J, Rabin Y, Walsh J. The effect of thermal expansion of ingredients on the cocktails VS55 and DP6. Cell Preservation Technology. 2004;2(3):215–226. [Google Scholar]
- 24.Rabin Y. A general model for the propagation of uncertainty in measurements into heat transfer simulations and its application to cryosurgery. Cryobiology. 2003;46(2):109–120. doi: 10.1016/s0011-2240(03)00015-4. [DOI] [PubMed] [Google Scholar]
- 25.Rabin Y, Steif PS. Letter to the Editor: Analysis of thermo-mechanical stress in cryopreservation. Cryo Letters. 2005;26(6):409–412. [PMC free article] [PubMed] [Google Scholar]
- 26.Rabin Y, Steif PS, Hess KC, Jimenez-Rios JL, Palastro MC. Fracture formation in vitrified thin films of cryoprotectants. Cryobiology. 2006;53(1):75–95. doi: 10.1016/j.cryobiol.2006.03.013. [DOI] [PMC free article] [PubMed] [Google Scholar]
- 27.Rasmussen DH, MacKenzie AP. Phase diagram for the system water-dimethylsuphoxide. Nature. 1968;220:315–317. doi: 10.1038/2201315a0. [DOI] [PubMed] [Google Scholar]
- 28.Ratcliffe EH. Thermal conductivities of fused and crystalline quartz. British J. Applied Physics. 1958;10(1):22–25. [Google Scholar]
- 29.Sheldon RP, Lane Sister K. Thermal conductivities of polymers II-polyethylene. Polymer. 1965;6(4):205–212. [Google Scholar]
- 30.Steif PS, Palastro MC, Rabin Y. The effect of temperature gradients on stress development during cryopreservation via vitrification. Cell Preservation Technology. 2007;5(2):104–115. doi: 10.1089/cpt.2007.9994. [DOI] [PMC free article] [PubMed] [Google Scholar]
- 31.Steif PS, Palastro MC, Rabin Y. Continuum mechanics analysis of fracture progression in the vitrified cryoprotective agent DP6. ASME Biomechanical Engineering. 2008;130(2):021006. doi: 10.1115/1.2898716. [DOI] [PMC free article] [PubMed] [Google Scholar]
- 32.Trachenko K, Brazhkin VV. Heat capacity at the glass transition. Phys. Rev. B. 2011;83(1):014201. [Google Scholar]
- 33.Westh P. Thermal expansivity, molar volume, and heat capacity of liquid dimethyl sulfoxide-water mixtures at subzero temperatures. J. Physical Chemistry. 1994;98:3222–3225. [Google Scholar]
- 34.Zhang X, Hendro W, Fujii M, Tomimura T, Imaishi N. Measurements of the thermal conductivity and thermal diffusivity of polymer melts with the short-hot-wire method. J. Thermophysics. 2002;23(4):1077–1090. [Google Scholar]


