Abstract
Programmed cell death-1 (PD-1) is a key negative receptor inducibly expressed on T cells, B cells and dendritic cells. It was discovered on T cells undergoing classical programmed cell death. Studies showed that PD-1 ligation promotes retinal ganglion cell (RGC) death during retinal development. The purpose of this present study is to characterize PD-1 regulation in the retina after optic nerve crush (ONC). C57BL/6 mice were subjected to ONC and RGC loss was monitored by immunolabelling with RNA-binding protein with multiple splicing (Rbpms). Time course of PD-1 mRNA expression was determined by real-time PCR. PD-1 expression was detected with anti-PD-1 antibody on whole mount retinas. PD-1 staining intensity was quantitated. Colocalization of PD-1 and cleaved-caspase-3 after ONC was analyzed. Real-time PCR results demonstrated that PD-1 gene expression was significantly upregulated at day 1, 3, 7, 10 and 14 after ONC. Immunofluorescent staining revealed a dramatic increase of PD-1 expression following ONC. In both control and injured retinas, PD-1 tended to be up-expressed in a subtype of RGCs, whose somata size were significantly larger than others. Compared to control, PD-1 intensity in large RGCs was increased by 82% in the injured retina. None of the large RGCs expressed cleaved-caspase-3 at day 5 after ONC. Our work presents the first evidence of PD-1 induction in RGCs after ONC. This observation supports further investigation into the role of PD-1 expression during RGC death or survival following injury.
Keywords: Programmed cell death-1, Large retinal ganglion cells, Apoptosis, Optic nerve crush, Neuroprotection
1. Introduction
Retinal ganglion cell (RGC) death is a final common pathway in many optic neuropathies including glaucoma (Sucher et al., 1997), optic nerve trauma (Levkovitch-Verbin et al., 2001) and ischemic optic neuropathies (Levin and Louhab, 1996), which is responsible for irreversible visual loss. In addition to any primary damage to RGCs during an initial stress, a variety of other processes such as neurotrophin delivery failure (Quigley et al., 2000), glutamate excitotoxicity (Bai et al., 2013), oxidative stress (Tezel, 2006) and glia dysfunction (Neufeld and Liu, 2003) act to initiate a cascade of cellular events leading to delayed, secondary RGC death. Multiple intracellular signaling pathways are involved in the secondary damage period, including phosphatidylinositol 3-kinase (PI3K) and MAPK /ERK pathways (Kikuchi et al., 2000). These undergo modulation and may be responsible for transducing an apoptotic signal from the cell surface to the nucleus, resulting in cell death. A plethora of investigations have focused on the secondary RGC cell death aimed at uncovering therapeutic strategies to prevent long term RGC loss. However, these efforts are not uniformly successful and treatment for RGC degenerative diseases remains challenging. This gives impetus to continued investigation and understanding of potential upstream molecular mechanisms that correspond to increased or decreased RGC cell death to provide potential targets for the development of efficient treatment for these vision-threatening diseases.
Programmed cell death-1(PD-1) is a key negative coreceptor which regulates the T cell response and plays an important role in tolerance and immunity (Keir et al., 2008). The PD-1 gene was discovered in 1992 when investigators observed significant expression of PD-1 mRNA in T and hematopoietic progenitor cells upon induction of classical programmed cell death (Ishida et al., 1992). Subsequent experiments have confirmed that the ligation of PD-1 with one of its ligands controls downstream events. In the immune system, PD-1 is a critical immunoregulator which delivers inhibitory signals and suppresses the immune response through engagement with its ligands PD-L1 (B7-H1) or PD-L2 (B7-DC) (Francisco et al., 2010). Upon activation, PD-1 is inducibly expressed on T and B cells, and ligation of PD-1 acts to dampen downstream signal transducers including PI3K/Akt (Keir et al., 2008) and ERK (Saunders et al., 2005) via recruitment of phosphatase SHP2 (p-SHP2) (Yokosuka et al., 2012), eventually leading to the reduction of T cell proliferation and cytokine production. PD-1 ligation is also important in tumor biology, wherein high expression of PD-L1 is observed in many tumor cells. The PD-1-PD-L1 interaction plays a crucial role in preventing tumor immunosurveillance by inhibiting tumor-infiltrating CD8 T cells (Okazaki et al., 2013), either through direct induction of CD8 T cell apoptosis (Dong et al., 2002), or alternatively by mediating activated dendritic cell apoptosis (Park et al., 2014). These findings strongly indicate that PD-1 may function to deliver apoptotic signals in the immune system.
Our laboratory previously reported that PD-1 is constitutively expressed in retina ganglion cells (RGCs), an unanticipated observation since PD-1 was previously believed to function exclusively within immune system (Chen et al., 2009a). Concordant with its functions in the immune system, we further demonstrated that PD-1 and its partner(s) play an important role in RGC death during retinal development (Chen et al., 2009b; Sham et al., 2012). It is known that pathological RGC degeneration may share the same mechanisms as those in physiological RGC loss; therefore, we investigated whether PD-1 is involved in RGC apoptosis in pathological settings. In this present study, we examined the expression and regulation of PD-1 following optic nerve crush (ONC) in a mouse model and observed a strong induction of PD-1 expression in a subset of RGCs.
2. Materials and methods
2.1. Animals
Eight to ten week old C57BL/6 mice were obtained from Jackson Laboratory (Bar Harbor, ME). All animal experiments were carried out with approval of the University of California, Los Angeles, Chancellor’s Animal Research Committee, and in compliance with the ARVO Statement for the Use of animal in Ophthalmic and Vision Research.
2.2. Optic nerve crush surgery
The animals were anesthetized by inhalation of isoflurane (0.8% in oxygen). ONC injury was performed according to a protocol described previously (Nadal-Nicolas et al., 2009). Briefly, after animals were anesthetized, a conjunctival incision was made on temporal side of the globe, the optic nerve was exposed intraorbitally by blunt dissection, with care to avoid damage to the optic nerve blood supply. Crush was applied approximately 2 mm behind the globe for 3 seconds with a self-closing forcep (Fine Science Tools, Foster City, CA) and the unoperated fellow eye served as controls. During the procedure, both eyes were treated with an ophthalmic lubricating ointment to protect from drying out. Antibiotic ointment was applied to the ocular surgical site for 3 days after crush.
2.3. Tissue preparation
Eyes were enucleated immediately after euthanasia and a small pinhole was applied on the dorsal cornea as a mark of retinal orientation. The globes were postfixed in 4% paraformaldehyde for an hour at room temperature. For whole mount staining the entire retina of each animal was carefully dissected en bloc and washed multiple times in phosphate buffered saline (PBS). For immunofluorescence staining, each whole retina was incubated with specific antibodies in a glass scintillation vial (Fisher Scientific, Pittsburgh, PA). For vertical sections, paraformaldehyde fixed, frozen vertical retina sections of 7 µm thickness were prepared from adult C57Bl/6 mice, 3 and 7 days post ONC injury. Control vertical retina sections were obtained using the uninjured fellow eye.
2.4. Immunofluorescence Staining
For whole mount staining, blocking was performed for 1 hour at room temperature with blocking buffer (20% fetal bovine serum [FBS] with 2% goat serum, 0.5% bovine serum albumin [BSA], and 1% PBS-Triton X-100 in phosphate buffered saline [PBS]), retinas were incubated overnight at 4°C with a primary antibody: rat anti-mouse PD-1 (1:200; clone 29F. 9A2, rat IgG2a, k, gift from Dr. Gordon J. Freeman), rabbit anti-Rbpms (1:500; gift from Dr. Joseph Caprioli’s lab), rabbit anti-cleaved-caspase-3 (1:400; Cell signaling, Beverly, MA) in primary diluent (2.5% blocking buffer,1% PBS-triton X-100). After 4 washes in washing buffer (2.5% blocking buffer, 1% PBS-triton X-100), the retinas were incubated with secondary AlexaFluor 594 goat-rat IgG antibody or AlexaFluor 488 goat anti-rabbit IgG antibody at a dilution of 1:1000 in secondary diluent (2.5% blocking buffer, 1% PBS-triton X-100) overnight at 4°C. After 4 washes, whole retinas were mounted flat with ganglion cell side up on a glass microscope slide (Fisher Scientific, Pittsburgh, PA) and were air dried overnight. Nuclei were counterstained with Hoechst 33342 (Thermo Scientific, Rockford, IL, USA), tissues were mounted and imaged.
Vertical sections were incubated at 4°C overnight w ith the following primary antibodies: anti-mouse PD-1 (clone 29F.1A12, rat IgG2a) and rabbit anti-RBPMS. The following secondary antibodies were used for incubation for 1 hour at room temperature: AlexaFluor 488 goat anti-rabbit IgG and AlexaFluor 594 goat anti-rat IgG (Life Technologies, Carlsbad, CA). Nuclei were counterstained with 1 µM DAPI (Life Technoligies, Carlsbad, CA).
Antibody blocking experiments were performed using a recombinant mouse Pd-1-Fc fusion protein (R&D Systems, Minneapolis, MN) in 10-fold molar excess to the rat anti-mouse PD-1 (clone 29F.1A12, rat IgG2a) antibody. A non-specific protein was used as control. The fusion or control protein and antibody combination was incubated together for 2 hours at room temperature. The retina sections were incubated at 4°C overnight with the fusion protein-antibody mixture, and stained with the secondary antibodies and DAPI as described.
2.5. RGC quantification
Whole mount retinas were evaluated using the Confocal Laser Scanning microscope (Olympus FluoView™ FV1000, Tokyo, Japan), with a 40× objective and the RGCs were identified by Rbpms staining and quantified. Three sampling fields (371 × 371 µm2) were acquired per retinal quadrant from central, middle and periphery area, respectively, and concordant regions were randomly sampled for each specimen. Rbpms positive cells were counted manually in each field using the public domain Java image processing software Image J (NIH). The cell number counted from a total of 12 photographs per retina were totaled and the mean RGC density (number of cells per mm2) was obtained for statistical analysis.
2.6. Real-time PCR
Retinal tissues were collected using a dissecting microscope at different time points after ONC and stabilized in RNAlater (Qiagen, Valencia, CA). Total RNA was extracted utilizing RNeasy Mini Kit (Qiagen, Valencia, CA) per manufacturer’s instructions. For first-strand cDNA synthesis, a 20ul reverse transcription reaction system containing Superscript III, oligo (dT) and dNTPs mixture was employed. Briefly, the reaction was incubated at 25 °C for 10 minutes, 50°C for 30 minutes, followed by inactivat ion at 85 °C for 5 minutes, then chilled on ice and 1ul of RNase H was added. The reaction was then incubated at 37 °C for 20 minutes. Taqman real-time PCR assay was carried out using 7500 Fast System (ABI 7500; Applied Biosystems, Foster City, CA) in a standard 7500 mode. The thermal cycling condition was as follows: 50 °C for 2 minutes, 95 °C for 10 minutes, 40 cycles of 95 °C for 15 seconds, 60 °C for 1 minutes, followed by 55 °C for 10 seconds, fi nally 25 °C for 5 minutes. Mean Ct value was obtained and relative mRNA level was measured by the 2−ΔΔCt method and normalized using the housekeeping gene GAPDH. The following predesigned gene-specific TaqMan® probe and primer sets were employed: Pdcd1, FAM-MGB (Applied Biosystems, Foster City, CA), GAPDH, FAM-MGB (Applied Biosystems, Foster City, CA).
2.7. Immunofluorescent staining analysis
High-resolution images (1024 × 1024 pixels) were captured using Confocal Laser Scanning Microscope (Olympus FluoView™ FV1000, Tokyo, Japan) with a 40× objective. For quantitative purpose, all samples were scanned under same settings. Staining intensity analysis was performed using the ‘single analysis’ tool of the Olympus FluoView™ FV1000 software (FV10-ASW 3.1). Immunofluorescence staining of individual cells was measured and mean intensity value was obtained. There is precedence for this type of relative quantitation of protein expression in the literature, primarily with regards to tumor expression of proteins (Huntsman et al., 1999; Carvajal-Hausdorf et al., 2015).
2.8. Statistical analysis
Statistical analysis was performed using Prism 5 software (GraphPad, San Diego, CA). Statistical significance was determined by unpaired, two-tailed Student’s t-test. One-way ANOVA followed by Tukey's multiple comparison tests was applied for analysis of differences among groups. P < 0.05 was considered statistically significant. All statistical results were representative of at least three individual experiments. For animal experiments, at least 3 animals were involved in each evaluation.
3. Results
3.1. PD-1 gene undergoes upregulation after optic nerve crush
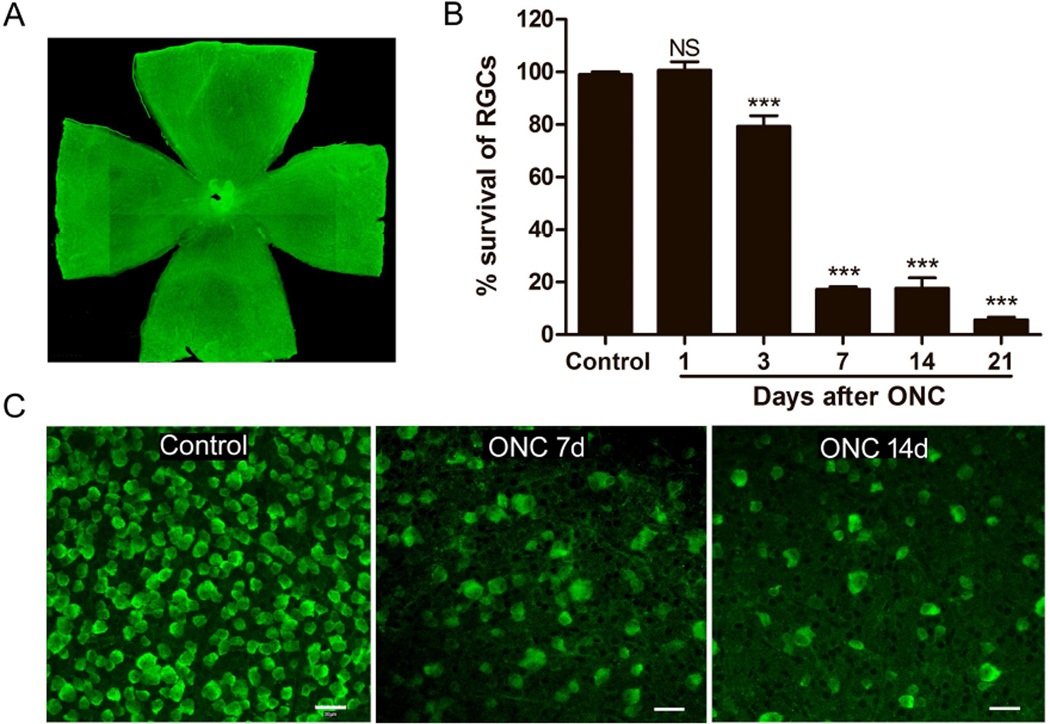
The mouse optic nerve crush (ONC) model was established. Although ONC is a commonly used animal model for acute RGC degeneration (Kalesnykas et al., 2012; Kwong et al., 2011), we confirmed the reproducible and reliable loss of RGCs following crush in our laboratory. RGC loss was monitored by immunostaining with RNA-binding protein with multiple splicing (Rbpms), which has been shown to be an effective RGC marker in different models on whole mount retinas following ONC (Kwong et al., 2011). We started to observe a significant RGC loss at day 3 after ONC (p < 0.001). The number of RGCs was dramatically reduced at day 7 following ONC, at which time there were about 17.29 ± 1.11% remaining RGCs compared to control (p < 0.001). Over 90% RGCs died within 21 days after ONC using the protocol as described (p < 0.001) (Fig. 1B).
Fig. 1.
Loss of RGCs immunostained with Rbpms on whole mount retina following ONC. A) Image of whole mount retina immunostained with Rbpms. Magnification 10×. B) Graph showing RGCs loss in whole mount retina after ONC. There was no significant RGCs loss until day 3 after ONC when compared to control, the number of RGCs was dramatically reduced in injured retina 7, 14 and 21 days after ONC compared to that in the control retina. All data were presented as mean ± standard deviation (SD). One-way ANOVA, Tukey’s test, ***p < 0.001. C) Representative images of RGCs immunostained with Rbpms taken from middle area of non-injured retina (Control), and retinas subjected to ONC (7 and 14 days after ONC). Scale bars, 30µm.
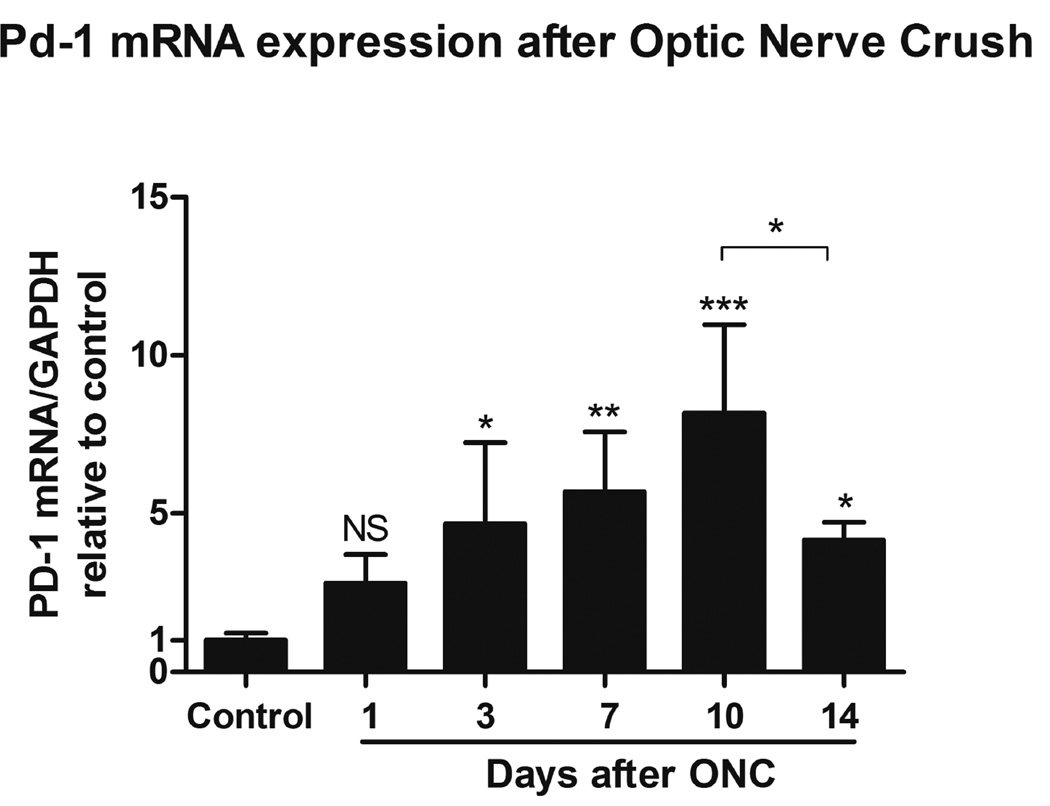
We next examined PD-1 gene expression in the retina after ONC. In the developing retina, PD-1 expression undergoes dynamic regulation and correlates with the time of active RGC culling (Chen et al., 2009b). The level of PD-1 expression decreases after the early postnatal stage, and remains low but measurable in the adult retina. To investigate PD-1 gene expression in the retina during the process of RGC death, the time course of PD-1 mRNA expression was determined by real-time PCR. Based on the results from Figure 1, we chose to examine day 0 to day 14 following ONC, when the majority of RGCs were undergoing cell death. Total RNA was obtained at 0, 1, 3, 7, 10 and 14 days after ONC and the PD-1 mRNA level was quantified. Compared to the non-injured retina, a significant increase of PD-1 mRNA level was observed in the injured retina at day 3 (p < 0.05), and remained elevated at both day 7 (p < 0.01) and day 10 (p < 0.001) after ONC (Fig. 2). PD-1 mRNA level appeared to decrease from its maximal level but remained higher than the basal level at day 14 after ONC (p < 0.05, Fig. 2). Here we employed GAPDH as housekeeping gene instead of the specific ganglion cell marker gene Thy1 since it has been reported that Thy1 mRNA decreased prior to the loss of RGCs, following ONC (Schlamp et al., 2001). All values are representative of three individual experiments.
Fig. 2.
Time course of PD-1 mRNA expression in the retina after ONC by real-time PCR. All values are represented as fold changes relative to non-injured retina (control), the controls have been assigned a value of 1. PD-1 mRNA expression in the injured retina increased significantly as early as 1 day after ONC, PD-1 mRNA expression level increased to about 8 folds at day 10 after ONC. At day14 following ONC, PD-1 expression appeared to decrease but remained higher than control. PD-1 mRNA expression at each time point was normalized with GAPDH. Data were presented as mean ± SD. One-way ANOVA, Tukey’s test, *p < 0.05, **p < 0.01, ***p < 0.001.
3.2. PD-1 expression is increased in the mouse retina following optic nerve injury
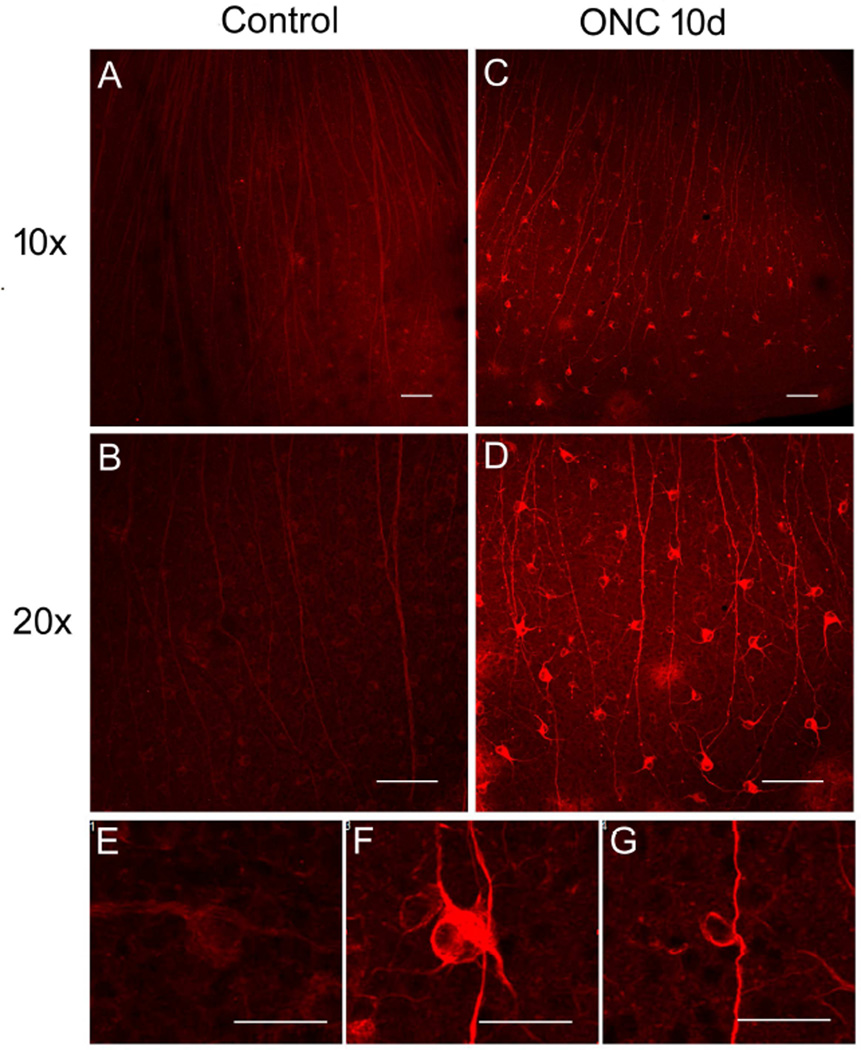
To further investigate PD-1 expression in the retina, immunofluorescence staining was performed using anti-PD-1 antibody on whole mount retina following optic nerve injury. Concordant with the real-time PCR evaluation, immunofluorescence staining results confirmed an increase in PD-1 expression starting day 3 after ONC (data not shown). As shown in Fig. 3, at day 10, retina subjected to ONC showed a dramatically increased PD-1 staining (Fig. 3C, D) compared to the non-injured control samples (Fig. 3A, B). In retinas subjected to ONC, two distinct PD-1 expression patterns were found (Fig. 3F, G). In the first pattern (Fig. 3F), PD-1 was widely expressed on retinal cell surface, cytosol, dendrites and axons, whereas in the second pattern, PD-1 was highly expressed on the cell surface and axons (Fig. 3G). In the normal whole mount retina, PD-1 expression was detected in retinal cells at a low level (Fig. 3E). We also noted that the enhanced PD-1 expression in the injured retina was largely restricted to the area of the whole mount corresponding to the equatorial retina (data not shown).
Fig. 3.
PD-1 expression was increased in the whole mount retina following ONC. A, B) Images of non-injured whole mount retina immunostained with anti-PD-1 antibody. Magnification A, 10×; B, 20×. Scale bars, 100µm. C, D) Images of injured retina immunostained with anti-PD-1 antibody 10 days after ONC, showing dramatic increase of PD-1 expression compared to that in the control retina. Magnification C, 10×; D, 20×. Scale bars, 100µm. E) Image showing PD-1 expression pattern in normal retina. Scale bar, 30µm. F, G) Images showing two distinct PD-1 expression patterns in the injured retina. In the first pattern, PD-1 was widely expressed on retinal cell surface, cytosol, dendrites and axons (F), whereas in the second pattern PD-1 was highly expressed on the cell surface and axons (G). Scale bars, 30µm. Observations described above were confirmed in all animals examined.
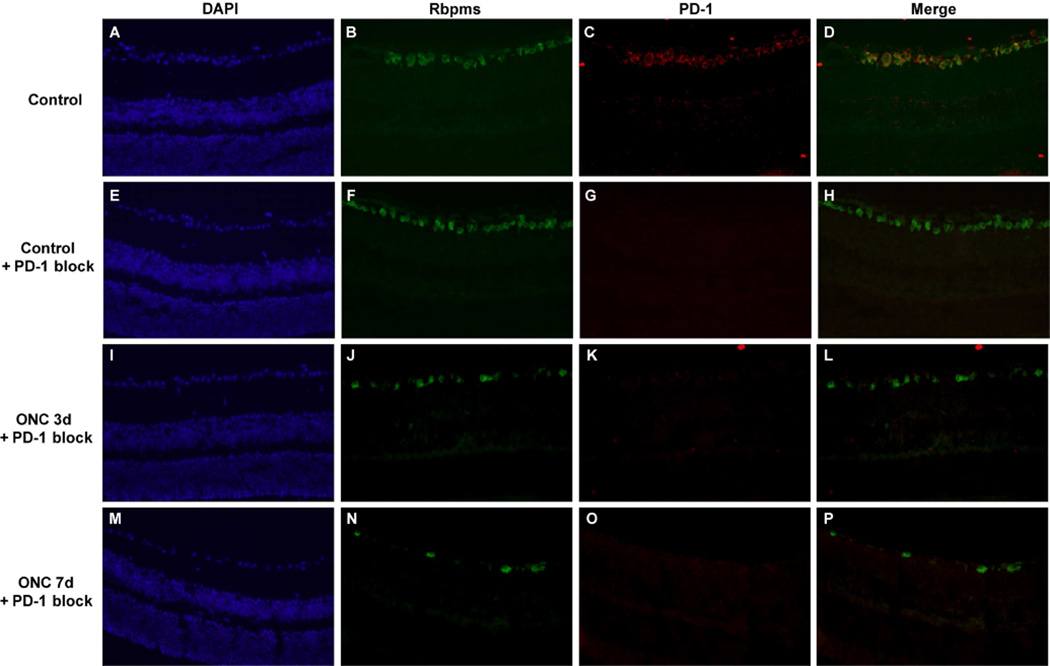
To confirm specificity of the binding to PD-1 antibody blocking studies were performed using either the PD-1 protein (PD-1-Fc fusion protein)(Figure 4) or a control protein (data not shown). Figure 4 A–D confirms the colocalization of PD-1 with Rbpms, a specific marker for retinal ganglion cells. Figure 4 E–H demonstrates complete blockade of PD-1 binding using the fusion protein; the control protein did not block binding of the antibody (data not shown). Figure 4 I–L and M–P demonstrate the remaining Rbpms positive retinal ganglion cells in the eyes status post crush. Notably, preincubation of the anti-PD-1 antibody with the PD-1 fusion protein blocked antibody binding to the damaged retina.
Figure 4.
PD-1 antibody binding to retinal ganglion cells is blocked by PD-1 fusion protein. Images of uninjured control retina immunostained with (A) DAPI, (B) anti-Rbpms, (C) PD-1, and (D) merged image. Antibody neutralization was performed by incubating PD-1 fusion protein with rat anti-PD-1 antibody for 2 hours at room temperature. Vertical retinal sections were incubated with DAPI or the primary antibodies anti-Rbpms to identify retinal ganglion cells, or rat anti-PD-1 antibody that had been preincubated with PD-1-Fc protein. Bound antibody was detected using an appropriate secondary antibody as described in the methods section. Images of uninjured control retina (E, F, G, H) and injured retina obtained either 3 days (I, J, K, L) and 7 days (M, N, O, P) post-ONC are shown. These are representative images from at least 3 different samples. Magnification 40×.
3.3. PD-1 is associated with large RGCs in the mouse retina and is dramatically upregulated in large RGCs after optic nerve injury
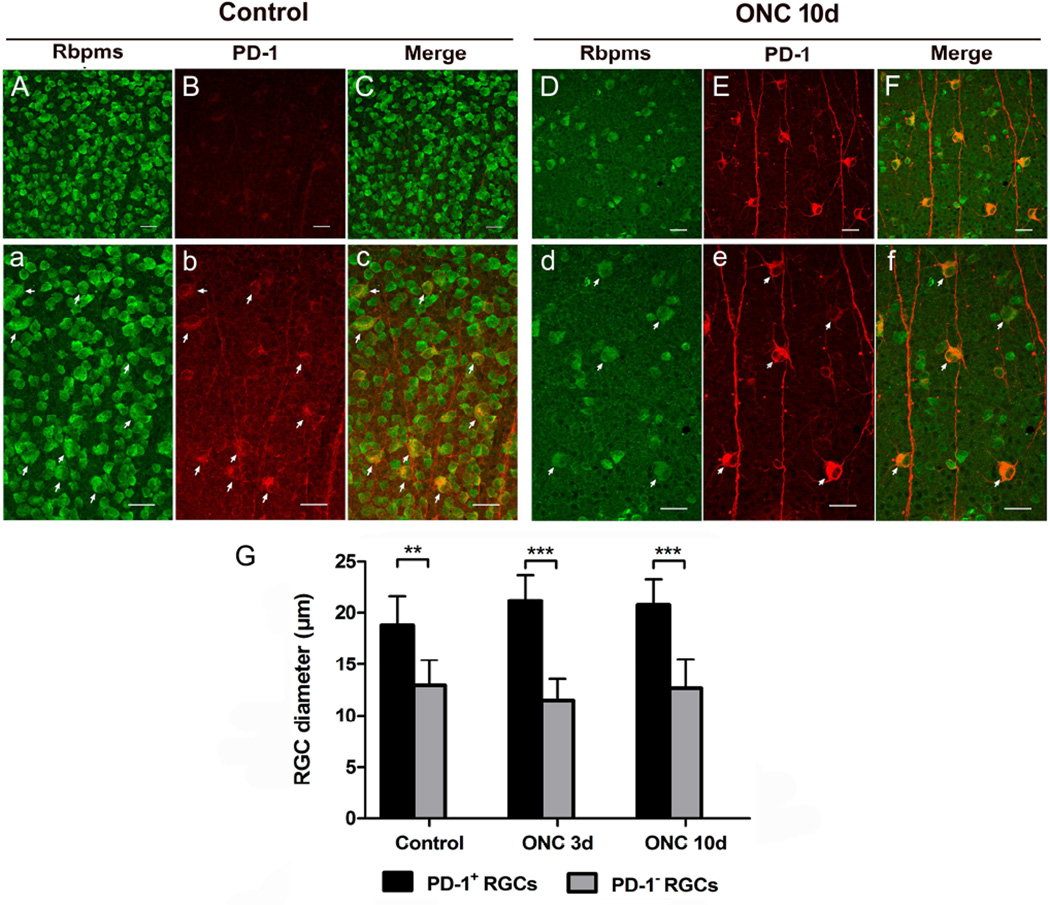
Our group previously found that PD-1 is expressed in more than 95% of RGCs in the adult retina, studies that were performed in vertical retinal sections (Chen et al., 2009b). In the current study, employment of retinal flatmounts allowed us to further characterize the PD-1 expression pattern in the mouse retina. Double staining of PD-1 and RGCs was performed on whole mount retina following optic nerve injury. In the mouse retina, all PD-1 positive cells are Rbpms positive RGCs, which was confirmed in both normal retinas and injured retinas 10 days after ONC (Fig. 5). Sagittal sections also confirmed the limited expression of PD_1 to the RGC (data not shown). Importantly, we were intrigued to find that, in retinas subjected to ONC, PD-1 was overexpressed in a subtype of RGCs (Fig. 5D, E, F), which appeared to be bigger than most of their neighboring RGCs (arrows, Fig. 5d, e, f). PD-1 expression pattern in these large RGCs corresponded to the ‘first pattern’ described in Fig. 3F. We observed that the large RGC also expressed PD-1 in the uninjured retina, but the staining was dimmer than observed in the large RGC after ONC (arrows, Fig. 5a, b, c). In other words, PD-1 expression level changes in injured retina were observed primarily in these large RGCs. Quantitative analysis of cell diameter revealed that somata size of these RGCs were significantly larger than PD-1 negative RGCs in both normal (p < 0.01) and injured (p < 0.001) retinas (Fig. 5G). These large RGCs, which can be easily distinguished from other RGCs according to their large somata size, resemble the ON α-retina ganglion cells reported previously (Estevez et al., 2012).
Fig. 5.
Colocalization of PD-1 and Rbpms immunolabelled RGCs in the normal and injured retinas. A, B, C) Images of normal whole mount retina immunostained with RGC marker Rbpms (green) and anti-PD-1 antibody (red) and merged picture of both. Scale bars, 30µm. a, b, c) High-magnification images of Fig. A, B, C. To visualize PD-1 expression pattern in the normal retina, Fig. 4B was shown in a larger version with enhanced intensity (b). Merged picture showing colocalization of PD-1 with a subtype of RGCs (arrows, c), which appeared to be larger than their neighboring RGCs. Scale bars, 30µm. D, E, F) Images of injured retina immunostained with Rbpms (green) and anti-PD-1 antibody (red) 10 days after ONC. Scale bars, 30µm. d, e, f) High-magnification images of Fig. D, E, F. Same situation was found, that PD-1 up-expressed RGCs were larger than PD-1 negative RGCs (arrows). Scale bars, 30µm. G) Quantitatively, measurement of cell diameter revealed that in both normal and injured retinas, somata size of PD-1 up-expressed RGCs were significantly larger than PD-1 negative RGCs, in which PD-1 is undetectable using current methodology. 3 animals were included in each group and time point. Data were presented as mean ± SD. Images for quantitative analysis were captured randomly. T-test, **p < 0.01, ***p < 0.001.
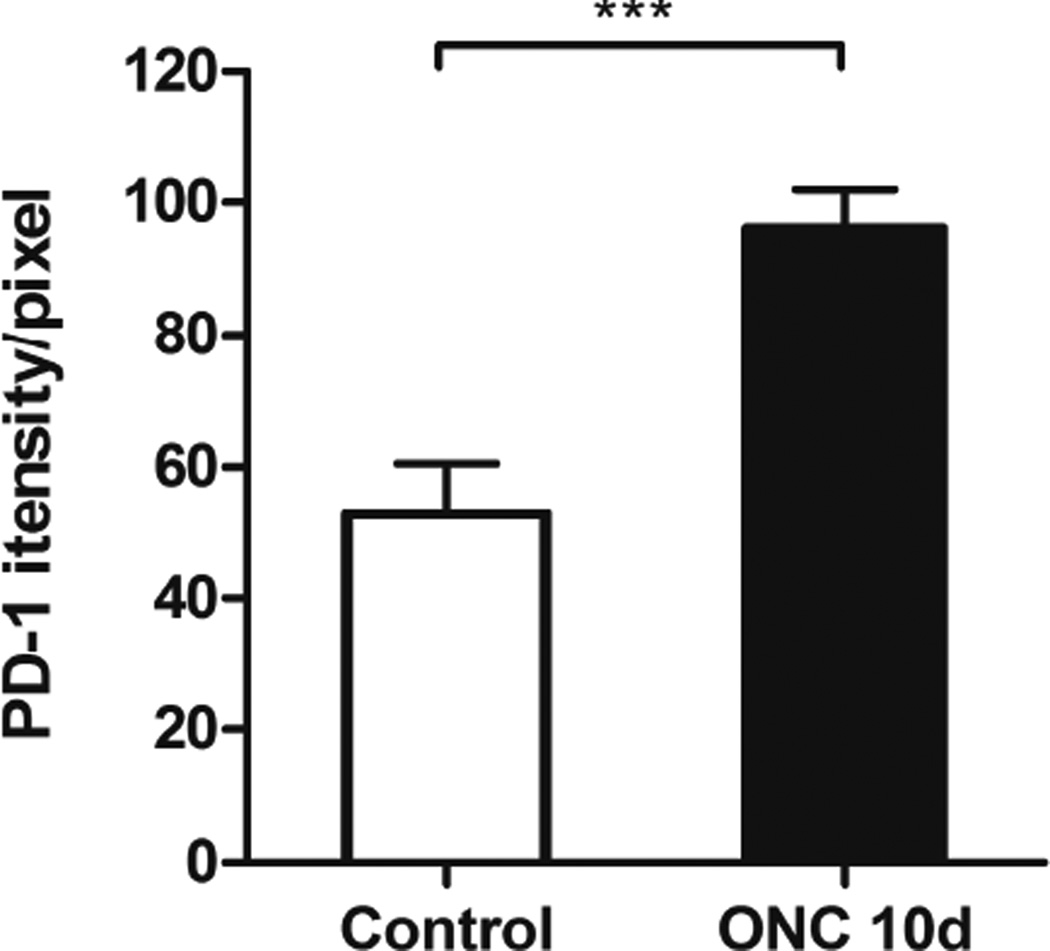
Quantitative comparison of PD-1 staining intensity in large RGCs in uninjured and injured retinas was carried out utilizing FV10-ASW software. We chose to measure staining intensity because the changes we observed were only exhibited in a small population of RGCs, below the level of detection using Western blot (data not shown). Ten days after ONC, there was an 82% increase of staining intensity in PD-1 up-expressed RGCs compared to that in non-injured RGCs (p < 0.0001, Fig. 6). PD-1 positive large RGCs were selected using regions of interest (ROIs) tool of FV10-ASW software. The staining intensity in individual cells was quantified separately and the average staining level was shown.
Fig. 6.
Quantitative analysis of PD-1 staining intensity in large RGCs in control and injured retinas. Bar graphs showing average intensity value of PD-1 staining in large RGCs (see Fig. 3E, F) in the control and injured retinas, suggesting an increase of estimated 80% in staining intensity in injured RGCs compared to that in normal RGCs. N = 4 animals were used in each group, a total of n = 121 (control) and n = 88 (ONC) cells were examined. Data were presented as mean ± SD. T-test, ***p < 0.001.
3.4. PD-1 positive large RGCs do not express cleaved-caspase-3 after optic nerve injury
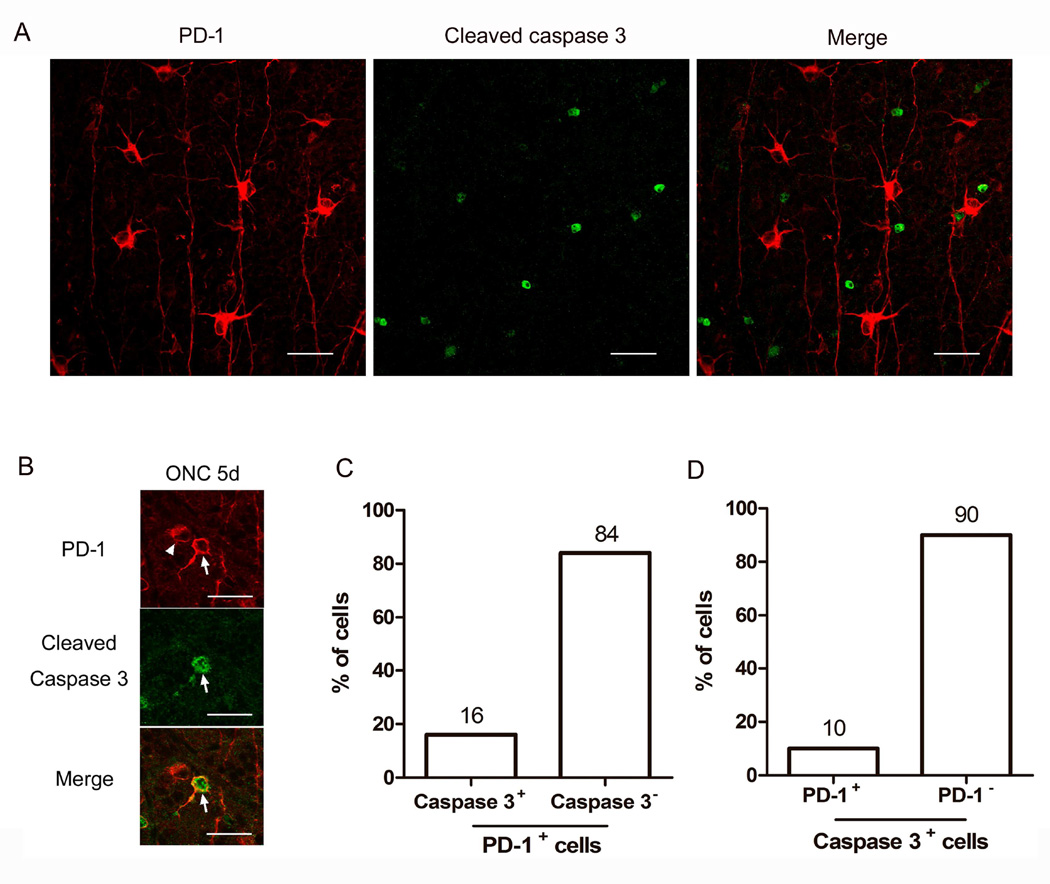
During developmental apoptosis of RGCs, blockade of PD-1 with blocking antibody significantly downregulates caspase-3 activation and prevent RGCs from caspase-3 mediated apoptosis (Chen et al., 2009b). To determine whether the increased PD-1 expression in a subset of RGCs correlated with caspase-3 activation, double staining of PD-1 and cleaved-caspase-3 was performed in whole mount retina following ONC. First, we examined the expression of cleaved-caspase-3 in the retina following ONC. Although the peak of cleaved-caspase-3 was previously reported at 3 days following crush (Cheung et al., 2004), in our laboratory we found the greatest expression at day 5 post-crush when using immunofluorescence on whole mount retina (data not shown). Double staining of PD-1 and cleaved-caspase-3 was therefore performed on whole mount retina, 5 days after ONC. None of the PD-1 positive large RGCs (see Fig. 2F) expressed cleaved-caspase-3 (Fig. 7A). Only a few small RGCs are positive for both PD-1 and cleaved-caspase-3 (Fig. 7B), which accounted for 10% of the PD-1 positive RGCs (Fig. 7C), and 16% of cleaved-caspase-3 positive RGCs (Fig. 7D), respectively.
Fig. 7.
Double staining of PD-1 and cleaved-caspase-3 in injured retina at 5 days after ONC. A) Representative photographs of PD-1 (red) and cleaved-caspase-3 (green) staining on whole mount retina 5 days after ONC, showing a field in which none of the PD-1 positive large RGCs (see Fig. 2F) expressed cleaved-caspase-3. B) This image shows two smaller RGCs, one of which expresses both PD-1 and cleaved caspase-3 (arrow), the other one only contain PD-1 (arrow head). Scale bars, 30µm. C, D) Graphs showing the percentage of PD-1 positive cells that either express or do not express cleaved-caspase-3 (C), or the percentage of cleaved-caspase-3 positive cells that either express or do not express PD-1 (D). 3 animals were used in each group, and the images for quantitative analysis were captured randomly from whole mount retinas.
4. Discussion
Identification of PD-1 and it’s ligands in the retina and the establishment of their role in developmental RGC apoptosis has introduced a novel molecular mechanism for RGC death: that RGC apoptosis may be turned on by a negative signal delivered by receptor-ligand interaction through the PD-1 system (Chen et al., 2009a; Chen et al., 2009b; Sham et al., 2012). In this study we further demonstrate that PD-1 is dramatically upregulated in some RGCs after optic nerve injury, raising the possibility that PD-1 signaling pathway might be functionally important in pathological RGC cell loss in the adult animal.
Apoptosis can be induced through PD-1 engagement in the immune system (Dong et al., 2002; Park et al., 2014). With the high expression of PD-L1 in many tumors, PD-1 is hypothesized to deliver an apoptotic signal to infiltrating cytoxic T cells and thus limit the immune surveillance. Although there may be other binding partner(s) mediating apoptotic function of PD-L1 engagement, the fact that apoptosis could be blocked in a human CD8+ cytolytic T cell clone by soluble PD-1Ig treatment provides evidence that apoptosis is mediated through PD-1 (Dong et al., 2002). Furthermore, new evidence showed that inducible expression of PD-1 in activated dendritic cells (DCs) is important in mediating DCs apoptosis (Park et al., 2014). In the current ONC model, we clearly demonstrated a dramatic increase of PD-1 in RGCs following crush, taken together with our previous findings in developing retina, we propose that PD-1 may play a pivotal role in RGCs degeneration. However, the molecular details for PD-1 in mediating cell death in RGCs remain to be defined.
In the immune system, PD-1 functions directly through recruitment of phosphatase SHP2 (p-SHP2) (Yokosuka et al., 2012). Intracellular SHP2 activation negatively regulates downstream transducers such as PI3K/Akt (Keir et al., 2008) and ERK (Saunders et al., 2005), resulting in reduction of NF-κB activation and cytokine production. SHP2 is widely expressed in various tissues including the retina and is involved in many signaling pathways initiated by growth factors and cytokine receptors (Qu, 2002). In most situations it is believed to be a positive regulator while in some certain circumstances, it ultimately affects signal transduction negatively (Qu, 2002). SHP2-mediated ERK signaling is required for retinal neuron maturation and function (Cai et al., 2011; Kumamaru et al., 2011), but new evidence showed that SHP2 participated in RGCs degeneration after optic nerve axotomy by which SHP2 activity was enhanced in RGCs and negatively regulated TrkB receptor activity (Gupta et al., 2012). It is possible that PD-1 may be the upstream regulator for the negative effect of SHP2 on RGC survival signaling.
Another possibility for the role of PD-1 in inducing apoptosis is the “reverse signal” concept (Keir et al., 2008), which is an important property of PD-1 signaling system, that PD-L1 and PD-L2 may not only function by directly engaging PD-1 and modifying its downstream signaling, but also may signal into neighboring PD-L1 or PD-L2 expressing cells and elicit various cellular responses (Keir et al., 2008). In the retina, PD-L1 and PD-L2 genes are constitutively expressed and PD-L1 was localized in RGCs (Chen et al., 2009b; Sham et al., 2012), Thus, we speculate that induction of PD-1 in some large RGCs might exert apoptotic effects on neighboring RGCs by a reverse-signal mechanism through PD-L1. However this speculation would need to be addressed experimentally using genetically knockout animals (PD-1 and PD-L1), studies that are beyond the scope of the current investigation.
The significance of the dramatic increase in PD-1 expression in large RGCs is not yet clear. There is confounding evidence in the literature about the susceptibility of the large RGCs to cell death. Large RGCs were relatively spared in a model of axonal injury (Perez de Sevilla Muller et al., 2014). In contrast, in a glaucoma model induced by chronic elevation of intraocular pressure (IOP), the large RGCs showed greater susceptibility and tended to be more severely damaged compared to smaller RGCs (Quigley et al., 1987). The lack of concordance of expression of cleaved-caspase-3 and PD-1 in the RGCs in the injured retina was unanticipated but does not rule out the possibility of PD-1 inducing an apoptotic signal during retinal damage. This signal could occur through other pathways or alternatively by affecting neighboring cells. These possibilities require additional investigation, yet are routed in prior knowledge of the PD-1 pathway.
In conclusion, our work presents the first evidence of PD-1 induction in RGCs after crush, which provides a potential upstream molecular target for the neuroprotective management of RGC degenerative diseases. Further studies are required to define the role of PD-1 upregulation in neuronal cell survival following injury and to determine the effect of blockade of PD-1 on RGC apoptosis in ON injury or other stress conditions. This has recently become more important as a theoretical potential in view of the recent FDA approval for use of designer antibodies to block the PD-1 pathway in cancer therapy; thus raising the possibility that there may be a clinical opportunity to block the PD-1 pathway in the eye, should that prove to be useful in preserving RGCs following injury (Okazaki and Honjo, 2007).
Supplementary Material
-
▪
PD-1 gene expression is upregulated as early as day 1 following optic nerve crush
-
▪
PD-1 protein expression by immunofluorescence is significantly increased in a subset of large retinal ganglion cells
-
▪
Cleaved caspase 3 was not observed in the large retinal ganglion cells that expressed high levels of PD-1
Acknowledgement
This research was funded by NEI EY00331; The National Natural Science Foundation of China (No. 81371042, LC and WW); The major program of the Natural Science Foundation of China (No. 2013CB967503, LC); The Scientific Research Starting Foundation for the Returned Overseas Chinese Scholars, Ministry of Education (LC); and Research to Prevent Blindness (LKG).
Footnotes
Publisher's Disclaimer: This is a PDF file of an unedited manuscript that has been accepted for publication. As a service to our customers we are providing this early version of the manuscript. The manuscript will undergo copyediting, typesetting, and review of the resulting proof before it is published in its final citable form. Please note that during the production process errors may be discovered which could affect the content, and all legal disclaimers that apply to the journal pertain.
References
- Bai N, Aida T, Yanagisawa M, Katou S, Sakimura K, Mishina M, Tanaka K. NMDA receptorsubunits have different roles in NMDA-induced neurotoxicity in the retina. Mol Brain. 2013;6:34. doi: 10.1186/1756-6606-6-34. [DOI] [PMC free article] [PubMed] [Google Scholar]
- Cai Z, Simons DL, Fu XY, Feng GS, Wu SM, Zhang X. Loss of Shp2-mediated mitogen-activated protein kinase signaling in Muller glial cells results in retinal degeneration. Mol Cell Biol. 2011;31:2973–2983. doi: 10.1128/MCB.05054-11. [DOI] [PMC free article] [PubMed] [Google Scholar]
- Carvajal-Hausdorf DE, Schalper KA, Pusztai L, Psyrri A, Kalogeras KT, Kotoula V, Fountzilas G, Rimm DL. Measurement of Domain-Specific HER2 (ERBB2) Expression May Classify Benefit From Trastuzumab in Breast Cancer. J Natl Cancer Inst. 2015 May 19;107:8. doi: 10.1093/jnci/djv136. [DOI] [PMC free article] [PubMed] [Google Scholar]
- Chen L, Pai V, Levinson R, Sharpe AH, Freeman GJ, Braun J, Gordon LK. Constitutive neuronal expression of the immune regulator, programmed death 1 (PD-1), identified during experimental autoimmune uveitis. Ocul Immunol Inflamm. 2009a;17:47–55. doi: 10.1080/09273940802491884. [DOI] [PubMed] [Google Scholar]
- Chen L, Sham CW, Chan AM, Francisco LM, Wu Y, Mareninov S, Sharpe AH, Freeman GJ, Yang XJ, Braun J, Gordon LK. Role of the immune modulator programmed cell death-1 during development and apoptosis of mouse retinal ganglion cells. Invest Ophthalmol Vis Sci. 2009b;50:4941–4948. doi: 10.1167/iovs.09-3602. [DOI] [PMC free article] [PubMed] [Google Scholar]
- Cheung ZH, Chan YM, Siu FK, Yip HK, Wu W, Leung MC, So KF. Regulation of caspase activation in axotomized retinal ganglion cells. Mol Cell Neurosci. 2004;25:383–393. doi: 10.1016/j.mcn.2003.11.001. [DOI] [PubMed] [Google Scholar]
- Dong H, Strome SE, Salomao DR, Tamura H, Hirano F, Flies DB, Roche PC, Lu J, Zhu G, Tamada K, Lennon VA, Celis E, Chen L. Tumor-associated B7-H1 promotes T-cell apoptosis: a potential mechanism of immune evasion. Nat Med. 2002;8:793–800. doi: 10.1038/nm730. [DOI] [PubMed] [Google Scholar]
- Estevez ME, Fogerson PM, Ilardi MC, Borghuis BG, Chan E, Weng S, Auferkorte ON, Demb JB, Berson DM. Form and function of the M4 cell, an intrinsically photosensitive retinal ganglion cell type contributing to geniculocortical vision. J Neurosci. 2012;32:13608–13620. doi: 10.1523/JNEUROSCI.1422-12.2012. [DOI] [PMC free article] [PubMed] [Google Scholar]
- Francisco LM, Sage PT, Sharpe AH. The PD-1 pathway in tolerance and autoimmunity. Immunol Rev. 2010;236:219–242. doi: 10.1111/j.1600-065X.2010.00923.x. [DOI] [PMC free article] [PubMed] [Google Scholar]
- Gupta VK, You Y, Klistorner A, Graham SL. Shp-2 regulates the TrkB receptor activity in the retinal ganglion cells under glaucomatous stress. Biochim Biophys Acta. 2012;1822:1643–1649. doi: 10.1016/j.bbadis.2012.07.016. [DOI] [PubMed] [Google Scholar]
- Huntsman D, Resau JH, Klineberg E, Auersperg N. Comparison of c-met expression in ovarian epithelial tumors and normal epithelia of the female reproductive tract by quantitative laser scan microscopy. Am J Pathol. 1999;155:343–348. doi: 10.1016/S0002-9440(10)65130-9. [DOI] [PMC free article] [PubMed] [Google Scholar]
- Ishida Y, Agata Y, Shibahara K, Honjo T. Induced expression of PD-1, a novel member of the immunoglobulin gene superfamily, upon programmed cell death. EMBO J. 1992;11:3887–3895. doi: 10.1002/j.1460-2075.1992.tb05481.x. [DOI] [PMC free article] [PubMed] [Google Scholar]
- Kalesnykas G, Oglesby EN, Zack DJ, Cone FE, Steinhart MR, Tian J, Pease ME, Quigley HA. Retinal ganglion cell morphology after optic nerve crush and experimental glaucoma. Invest Ophthalmol Vis Sci. 2012;53:3847–3857. doi: 10.1167/iovs.12-9712. [DOI] [PMC free article] [PubMed] [Google Scholar]
- Keir ME, Butte MJ, Freeman GJ, Sharpe AH. PD-1 and its ligands in tolerance and immunity. Annu Rev Immunol. 2008;26:677–704. doi: 10.1146/annurev.immunol.26.021607.090331. [DOI] [PMC free article] [PubMed] [Google Scholar]
- Kikuchi M, Tenneti L, Lipton SA. Role of p38 mitogen-activated protein kinase in axotomy-induced apoptosis of rat retinal ganglion cells. J Neurosci. 2000;20:5037–5044. doi: 10.1523/JNEUROSCI.20-13-05037.2000. [DOI] [PMC free article] [PubMed] [Google Scholar]
- Kumamaru E, Numakawa T, Adachi N, Kunugi H. Glucocorticoid suppresses BDNF-stimulated MAPK/ERK pathway via inhibiting interaction of Shp2 with TrkB. FEBS Lett. 2011;585:3224–3228. doi: 10.1016/j.febslet.2011.09.010. [DOI] [PubMed] [Google Scholar]
- Kwong JM, Quan A, Kyung H, Piri N, Caprioli J. Quantitative analysis of retinal ganglion cell survival with Rbpms immunolabeling in animal models of optic neuropathies. Invest Ophthalmol Vis Sci. 2011;52:9694–9702. doi: 10.1167/iovs.11-7869. [DOI] [PMC free article] [PubMed] [Google Scholar]
- Levin LA, Louhab A. Apoptosis of retinal ganglion cells in anterior ischemic optic neuropathy. Arch Ophthalmol. 1996;114:488–491. doi: 10.1001/archopht.1996.01100130484027. [DOI] [PubMed] [Google Scholar]
- Levkovitch-Verbin H, Quigley HA, Kerrigan-Baumrind LA, D'Anna SA, Kerrigan D, Pease ME. Optic nerve transection in monkeys may result in secondary degeneration of retinal ganglion cells. Invest Ophthalmol Vis Sci. 2001;42:975–982. [PubMed] [Google Scholar]
- Nadal-Nicolas FM, Jimenez-Lopez M, Sobrado-Calvo P, Nieto-Lopez L, Canovas-Martinez I, Salinas-Navarro M, Vidal-Sanz M, Agudo M. Brn3a as a marker of retinal ganglion cells: qualitative and quantitative time course studies in naive and optic nerve-injured retinas. Invest Ophthalmol Vis Sci. 2009;50:3860–3868. doi: 10.1167/iovs.08-3267. [DOI] [PubMed] [Google Scholar]
- Neufeld AH, Liu B. Glaucomatous optic neuropathy: when glia misbehave. Neuroscientist. 2003;9:485–495. doi: 10.1177/1073858403253460. [DOI] [PubMed] [Google Scholar]
- Okazaki T, Chikuma S, Iwai Y, Fagarasan S, Honjo T. A rheostat for immune responses: the unique properties of PD-1 and their advantages for clinical application. Nat Immunol. 2013;14:1212–1218. doi: 10.1038/ni.2762. [DOI] [PubMed] [Google Scholar]
- Okazaki T, Honjo T. PD-1 and PD-1 ligands: from discovery to clinical application. Int Immunol. 2007;19:813–824. doi: 10.1093/intimm/dxm057. [DOI] [PubMed] [Google Scholar]
- Park SJ, Namkoong H, Doh J, Choi JC, Yang BG, Park Y, Chul Sung Y. Negative role of inducible PD-1 on survival of activated dendritic cells. J Leukoc Biol. 2014;95:621–629. doi: 10.1189/jlb.0813443. [DOI] [PubMed] [Google Scholar]
- Perez de Sevilla Muller L, Sargoy A, Rodriguez AR, Brecha NC. Melanopsin ganglion cells are the most resistant retinal ganglion cell type to axonal injury in the rat retina. PLoS One. 2014;9:e93274. doi: 10.1371/journal.pone.0093274. [DOI] [PMC free article] [PubMed] [Google Scholar]
- Qu CK. Role of the SHP-2 tyrosine phosphatase in cytokine-induced signaling and cellular response. Biochim Biophys Acta. 2002;1592:297–301. doi: 10.1016/s0167-4889(02)00322-1. [DOI] [PubMed] [Google Scholar]
- Quigley HA, McKinnon SJ, Zack DJ, Pease ME, Kerrigan-Baumrind LA, Kerrigan DF, Mitchell RS. Retrograde axonal transport of BDNF in retinal ganglion cells is blocked by acute IOP elevation in rats. Invest Ophthalmol Vis Sci. 2000;41:3460–3466. [PubMed] [Google Scholar]
- Quigley HA, Sanchez RM, Dunkelberger GR, L'Hernault NL, Baginski TA. Chronic glaucoma selectively damages large optic nerve fibers. Invest Ophthalmol Vis Sci. 1987;28:913–920. [PubMed] [Google Scholar]
- Saunders PA, Hendrycks VR, Lidinsky WA, Woods ML. PD-L2:PD-1 involvement in T cell proliferation, cytokine production, and integrin-mediated adhesion. Eur J Immunol. 2005;35:3561–3569. doi: 10.1002/eji.200526347. [DOI] [PubMed] [Google Scholar]
- Schlamp CL, Johnson EC, Li Y, Morrison JC, Nickells RW. Changes in Thy1 gene expression associated with damaged retinal ganglion cells. Mol Vis. 2001;7:192–201. [PubMed] [Google Scholar]
- Sham CW, Chan AM, Kwong JM, Caprioli J, Nusinowitz S, Chen B, Lee JG, Gandhi NM, Francisco LM, Sharpe AH, Chen L, Braun J, Gordon LK. Neuronal programmed cell death-1 ligand expression regulates retinal ganglion cell number in neonatal and adult mice. J Neuroophthalmol. 2012;32:227–237. doi: 10.1097/WNO.0b013e3182589589. [DOI] [PMC free article] [PubMed] [Google Scholar]
- Sucher NJ, Lipton SA, Dreyer EB. Molecular basis of glutamate toxicity in retinal ganglion cells. Vision Res. 1997;37:3483–3493. doi: 10.1016/S0042-6989(97)00047-3. [DOI] [PubMed] [Google Scholar]
- Tezel G. Oxidative stress in glaucomatous neurodegeneration: mechanisms and consequences. Prog Retin Eye Res. 2006;25:490–513. doi: 10.1016/j.preteyeres.2006.07.003. [DOI] [PMC free article] [PubMed] [Google Scholar]
- Yokosuka T, Takamatsu M, Kobayashi-Imanishi W, Hashimoto-Tane A, Azuma M, Saito T. Programmed cell death 1 forms negative costimulatory microclusters that directly inhibit T cell receptor signaling by recruiting phosphatase SHP2. J Exp Med. 2012;209:1201–1217. doi: 10.1084/jem.20112741. [DOI] [PMC free article] [PubMed] [Google Scholar]
Associated Data
This section collects any data citations, data availability statements, or supplementary materials included in this article.


