Abstract
Purpose
To evaluate the accuracy of R2* models (1/T2* = R2*) for chemical shift-encoded magnetic resonance imaging (CSE-MRI)-based proton density fat-fraction (PDFF) quantification in patients with fatty liver and iron overload, using MR spectroscopy (MRS) as the reference standard.
Materials and Methods
Two Monte Carlo simulations were implemented to compare the root-mean-squared-error (RMSE) performance of single-R2* and dual-R2* correction in a theoretical liver environment with high iron. Fatty liver was defined as hepatic PDFF >5.6% based on MRS; only subjects with fatty liver were considered for analyses involving fat. From a group of 40 patients with known/suspected iron overload, nine patients were identified at 1.5T, and 13 at 3.0T with fatty liver. MRS linewidth measurements were used to estimate R2* values for water and fat peaks. PDFF was measured from CSE-MRI data using single-R2* and dual-R2* correction with magnitude and complex fitting.
Results
Spectroscopy-based R2* analysis demonstrated that the R2* of water and fat remain close in value, both increasing as iron overload increases: linear regression between R2*W and R2*F resulted in slope = 0.95 [0.79–1.12] (95% limits of agreement) at 1.5T and slope = 0.76 [0.49–1.03] at 3.0T. MRI-PDFF using dual-R2* correction had severe artifacts. MRI-PDFF using single-R2* correction had good agreement with MRS-PDFF: Bland–Altman analysis resulted in −0.7% (bias) ± 2.9% (95% limits of agreement) for magnitude-fit and −1.3% ± 4.3% for complex-fit at 1.5T, and −1.5% ± 8.4% for magnitude-fit and −2.2% ± 9.6% for complex-fit at 3.0T.
Conclusion
Single-R2* modeling enables accurate PDFF quantification, even in patients with iron overload.
Abnormal intracellular accumulation of triglycerides in the liver (hepatic steatosis) is the hallmark feature of nonalcoholic fatty liver disease (NAFLD). NAFLD is increasingly common and is estimated to affect up to one-third of the US adult population.1 Closely linked with insulin resistance and the metabolic syndrome, hepatic steatosis is associated with an elevated risk of cirrhosis, liver failure, cardiovascular disease, cancer, and diabetes, among others.2–4
Excessive accumulation of iron in the liver is also relatively common and can occur due to increased intestinal absorption (eg, genetic hemochromatosis) or repeated blood transfusions (eg, transfusional hemosiderosis). Liver iron overload carries increased risk of liver damage and can lead to fibrosis, cirrhosis, and hepatocellular carcinoma if untreated.5,6 Further, diffuse liver disease, including NAFLD, is often associated with abnormal iron regulation, and can lead to iron overload.4 While the complex interplay between excess fat and excess iron is not fully understood, both conditions can occur simultaneously. It is known that up to one-third of patients with NAFLD have increased hepatic iron stores.4,7 The combined effects of fat and iron with regard to liver injury are also not well understood, but emerging evidence suggests that combined fatty liver and iron overload is more harmful than iron overload alone.5
Features of diffuse liver disease including steatosis and iron overload can be assessed by percutaneous liver biopsy; however, biopsy is invasive, painful, and not well-suited for repeated measurements. Magnetic resonance spectroscopy (MRS) is widely regarded as the noninvasive reference standard for proton density fat-fraction (PDFF),1 which is a fundamental property of tissue reflecting tissue triglyceride concentration. MRS requires accurate shimming and placement of the spectroscopy voxel in a reproducible location in the liver without large veins, bile ducts, or focal liver lesions. An important drawback of both biopsy and MRS is that they provide only information about a single localized liver region, and both methods are susceptible to sampling variability.
Whole-liver, spatially resolved measurement of triglyceride content is possible using MRI-based confounder-corrected chemical shift-encoded (CSE) fat quantification techniques.8–12 Recent studies have demonstrated excellent agreement and correlation of CSE fat quantification with MRS, indicating equivalence between these methods for the assessment of liver PDFF.13–15 In order to obtain accurate PDFF quantification, all confounding factors (relevant sources of error) must be addressed. In CSE-based PDFF quantification, these confounders include T1 bias,13,16 B0 inhomogeneity,17 spectral modeling of fat,13,14 eddy currents, 18,19 noise bias,16 and R2* (=1/T2*) correction. 10,11,13,15,20 When all confounding factors have been addressed, CSE-MRI can provide highly accurate, precise, and reproducible estimates of PDFF.21,22
Correction for R2* decay is essential for accurate quantification of fat using CSE-MRI,10 particularly in subjects with iron overload. The presence of iron overload drastically increases the R2* decay rate, due to microscopic B0 field inhomogeneities introduced by the iron deposition, which result in accelerated signal dephasing. Liver tissue with normal iron levels has an average signal decay rate of approximately R2* = 36 s−1 (T2* = 28 msec) at 1.5T,23 while iron overload can easily lead to decay rates of 200 s−1 or greater (ie, T2* of 5 msec or less) at 1.5T.24 Liver fat measurements including R2* correction (but without CSE) have been performed in patients with hepatic iron overload, 25 but their accuracy has not been validated, eg, using spectroscopic fat quantification as a reference.
Importantly, the presence of liver iron has unknown relative effects on water and fat signals, respectively. It is unknown whether the R2* increases affect water and fat independently (“dual-R2*” model), or whether they affect water and fat similarly (“single-R2*” model). Although more general, use of a dual-R2* model is challenging due to the need to estimate one additional nonlinear parameter, and has been shown to lead to algorithm instability and noise amplification, particularly at low fat concentrations. 26,27 A single-R2* model significantly improves the stability and noise performance of signal estimation. Single-R2* correction has been shown to be accurate in livers at normal iron levels,20 but its performance in livers with concomitant iron overload (see Fig. 1) is unknown.
FIGURE 1.
Fatty liver and iron overload can occur concurrently. Accurate measurement of the proton density fat-fraction (PDFF) requires correcting for R2*, which is elevated as a result of the iron overload. (a) The spectrum at 1.5T has linewidths corresponding to R2*W = 159 s−1 and R2*F = 145 s−1, indicating iron overload. Quantification of PDFF from this spectrum resulted in 37%, corresponding to fatty liver. (b) The R2* map from imaging data at 1.5T is 166 s−1 within the rectangular ROI (colocalized to the spectroscopy voxel from (a)). (c) The PDFF map reconstructed from the same imaging source data as in (b) is 37% within the same ROI. Both the R2* map and the PDFF map were reconstructed using the single-R2* signal model (Eq. (2)). The close agreement between imaging PDFF and spectroscopy PDFF indicates that R2* correction of imaging PDFF was done accurately.
Therefore, the purpose of this work is to determine the relationship between R2* of water and fat signal in patients with excess accumulation of both fat and iron in the liver, and to assess the accuracy of R2* signal models for CSE liver fat quantification in the presence of iron overload.
MATERIALS AND METHODS
Signal Models
The proton signal in a voxel within the liver containing both water and fat can be modeled as:
| (1) |
where s is the signal at echo time tn, η is complex Gaussian noise ~N(0,σ2), A/σ is the signal to noise ratio (SNR) of the total proton signal, PDFF is the proton density fat fraction, is the water decay rate, is the fat decay rate (assumed equal for all fat peaks), am are the relative amplitudes such that , fm are the frequencies of an M-peak (eg, M = 6) fat model,28,29 and fB is the field inhomogeneity-related frequency offset. Since the protons of a triglyceride molecule all share the same microscopic magnetic field environment, it is reasonable to assume that individual proton peaks would have very similar R2* signal decay (one R2*F for all fat peaks). This assumption is borne out with experimental in vivo MRS data that show very similar linewidths.30 It is also unknown whether the presence of iron will affect the relative frequency shift between water and fat.
The two species (water and fat) modeled in CSE fat quantification have independent R2* decay rates in isolation, which can be modeled using the “dual-R2*” model of Eq. (1). However, if the signal decay rates of water and fat components are similar, we may assume a common signal decay rate, or “single-R2*” model, ie, R2*W≈R2*F. In that case, the signal model becomes:
| (2) |
where R2* is the common decay rate for both fat and water, and all other variables are the same as in Eq. (1). This signal model has been validated and demonstrated to be highly accurate for fat quantification in numerous studies,8,10,31–35 although this has not yet been shown in patients with iron overload.
Dual-R2* modeling can lead to poor noise performance and signal estimation instability,26 especially in the presence of low concentrations of water or fat, or high R2*W and R2*F. The advantages of single-R2* modeling are lower noise propagation and more stable computation due to one fewer degree of freedom.27
However, if the underlying physics do not match the simplified single-R2* signal model, bias in the estimation of water and fat signals (and therefore PDFF) will occur. For example, Chebrolu et al demonstrated superior accuracy in fat concentration estimation using dual-R2* correction in phantom experiments, compared to single-R2* correction.27 In this work it was found that dual-R2* modeling was more accurate in phantoms (over 0 < R2* < 300 s−1) where the R2* of water and fat were disparate, likely because these phantoms used fat droplet sizes at least a full order of magnitude larger than those encountered in liver fat.27 However, when fat particle size in phantoms was reduced to those seen in vivo using a microfluidizer, R2*W and R2*F were very similar.35
Furthermore, single-R2* modeling has been shown to be accurate in patients without iron overload, ie, R2*W and R2*F are sufficiently close in value that only negligible error arises from assuming they are the same.10,20,33–35 Hines et al36 demonstrated excellent performance for single-R2* correction in an animal model of hepatic steatosis with superimposed iron overload created by injection of exogenous iron.9 Bydder et al and Liau et al demonstrated similar results in patients injected with super-paramagnetic iron oxide (SPIO) particles.37,38 To date, however, there have been no reports of R2*-corrected CSE-MRI in patients with concomitant hepatic steatosis and endogenous iron overload. The relative behavior of R2* in water and fat in patients with high liver iron levels is unknown. Therefore, it is unknown whether the single-R2* model is accurate for fat quantification in the presence of iron overload.
Simulations
In order to compare the theoretical behavior of single-R2* and dual-R2* models for the accuracy of fat quantification, two Monte Carlo simulations were performed. In Monte Carlo simulations, multiple realizations of a signal model are created, in order to examine the ensemble behavior. In order to characterize the bias and noise performance of PDFF estimation at 1.5T and 3.0T, we created multiple realizations of the signal model in Eq. (1), to be fitted twice, using the models from Eqs. (1) and (2). In the first simulation, the relative behavior of dual-R2* and single-R2* at 1.5T was examined over a large range of SNRs (10–100, step size 1) and the full range of PDFF (0–100, step size 1). As defined for Eq. (1), SNR is the signal at “TE = 0” divided by the standard deviation of the noise. Here, R2*W was fixed at 300 s−1 and R2*F was fixed at 250 s−1, as was observed in one of our patient cohort with iron overload (below). In the second simulation, R2*W and R2*F were each ranged independently over 0–800 s−1, in increments of 10 s−1, while PDFF and SNR were held constant at commonly encountered moderate values of 20% and 15, respectively. Note that field inhomogeneity related frequency offset (fB) and initial phase have been set to zero; however, these parameters are estimated in the simulation.
Both simulations were performed for a field strength of 1.5T, with parameters including 1024 Monte Carlo repetitions, TE1 = 0.9 msec, ΔTE = 0.7 msec, and 12 echoes/TR. Additionally, the two simulations were repeated for 3.0T, with the R2* values doubled from those at 1.5T, 1024 Monte Carlo repetitions, TE1 = 0.7 msec, ΔTE = 0.6 msec, and 8 echoes/TR. The echo times at each field strength were chosen to be the imaging TEs used for patients in this work (see Imaging subsection).
At each parameter combination, 1024 realizations of the signal model from Eq. (1) were created; for the first simulation using 101 values of PDFF and 91 values of SNR, there were 9191 parameter combinations. Within each combination, only the specific realization of the complex noise η (see Eq. (1)) varied across the 1024 repetitions. The generated complex signals at each repetition were fit with both complex single-R2* and complex dual-R2* models (Eqs. (1) and (2)): complex fitting was performed with nonlinear least-squares fitting, using a Levenberg–Marquardt algorithm. 39 The results of fitting were a single-R2* corrected PDFF estimate and a dual-R2* corrected PDFF estimate for each of the 1024 repetitions for each parameter combination.
The root mean squared errors (RMSE) (between the estimated PDFF and the true PDFF) were computed at each of the 1024 repetitions of each parameter combination. Single-R2* RMSE was subtracted from dual-R2* RMSE to create RMSE difference plots: positive value indicated that single-R2* correction has better performance than dual-R2* correction. The bias was computed as the average estimated PDFF minus the true PDFF at each parameter combination. The standard deviation of the estimated PDFF was computed for each parameter combination, over its 1024 repetitions. All Monte Carlo calculations were performed in MatLab (MathWorks, Natick MA).
Patient Population
After Institutional Review Board (IRB) approval and obtaining informed written consent, 40 pediatric (age 10+) or adult patients with known or suspected iron overload were recruited for this study. A history of elevated serum ferritin or confirmed hemochromatosis was considered known iron overload, and a history of repeated blood transfusions or suspected hemochromatosis was considered suspected iron overload. Ten normal adult controls with no history of blood transfusions or elevated serum ferritin were recruited for this study.
Spectroscopy
MR-based acquisitions were performed sequentially on the same day at both 1.5T and 3.0T, on a clinical 1.5T scanner (HDx, GE Healthcare, Waukesha, WI) and on a clinical 3.0T scanner (MR750, GE Healthcare). An 8-channel body array was used at 1.5T, while the upper 20 channels of a 32-channel phased array body coil (Neocoil, Pewaukee, WI) were used at 3.0T.
Single-voxel spectroscopy was acquired at 1.5T and 3.0T using a stimulated echo acquisition mode (STEAM) sequence,40 with TR = 3500 msec, TM = 5 msec, and multiple TEs = 10, 15, 20, 25, 30 msec to enable T2 correction. STEAM-MRS was acquired in a single breath-hold of 21 seconds monitored with bellows. Note that the spectroscopy voxels were not colocalized across field strengths, and the PDFFs are not expected to be the same across field strengths due to potential liver heterogeneity. The spectroscopy voxel was prescribed at 30 × 30 × 30 mm3. When large blood vessels or bile ducts could not be avoided with that size, one or more voxel dimensions were decreased from 30 mm to either 25 mm or 20 mm in an additional or alternate acquisition. The voxel was placed in Couinaud segments 6 or 7 in the right lobe of the liver, avoiding the lung base.
Spectroscopy data were processed using custom-written MatLab code to estimate both PDFF and R2*. Automatic PDFF fitting of spectroscopic data in patients with high R2 and R2* is challenging due to peak broadening and increased noise. To avoid fitting noise, spectra without visible fat peaks on the first echo were discarded from the analysis for fatty liver. PDFF was then estimated from the data in a least-squares sense by automatically fitting Voigt lineshapes, using a multipeak fat model, and correcting for T2 decay.41 The fitting error in spectroscopic quantification was computed as the L2 norm of the residual divided by the L2 norm of the signal. In subjects with more than one MRS acquisition, only the acquisition with the lowest fitting error was used for this study. Subsequent to PDFF estimation, the relative frequency offset from water to the main methylene fat peak was also determined.
R2*W,spectro and R2*F,spectro were estimated jointly from all echoes in a least-squares sense from the linewidth of the water peak and the main fat peak respectively, using Lorentzian line shapes. Note that the R2* measured from spectroscopy is not the same as R2* measured from imaging. Since R2* depends on macroscopic B0 field inhomogeneities and thus on voxel size, the large spectroscopy voxels used in this study have been assumed to lead to additional dephasing (higher R2*) compared to the smaller imaging voxels. This additional dephasing would affect water and fat signals in the same voxel equally and would lead to the same increase in R2* values in both species. Specifically, we can model the decay rates observed in spectroscopy as follows:
| (3) |
| (4) |
where R2*F,spectro and R2*W,spectro are the observed fat and water linewidths, respectively, in our STEAM acquisition, R2*F,imaging and R2*W,imaging are the underlying fat decay rate and water decay rate, respectively, in our imaging acquisition, and R2*macro is the common additional observed decay rate due to field inhomogeneities in the large spectroscopy voxel. Therefore, the relative values of the observed linewidths of water and fat signals have been previously used to provide insight to the microscopic contribution to the linewidth from iron overload.20 We tested this assumption by plotting R2*W,spectro against the R2* from complex-fit single-R2* imaging data for all patients.
In order to measure the linewidth of a spectroscopy peak accurately, the amplitude needs to be appreciably large. Therefore, we limited our in vivo analyses involving fat to cases with substantial fat signal. A clinically relevant threshold of PDFF > 5.6% has been previously described,1 which we used as our threshold to identify those patients with fatty liver. Only the imaging data associated with MRS-PDFF > 5.6% were considered for analyses concerning fat.
Imaging
Imaging was performed at both 1.5T and 3.0T using a multiecho 3D spoiled gradient echo sequence.10,35 Acquisition parameters at 1.5T included TE1 = 0.9 msec, ΔTE = 0.7 msec, TR = 11 msec, 6 echoes per TR, 12 total echoes (two interleaved echo trains), matrix = 144 × 128, slice thickness = 8 mm, flip angle = 5°, and receiver bandwidth = ±125 kHz. The echo trains were interleaved to acquire TEs with shorter effective echo spacing. A data-driven parallel imaging algorithm and corner-cutting were used to reduce scan time to a single breath-hold by achieving net acceleration factors of 3.8–4.1.42 Depending on the size of the liver, attaining whole liver coverage dictated that slices range from 22 to 30, making the breath-hold durations range from 19–23 seconds with one case of a 27-second breath-hold.
At 3.0T, acquisition parameters included TE1 = 0.7 msec, ΔTE = 0.6 msec, TR = 6.4 msec, 4 echoes per TR, 8 total echoes (two interleaved echo trains), matrix = 160 × 128, slice thickness = 8 mm, flip angle = 3°, bandwidth = ±125 kHz, parallel imaging acceleration factor of 2.4, slices = 28, and breath-hold duration = 20 seconds.
Using custom code written in MatLab, image data were reconstructed to produce PDFF maps and R2* maps. Reconstructions were performed using both single-R2* and dual-R2* correction, a multipeak fat model,13,30,43 common initial phase for water and fat signals, and using both magnitude and complex fitting models.19 Complex fitting has the advantage of noise performance, while magnitude fitting is unaffected by phase errors44; both fitting types were performed, in order to compare accuracy in the presence of liver iron. Magnitude discrimination was used to avoid noise-related bias in PDFF quantification.16 For direct comparison of imaging with spectroscopy, regions of interest (ROIs) colocalized to the spectroscopy voxel were placed in the imaging PDFF and R2* maps.
Statistical Analysis
To evaluate the relative R2* behavior of water and fat signals from the in vivo data, linear regression was performed between R2*W,Spectro and R2*F,Spectro. To explore the behavior of R2* over all iron levels, a linear regression was performed between R2*W,spectro and R2* from R2* complex fitting to imaging data. To assess whether iron status was associated with any change in the relative frequency of water as compared to fat (the main methylene peak), the water-fat shift from spectroscopy was plotted against the R2* from complex-fit imaging.
Finally, to show the accuracy of R2* modeling for MRI-based fat quantification, Bland–Altman plots were created to compare spectroscopy PDFF and imaging PDFF, for 1.5T and 3.0T.
All statistical calculations were performed in R (R Foundation for Statistical Computing, Vienna, Austria).
Results
Simulations
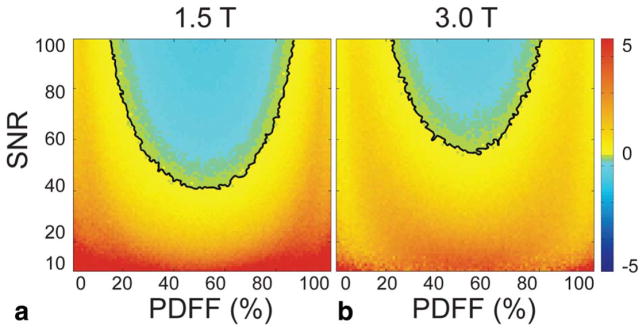
The majority of PDFF-SNR combinations in the RMSE difference plots from the first simulation (see Fig. 2) were positively valued, indicating the single-R2* model has better performance than dual-R2* over most PDFF-SNR combinations tested. The black contour shows the boundary where single-R2* RMSE is equal to dual-R2* RMSE. At 1.5T, the minimum SNR above which dual-R2* modeling becomes preferable over single-R2* is 40. Furthermore, that break point occurs at about PDFF = 50%, a fat concentration that is only rarely encountered clinically in the liver. Over the more common PDFF range of 0–20%, the lowest SNR where dual-R2* modeling becomes preferable is 75, and occurs at PDFF = 20%. This simulation was performed for R2*W fixed at 300 s−1, and R2*F fixed at 250 s−1; Fig. 3 shows the contours for R2*W fixed at 300 s−1 and different values of R2*F. When R2*W and R2*F are very different (R2*F = 100 s−1 or 500 s−1), dual-R2* has lower RMSE (ie, better performance) over most of the space. As R2*W and R2*F become closer in value (R2*F = 250 s−1 to 400 s−1), single-R2* has better performance over most of the space.
FIGURE 2.
Single-R2* correction performs better than dual-R2* correction, based on RMSE of Monte Carlo results, over most of the combinations of PDFF (0–100%) and SNR (10–100). In the plots shown, single-R2* RMSE has been subtracted from dual-R2* RMSE. The black line is the contour where the RMSE from dual-R2* is equal to the RMSE from single-R2*. Below the black line contour, single-R2* has lower RMSE (ie, better performance); above the contour, dual-R2* has lower RMSE. Results are plotted for (a) 1.5T and (b) 3.0T. For all combinations of SNR and PDFF shown, R2*W is fixed at 300 s−1, and R2*F is fixed at 250 s−1.
FIGURE 3.
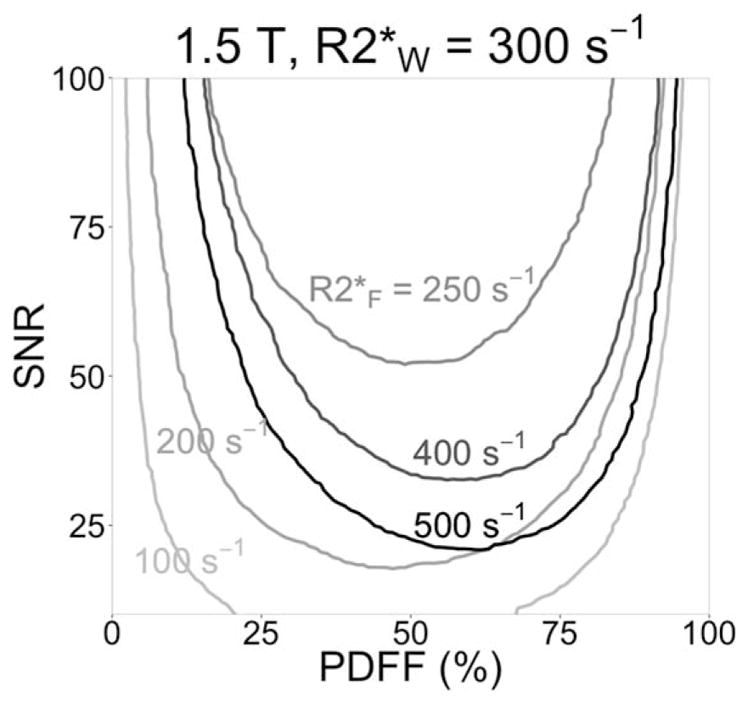
Single-R2* modeling has better RMSE performance than dual-R2* modeling when R2*W and R2*F are close in value, according to our simulations. As in Fig. 2, the contours show where Monte Carlo single-R2* RMSE is equal to dual-R2* RMSE. R2*W is still fixed at 300 s−1, but R2*F is 100, 200, 250, 400, or 500 s−1 (each R2*F contour has a different grayscale). When R2*F = R2*W = 300 s−1, single-R2* has better performance over the whole parameter space shown (ie, the contour is entirely above SNR = 100).
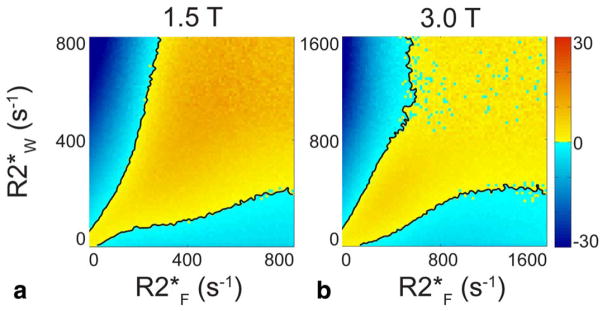
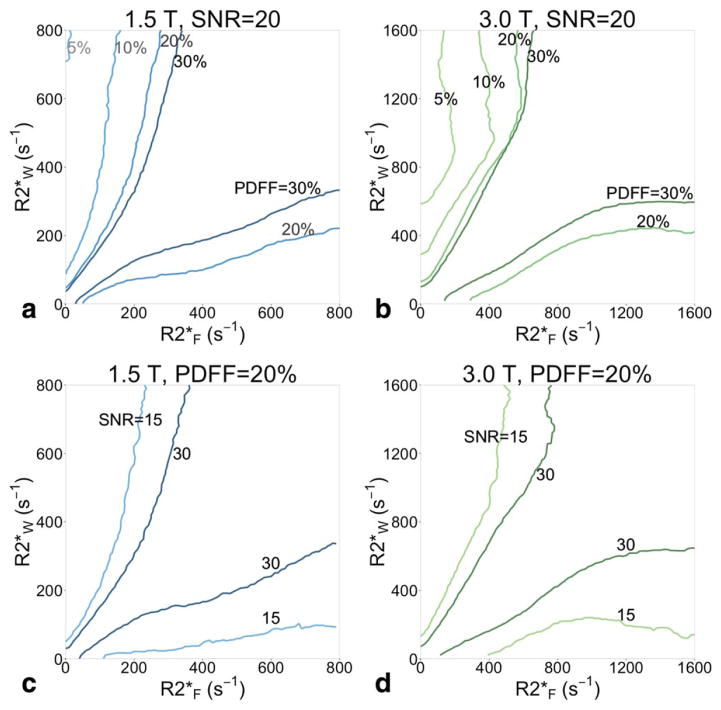
The RMSE in the area between the black contours in Fig. 4 is positively valued, showing the PDFF-SNR combinations where single-R2* outperforms dual-R2*. This plot shows only SNR = 20 and PDFF = 20. As PDFF decreases to 10% and 5% or SNR decreases to 15 (see Fig. 5), the contours grow farther apart and the difference between the RMSEs grows; single-R2* becomes preferable over a larger range of PDFF-SNR combinations. As PDFF increases to 30% or SNR increases to 30, the contours where dual-R2* RMSE = single-R2* RMSE grow closer together, and the difference between the RMSEs shrinks; dual-R2* starts outperforming single-R2* over more parameter combinations.
FIGURE 4.
Single-R2* outperforms dual-R2* for most combinations of R2*F and R2*W in Monte Carlo simulation. The plots show the difference between dual-R2* RMSE and single-R2* RMSE. The black lines are the contours where single-R2* RMSE is equal to dual-R2* RMSE; in the yellow regions between the contours, single-R2* RMSE is lower than dual-R2*. PDFF = 20% and SNR = 20 are fixed values, while R2*W and R2*F independently vary over 0–800 s−1 at 1.5T. RMSE difference is plotted for both (a) 1.5T and (b) 3.0T. At 3.0T, R2*W and R2*F independently vary over 0–1600 s−1, which corresponds to the 0–800 s−1 range at 1.5T. When both R2*F and R2*W are very high, the calculation suffers from high variability as seen in the noisy blue appearance.
FIGURE 5.
Single-R2* is more accurate than dual-R2* in Monte Carlo simulation when R2*F and R2*W are not very different in value, and especially when PDFF or SNR is low. Contours where single-R2* RMSE is equal to dual-R2* RMSE are shown for PDFF = 5, 10, 20, and 30% (all at SNR = 20) for (a) 1.5T, and (b) 3.0T. At low PDFF, the contours are far apart: single-R2* outperforms dual-R2* over most of the combinations of R2*F and R2*W. As PDFF grows, the contours become closer, and the area where single-R2* has better performance shrinks. (c) Increasing the SNR also moves the contours closer together. Contours are shown for SNR = 15 and 30, with PDFF = 20% and field strength of 1.5T and (d) 3.0T.
Patient Population
Out of the 40 patients recruited, one could not be imaged due to body size. Of the 39 patients (27 male, 12 female) imaged, 11 of the patients had suspected or confirmed hemochromatosis, and 28 had a history of repeated blood transfusions. Of the 28 patients with transfusion-related iron overload, 12 had leukemia, five had myelodysplastic syndrome, eight had anemia, and three had lymphoma. The age of the 39 patients was 44 ± 21, 10–78 (mean ± standard deviation, minimum–maximum); the serum ferritin was 1610 ± 1532, 4–7427 ng/mL. The age of the controls (five male, five female) was 40 ± 16, 24–62 years; the serum ferritin was 67 ± 55, 14–150 ng/mL.
Spectroscopy
At 1.5T, one subject was discarded due to loss of imaging data, and one was discarded due to large fat-water swaps in reconstructed imaging data. Subsequently, nine subjects were identified with MRS-PDFF > 5.6%. In those nine subjects, MRS-PDFF = 10.4% ± 9.0% (mean ± standard deviation). At 3.0T, one subject was discarded due to equipment failure, and one subject was discarded due to loss of imaging data; 13 subjects had MRS-PDFF > 5.6%. In those 13 subjects, MRS-PDFF = 14.7% ± 8.2%.
The nine subjects with fatty liver at 1.5T also all had fatty liver at 3.0T, in nearby but not colocalized voxels. Of the four subjects who had fatty liver at 3.0T but not at 1.5T, one had MRS-PDFF = 4.7% at 1.5T, the data were lost in two subjects at 1.5T, and one had no visible fat peak on the first echo at 1.5T.
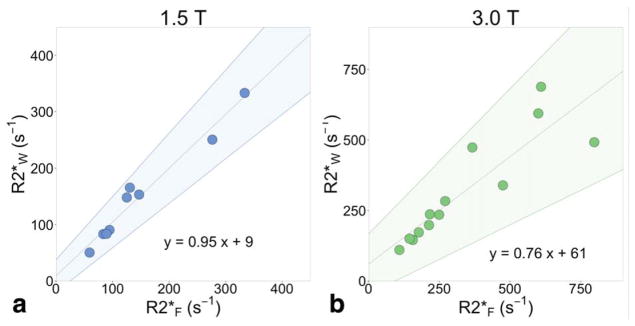
Using the spectroscopy data, we performed an analysis of R2*W,spectro and R2*F,spectro in subjects with fatty liver. Figure 6 plots the measured R2*spectro of water and fat, demonstrating very small differences between these measurements. This difference is larger at higher R2*spectro, and at 3.0T. At 1.5T, the linear regression between R2*W,spectro and R2*F,spectro has a slope of 0.95 (significantly different from 0 with P = 2.8 × 10⁻⁶, not significantly different from 1 with P = 0.53), intercept of 9, and r2 = 0.96; at 3.0T, the linear regression has slope 0.76 (significantly different from 0 with P = 6.6 × 10⁻⁵, not significantly different from 1 with P = 0.07), intercept of 61, and r2 = 0.78.
FIGURE 6.
Water and fat decay rates increase similarly in the presence of increasing liver iron. Spectroscopy R2*F is plotted against spectroscopy R2*W at (a) 1.5T, and at (b) 3.0T. The width of each water and fat (methylene) peak was measured from a two-peak Lorentzian fit to spectroscopy, and converted to s−1. Cases were limited to those with spectroscopy PDFF > 5.6%, and a visible fat peak on the first spectroscopy echo (8 at 1.5T and 13 at 3.0T). The shaded areas signify 95% limits of agreement from the linear regression slope (0.76 to 1.13 at 1.5T, 0.52 to 1.02 at 3.0T) and intercept (−22 to 45 at 1.5T, −43 to 148 at 3.0T).
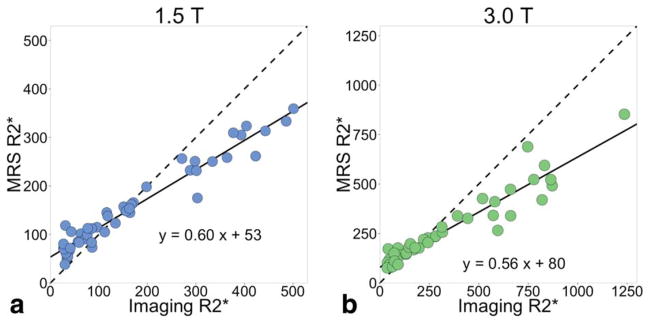
In the high iron patients, the R2*W,spectro was lower than the R2* measured from imaging (Fig. 7). Performing a linear regression between R2*W,spectro and R2*imaging resulted in a slope of 0.60, intercept of 54, and r2 = 0.96 at 1.5T, and slope of 0.56, intercept of 80, and r2 = 0.91 at 3.0T. The slopes less than 1 and intercepts greater than 0 result from R2*W,spectro > R2*imaging at low iron levels and R2*W,spectro < R2*imaging at high iron levels.
FIGURE 7.
Spectroscopy R2* is smaller than imaging R2* at high iron levels. The spectroscopy R2* is measured from the linewidth of the water peak in a two-peak Lorentzian fitting process. The imaging R2* results from single-R2* complex fitting. The solid line is the linear regression and the dashed line is y = x. The slopes from the linear regressions at both field strengths are less than 1 (0.60 at 1.5T and 0.56 at 3.0T). At low iron levels, R2*W,spectro > R2* imaging, while at high iron levels, R2*W,spectro < R2* imaging. (a) At 1.5T, r2 = 0.96, the slope is significantly different from 0 with P < 2 × 10⁻¹⁶; (b) at 3.0T, r2 = 0.91, and the slope is significantly different from 0 with P < 2 × 10⁻¹⁶.
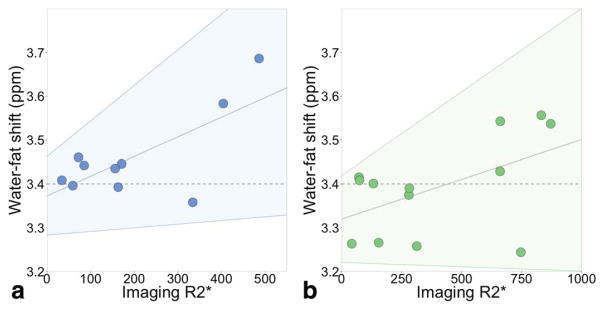
We also tested whether the presence of iron overload could impact the relative chemical shift between the water and fat peaks. There was no detectable correlation (slope not significantly different from 0 with P = 0.07 at both field strengths) between liver R2* (a marker of liver iron) and the relative frequency shift between water and the main methylene fat peak. The goodness-of-fit of the linear regression is small (r2 = 0.45 at 1.5T, r2 = 0.26 at 3.0T): the scatterplots are shown in Fig. 8. The confidence intervals include a slope of 0.
FIGURE 8.
We found no correlation between liver R2* and the relative chemical shift between water and fat. (a) The shift between water and fat (methylene) peaks resulting from the spectroscopy PDFF fitting is plotted against the R2* from imaging (complex fitting) at 1.5T. The horizontal dashed line is 3.4 ppm. The sloped gray line is the linear regression: slope = 4.5 × 10⁻⁴ (not significantly different from 0 with P = 0.07), intercept = 3.36 ppm, r2 = 0.45. The confidence interval (shaded area) includes the dashed line at 3.4 ppm, ie, a slope of 0. (b) At 3.0T, slope = 1.8 × 10⁻⁴ (not significantly different from 0 with P = 0.07), intercept = 3.32 ppm, r2 = 0.26. Again, the confidence interval includes the dashed line at 3.4 ppm.
Imaging
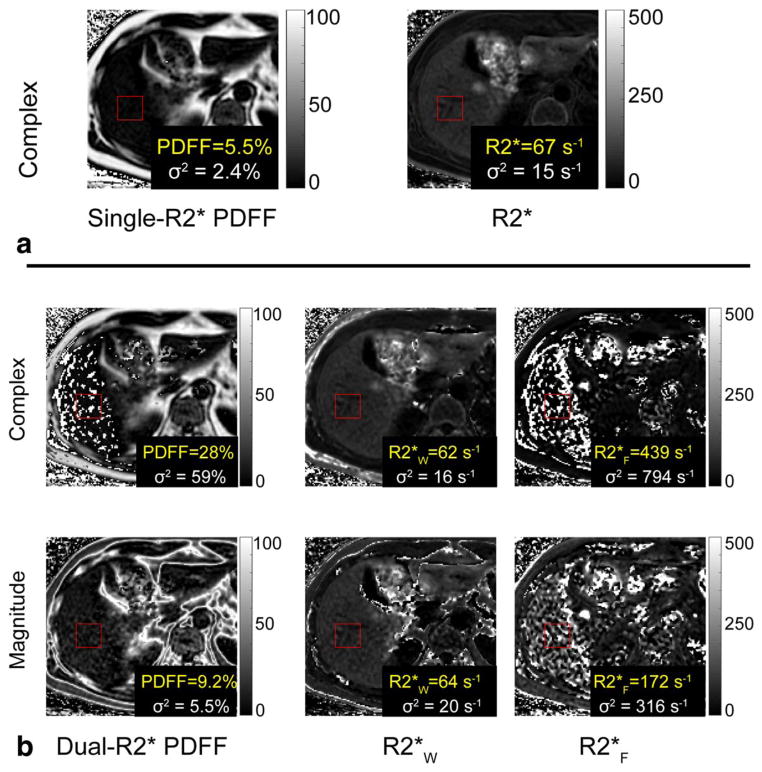
Dual-R2* correction, for both complex and magnitude fits and both field strengths, resulted in PDFF maps that had artifacts and high standard deviations. Figure 9 is a representative example of the poor performance of dual-R2* correction. Due to these results, the dual-R2* corrected PDFFs were not plotted and linear regressions were not performed.
FIGURE 9.
Dual-R2* fitting to in vivo data has artifacts and high standard deviations. All reconstructions shown were performed on the same slice at 1.5T. The red ROI is colocalized with the spectroscopy voxel (spectroscopy FF = 6.3%). (a) Single-R2* correction results in PDFF = 5.5% and R2* = 67s−1. The maps have no noticeable artifacts in the liver. (b) Dual-R2*, for both complex and magnitude fits, results in artifacts and high standard deviations in PDFF, R2*W, and R2*F maps. These measurements were deemed unreliable and further statistical analysis was not performed on the dual-R2* reconstructions.
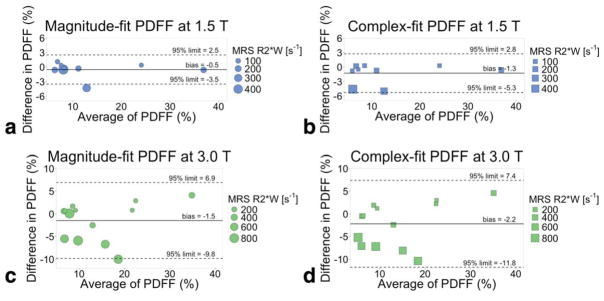
As shown in Fig. 10, Bland–Altman analysis demonstrates good agreement when comparing single-R2* corrected MRI-PDFF to MRS-PDFF in the patients with both liver fat and hepatic iron overload. The Bland–Altman analysis comparing MRS-PDFF and MRI-PDFF at 1.5T results in −0.7 ± 2.9 (bias ± 95% limit of agreement) for magnitude fitting; complex fitting has larger limits at −1.3 ± 4.3. At 3.0T, the Bland–Altman analysis between MRS-PDFF and MRI-PDFF results in −1.5 ± 8.4 for magnitude fitting, and −2.2 ± 9.6 for complex fitting.
FIGURE 10.
Single-R2* corrected PDFF is an accurate measure of PDFF, as compared to the reference standard spectroscopy PDFF. Bland–Altman plots of single-R2* corrected MRI-PDFF and spectroscopy-PDFF at (a,b) 1.5T and (c,d) 3.0T. Magnitude (a,c) and complex fitting (b,d) are shown. The size of the plotted points is scaled based on the width of the spectroscopy water peak in a two-peak Lorentzian fit, to reflect level of iron overload; all points are weighted equally in the Bland–Altman analysis.
Discussion
In this work we demonstrated that the R2* decay rates of water and fat signals in the livers of patients with concomitant hepatic steatosis and iron overload are very similar. This has important implications for CSE-MRI fat quantification, and provides experimental evidence to support the assumption that the single-R2* model accurately reflects the underlying physics. Along with the agreement between in vivo PDFF using single-R2* and colocalized spectroscopy (which was fitted using a signal model more general than the dual-R2* model, and thus is compelling support), our results indicate that single-R2* correction can accurately quantify liver fat, even in the presence of concomitant iron overload.
Measuring the R2* of the fat and water peaks from spectroscopy peaks confirms that the difference between the R2* of fat and water in vivo is small, even with increasing iron concentrations. Combining these results with previous work showing that single-R2* is accurate in patients with normal iron status,20 we conclude that single-R2* is an accurate signal model for liver fat quantification regardless of iron status. Note that in other applications (eg, fat quantification of vertebral bone marrow) dual-R2* or hybrid approaches may be suitable.45 This may be in part due to higher fat concentrations, as predicted by our Monte-Carlo simulations for fat-fractions near 50%. Tissue-specific differences between R2*W and R2*F would also contribute to choice of fit.
The correlation observed in this study between R2* values of water and fat along the normal iron to iron overload continuum may be counterintuitive when considering how much larger fat droplets (sized on the order of hepatocytes at 20 μm46) are than both water molecules at 3A° and iron-storing ferritins at 12 nm.47 Ferritin is the normal iron storage protein in the liver, but as abnormally high amounts of iron accumulate in the liver, some of the ferritin breaks down and forms insoluble, larger hemosiderin agglomerates. 47 Hemosiderin is irregular in size and shape but is found in sizes on the order of 1 μm, and is visible with light microscopy.48 Hemosiderin deposits create significantly more dephasing than ferritin, due to its much larger size and both greater and chemically distinct iron content.49 In iron overload conditions, we speculate that ferritin alone would be insufficient to dephase signal from fat. Rather, in vivo concentrations of liver hemosiderin must be high enough to dephase fat and water signals equally on a macroscopic scale. Other work supports this hypothesis: Ghugre and Wood used a 4:1 ratio of hemosiderin to ferritin in their work,50 while Jensen et al posit that hemosiderin rather than ferritin exerts greater influence on R2* at high iron levels.51 A detailed examination of this effect could be implemented using a Monte Carlo method such as that described by Ghugre et al.50,52
Our observations raise an unexpected question: why patients with high iron concentrations have a spectroscopy R2* smaller than their imaging R2*. According to Eqs. (3) and (4), we had expected the spectroscopy R2* to be larger than the imaging R2*. This disparity only occurred in patients with high iron content, while patients with no iron overload have larger spectroscopy R2* greater than imaging R2*, as we would expect from the larger spectroscopy voxel size. One possible explanation for the discrepancy is that the larger size of the iron-storing particles (hemosiderin) in high iron patients leads to resonance-dependent diffusion weighting; further studies could elucidate the mechanism. Based on our results, Eqs. (3) and (4) must only be valid for patients of normal iron status. In patients with iron overload, the particular relationship between relative spectroscopy R2* values (relative meaning between water and fat) and relative imaging R2* values is still undetermined. Our data show that, contrary to previously suggested models in which only R2*W increases, R2*W and R2*F both increase with increasing iron overload. However, exactly how R2*F increases in relation to R2*W as iron overload increases, and how voxel size affects these measurements, is still a question that requires further investigation.
Our study has several technical limitations. Our spectroscopic analysis of PDFF, R2*W, and R2*F was limited by the accuracy at high R2* that is observed at very high iron levels. The difference between R2*W and R2*F is larger at high R2* than at smaller R2*. It is unclear whether this is related to noise performance or whether this represents a real difference between R2*W and R2*F.
Another limitation of this work was the use of standard “short” echo times, ie, we did not use ultrashort echo time imaging techniques. Decreasing the echo time while maintaining whole liver coverage in one breath-hold is challenging but could be implemented with non-Cartesian strategies such as radial acquisitions. Shorter echo times would potentially yield more signal and might have overcome some of the SNR limitations at high iron concentration seen in our Monte Carlo simulations, although short-decay signal components may introduce a new confounder of PDFF.53
Using simulations, we have shown that the use of dual-R2* decay models, while more general, leads to signal estimation instability and worsening of noise performance for fat quantification in the liver. The dual-R2* corrected PDFF in patients with high iron overload were highly inaccurate (negatively valued) and unstable (high standard deviations) due to low noise performance. Due to the inaccuracy of dual-R2* corrected PDFF, we considered R2*W and R2*F from a dual-R2* reconstruction to be inaccurate as well, and did not compute those values for our analysis.
Study design limitations include a small number of patients and limited external validation. Since the 40 patients were recruited for iron overload, not fatty liver disease, only a small number of subjects had fatty liver (9 at 1.5T, 13 at 3.0T) and were able to be counted in our PDFF analysis. Biopsy for validation was considered too risky in this patient population. Serum ferritin was used to assess iron overload, but is known to be confounded by factors such as inflammation. In this study, we used R2* as an imaging measure of iron overload. R2* is often used as a proxy measure of iron overload, but may also be affected by factors such as fibrosis.54,55 However, the dephasing effects of iron dominate R2* in vivo, particularly at higher iron levels.56
In conclusion, this work has demonstrated that the signal decay rate of water and fat signals in the liver are very similar, even in the presence of iron overload. This demonstrates that single-R2* model used by CSE-MRI methods to estimate PDFF is an accurate means to provide confounder-corrected liver fat quantification, even in patients with hepatic iron overload.
Acknowledgments
Contract grant sponsor: National Institutes of Health (NIH); contract grant numbers: R01 DK083380, R01 DK088925, and UL1TR000427; Contract grant sponsor: Wisconsin Alumni Research Foundation (WARF) Accelerator Program.
We thank GE Healthcare for research support.
References
- 1.Szczepaniak LS, Nurenberg P, Leonard D, et al. Magnetic resonance spectroscopy to measure hepatic triglyceride content: prevalence of hepatic steatosis in the general population. Am J Physiol Endocrinol Metab. 2005;288:E462–E468. doi: 10.1152/ajpendo.00064.2004. [DOI] [PubMed] [Google Scholar]
- 2.Puchner SB, Lu MT, Mayrhofer T, et al. High-risk coronary plaque at coronary CT angiography is associated with nonalcoholic fatty liver disease, independent of coronary plaque and stenosis burden: results from the ROMICAT II trial. Radiology. 2015;274:693–701. doi: 10.1148/radiol.14140933. [DOI] [PMC free article] [PubMed] [Google Scholar]
- 3.Hashimoto E, Tokushige K. Prevalence, gender, ethnic variations, and prognosis of NASH. J Gastroenterol. 2011;46(Suppl 1):63–69. doi: 10.1007/s00535-010-0311-8. [DOI] [PubMed] [Google Scholar]
- 4.Dongiovanni P, Fracanzani AL, Fargion S, Valenti L. Iron in fatty liver and in the metabolic syndrome: a promising therapeutic target. J Hepatol. 2011;55:920–932. doi: 10.1016/j.jhep.2011.05.008. [DOI] [PubMed] [Google Scholar]
- 5.Yokoo T, Browning JD. Fat and iron quantification in the liver: past, present, and future. Top Magn Reson Imaging. 2014;23:129–150. doi: 10.1097/RMR.0000000000000016. [DOI] [PubMed] [Google Scholar]
- 6.Batts KP. Iron overload syndromes and the liver. Mod Pathol. 2007;20(Suppl 1):S31–39. doi: 10.1038/modpathol.3800715. [DOI] [PubMed] [Google Scholar]
- 7.Aigner E, Weiss G, Datz C. Dysregulation of iron and copper homeostasis in nonalcoholic fatty liver. World J Hepatol. 2015;7:177–188. doi: 10.4254/wjh.v7.i2.177. [DOI] [PMC free article] [PubMed] [Google Scholar]
- 8.Rehm JL, Wolfgram PM, Hernando D, Eickhoff JC, Allen DB, Reeder SB. Proton density fat-fraction is an accurate biomarker of hepatic steatosis in adolescent girls and young women. Eur Radiol. 2015;25:2921–2930. doi: 10.1007/s00330-015-3724-1. [DOI] [PMC free article] [PubMed] [Google Scholar]
- 9.Hines CD, Agni R, Roen C, et al. Validation of MRI biomarkers of hepatic steatosis in the presence of iron overload in the ob/ob mouse. J Magn Reson Imaging. 2012;35:844–851. doi: 10.1002/jmri.22890. [DOI] [PMC free article] [PubMed] [Google Scholar]
- 10.Meisamy S, Hines CD, Hamilton G, et al. Quantification of hepatic steatosis with T1-independent, T2-corrected MR imaging with spectral modeling of fat: blinded comparison with MR spectroscopy. Radiology. 2011;258:767–775. doi: 10.1148/radiol.10100708. [DOI] [PMC free article] [PubMed] [Google Scholar]
- 11.Kühn JP, Hernando D, Mensel B, et al. Quantitative chemical shift-encoded MRI is an accurate method to quantify hepatic steatosis. J Magn Reson Imaging. 2014;39:1494–1501. doi: 10.1002/jmri.24289. [DOI] [PMC free article] [PubMed] [Google Scholar]
- 12.Reeder SB, Sirlin CB. Quantification of liver fat with magnetic resonance imaging. Magn Reson Imaging Clin N Am. 2010;18:337–357. ix. doi: 10.1016/j.mric.2010.08.013. [DOI] [PMC free article] [PubMed] [Google Scholar]
- 13.Bydder M, Yokoo T, Hamilton G, et al. Relaxation effects in the quantification of fat using gradient echo imaging. Magn Reson Imaging. 2008;26:347–359. doi: 10.1016/j.mri.2007.08.012. [DOI] [PMC free article] [PubMed] [Google Scholar]
- 14.Yu H, Shimakawa A, McKenzie CA, Brodsky E, Brittain JH, Reeder SB. Multiecho water-fat separation and simultaneous R2* estimation with multifrequency fat spectrum modeling. Magn Reson Med. 2008;60:1122–1134. doi: 10.1002/mrm.21737. [DOI] [PMC free article] [PubMed] [Google Scholar]
- 15.Yu H, McKenzie CA, Shimakawa A, et al. Multiecho reconstruction for simultaneous water-fat decomposition and T2* estimation. J Magn Reson Imaging. 2007;26:1153–1161. doi: 10.1002/jmri.21090. [DOI] [PubMed] [Google Scholar]
- 16.Liu C, McKenzie CA, Yu H, Brittain JH, Reeder SB. Fat quantification with IDEAL gradient echo imaging: Correction of bias from T1 and noise. Magn Reson Med. 2007;58:354–364. doi: 10.1002/mrm.21301. [DOI] [PubMed] [Google Scholar]
- 17.Glover GH, Schneider E. Three-point Dixon technique for true water/fat decomposition with B0 inhomogeneity correction. Magn Reson Med. 1991;18:371–383. doi: 10.1002/mrm.1910180211. [DOI] [PubMed] [Google Scholar]
- 18.Yu H, Shimakawa A, Hines CD, et al. Combination of complex-based and magnitude-based multiecho water-fat separation for accurate quantification of fat-fraction. Magn Reson Med. 2011;66:199–206. doi: 10.1002/mrm.22840. [DOI] [PMC free article] [PubMed] [Google Scholar]
- 19.Hernando D, Hines CDG, Yu H, Reeder SB. Addressing phase errors in fat-water imaging using a mixed magnitude/complex fitting method. Magn Reson Med. 2011;67:638–644. doi: 10.1002/mrm.23044. [DOI] [PMC free article] [PubMed] [Google Scholar]
- 20.Horng DE, Hernando D, Hines CD, Reeder SB. Comparison of R2* correction methods for accurate fat quantification in fatty liver. J Magn Reson Imaging. 2013;37:414–422. doi: 10.1002/jmri.23835. [DOI] [PMC free article] [PubMed] [Google Scholar]
- 21.Reeder SB, Cruite I, Hamilton G, Sirlin CB. Quantitative assessment of liver fat with magnetic resonance imaging and spectroscopy. J Magn Reson Imaging. 2011;34:729–749. doi: 10.1002/jmri.22580. [DOI] [PMC free article] [PubMed] [Google Scholar]
- 22.Reeder SB, Hu HH, Sirlin CB. Proton density fat-fraction: A standardized mr-based biomarker of tissue fat concentration. J Magn Reson Imaging. 2012;36:1011–1014. doi: 10.1002/jmri.23741. [DOI] [PMC free article] [PubMed] [Google Scholar]
- 23.Schwenzer NF, Machann J, Haap MM, et al. T2* relaxometry in liver, pancreas, spleen in a healthy cohort of one hundred twenty-nine subjects— correlation with age, gender, and serum ferritin. Invest Radiol. 2008;43:854–860. doi: 10.1097/RLI.0b013e3181862413. [DOI] [PubMed] [Google Scholar]
- 24.Wood JC, Enriquez C, Ghugre N, et al. MRI R2 and R2* mapping accurately estimates hepatic iron concentration in transfusion-dependent thalassemia and sickle cell disease patients. Blood. 2005;106:1460–1465. doi: 10.1182/blood-2004-10-3982. [DOI] [PMC free article] [PubMed] [Google Scholar]
- 25.Henninger B, Kremser C, Rauch S, et al. Evaluation of liver fat in the presence of iron with MRI using T2* correction: a clinical approach. Eur Radiol. 2013;23:1643–1649. doi: 10.1007/s00330-012-2745-2. [DOI] [PubMed] [Google Scholar]
- 26.Reeder SB, Bice EK, Yu H, Hernando D, Pineda AR. On the performance of T2* correction methods for quantification of hepatic fat content. Magn Reson Med. 2012;67:389–404. doi: 10.1002/mrm.23016. [DOI] [PMC free article] [PubMed] [Google Scholar]
- 27.Chebrolu VV, Hines CD, Yu H, et al. Independent estimation of T*2 for water and fat for improved accuracy of fat quantification. Magn Reson Med. 2010;63:849–857. doi: 10.1002/mrm.22300. [DOI] [PMC free article] [PubMed] [Google Scholar]
- 28.Hamilton G, Yokoo T, Bydder M, et al. In vivo characterization of the liver fat (1)H MR spectrum. NMR Biomed. 2012;24:784–790. doi: 10.1002/nbm.1622. [DOI] [PMC free article] [PubMed] [Google Scholar]
- 29.Wang X, Hernando D, Reeder SB. Sensitivity of chemical shift-encoded fat quantification to calibration of fat MR spectrum. Magn Reson Med. 2016;75:845–851. doi: 10.1002/mrm.25681. [DOI] [PMC free article] [PubMed] [Google Scholar]
- 30.Hamilton G, Yokoo T, Bydder M, et al. In vivo characterization of the liver fat 1H MR spectrum. NMR Biomed. 2011;24:784–790. doi: 10.1002/nbm.1622. [DOI] [PMC free article] [PubMed] [Google Scholar]
- 31.Artz NS, Haufe WM, Hooker CA, et al. Reproducibility of MR-based liver fat quantification across field strength: Same-day comparison between 1. 5T and 3T in obese subjects. J Magn Reson Imaging. 2015;42:811–817. doi: 10.1002/jmri.24842. [DOI] [PMC free article] [PubMed] [Google Scholar]
- 32.Zhong X, Nickel MD, Kannengiesser SA, Dale BM, Kiefer B, Bashir MR. Liver fat quantification using a multi-step adaptive fitting approach with multi-echo GRE imaging. Magn Reson Med. 2014;72:1353–1365. doi: 10.1002/mrm.25054. [DOI] [PubMed] [Google Scholar]
- 33.Yokoo T, Shiehmorteza M, Hamilton G, et al. Estimation of hepatic proton-density fat fraction by using MR imaging at 3. 0 T. Radiology. 2011;258:749–759. doi: 10.1148/radiol.10100659. [DOI] [PMC free article] [PubMed] [Google Scholar]
- 34.Yokoo T, Bydder M, Hamilton G, et al. Nonalcoholic fatty liver disease: diagnostic and fat-grading accuracy of low-flip-angle multiecho gradient-recalled-echo MR imaging at 1. 5 T. Radiology. 2009;251:67–76. doi: 10.1148/radiol.2511080666. [DOI] [PMC free article] [PubMed] [Google Scholar]
- 35.Hines CD, Frydrychowicz A, Hamilton G, et al. T(1) independent, T(2) (*) corrected chemical shift based fat-water separation with multi-peak fat spectral modeling is an accurate and precise measure of hepatic steatosis. J Magn Reson Imaging. 2011;33:873–881. doi: 10.1002/jmri.22514. [DOI] [PMC free article] [PubMed] [Google Scholar]
- 36.Hines CD, Roen C, Hernando D, Reeder SB. Effects of fat particle size on R2* in fat-water-SPIO emulsion phantoms: implications for fat quantification with phantoms. Proc 19th Annual Meeting ISMRM; Montreal. 2011. p. 4514. [Google Scholar]
- 37.Bydder M, Shiehmorteza M, Yokoo T, et al. Assessment of liver fat quantification in the presence of iron. Magn Reson Imaging. 2010;28:767–776. doi: 10.1016/j.mri.2010.03.017. [DOI] [PMC free article] [PubMed] [Google Scholar]
- 38.Liau J, Shiehmorteza M, Girard OM, Sirlin CB, Bydder M. Evaluation of MRI fat fraction in the liver and spine pre and post SPIO infusion. Magn Reson Imaging. 2013;31:1012–1016. doi: 10.1016/j.mri.2013.01.016. [DOI] [PMC free article] [PubMed] [Google Scholar]
- 39.Hernando D, Kramer JH, Reeder SB. Multipeak fat-corrected complex R2* relaxometry: theory, optimization, and clinical validation. Magn Reson Med. 2013;70:1319–1331. doi: 10.1002/mrm.24593. [DOI] [PMC free article] [PubMed] [Google Scholar]
- 40.Hamilton G, Middleton MS, Bydder M, et al. Effect of PRESS and STEAM sequences on magnetic resonance spectroscopic liver fat quantification. J Magn Reson Imaging. 2009;30:145–152. doi: 10.1002/jmri.21809. [DOI] [PMC free article] [PubMed] [Google Scholar]
- 41.Hernando D, Artz NS, Hamilton G, Roldan A, Reeder SB. Fully automated processing of multi-echo spectroscopy data for liver fat quantification. Proc 22nd Annual Meeting ISMRM; Milan. 2014. p. 2884. [Google Scholar]
- 42.Brau AC, Beatty PJ, Skare S, Bammer R. Comparison of reconstruction accuracy and efficiency among autocalibrating data-driven parallel imaging methods. Magn Reson Med. 2008;59:382–395. doi: 10.1002/mrm.21481. [DOI] [PMC free article] [PubMed] [Google Scholar]
- 43.Kühn JP, Hernando D, Muñoz del Rio A, et al. Effect of multipeak spectral modeling of fat for liver iron and fat quantification: correlation of biopsy with MR imaging results. Radiology. 2012;265:133–142. doi: 10.1148/radiol.12112520. [DOI] [PMC free article] [PubMed] [Google Scholar]
- 44.Hernando D, Liang Z, Kellman P. Chemical shift-based water/fat separation: A comparison of signal models. Magn Reson Med. 2010;64:811–822. doi: 10.1002/mrm.22455. [DOI] [PMC free article] [PubMed] [Google Scholar]
- 45.Karampinos DC, Ruschke S, Dieckmeyer M, et al. Modeling of T2* decay in vertebral bone marrow fat quantification. NMR Biomed. 2015;28:1535–1542. doi: 10.1002/nbm.3420. [DOI] [PubMed] [Google Scholar]
- 46.Tanikawa K, Eguchi T, Ikejiri N. Ultrastructural aspects of the liver and its disorders. Tokyo, New York: Igaku-Shoin; 1979. [Google Scholar]
- 47.Theil EC. Ferritin: the protein nanocage and iron biomineral in health and in disease. Inorg Chem. 2013;52:12223–12233. doi: 10.1021/ic400484n. [DOI] [PMC free article] [PubMed] [Google Scholar]
- 48.Ghugre NR. Calibration of iron-mediated MRI relaxation by Monte Carlo modeling. Ann Arbor, MI: ProQuest; 2008. [Google Scholar]
- 49.Harrison PM, Arosio P. The ferritins: molecular properties, iron storage function and cellular regulation. Biochim Biophys Acta. 1996;1275:161–203. doi: 10.1016/0005-2728(96)00022-9. [DOI] [PubMed] [Google Scholar]
- 50.Ghugre NR, Wood JC. Relaxivity-iron calibration in hepatic iron overload: probing underlying biophysical mechanisms using a Monte Carlo model. Magn Reson Med. 2010;65:837–847. doi: 10.1002/mrm.22657. [DOI] [PMC free article] [PubMed] [Google Scholar]
- 51.Jensen JH, Tang H, Tosti CL, Swaminathan SV, Nunez A, Hultman K, Szulc KU, Wu EX, Kim D, Sheth S, Brown TR, Brittenham GM. Separate MRI quantification of dispersed (ferritin-like) and aggregated (hemosiderin-like) storage iron. Magn Reson Med. 2010;63:1201–1209. doi: 10.1002/mrm.22273. [DOI] [PMC free article] [PubMed] [Google Scholar]
- 52.Ghugre NR, Doyle EK, Storey P, Wood JC. Relaxivity-iron calibration in hepatic iron overload: Predictions of a Monte Carlo model. Magn Reson Med. 2015;74:879–883. doi: 10.1002/mrm.25459. [DOI] [PMC free article] [PubMed] [Google Scholar]
- 53.Hernando D, Motosugi U, Reeder SB. Bias in liver fat quantification using chemical shift-encoded techniques with short echo times. Proc 23rd Annual Meeting ISMRM; Toronto. 2015. p. 337. [Google Scholar]
- 54.Wood JC. Magnetic resonance imaging measurement of iron overload. Curr Opin Hematol. 2007;14:183–190. doi: 10.1097/MOH.0b013e3280d2b76b. [DOI] [PMC free article] [PubMed] [Google Scholar]
- 55.Alexopoulou E, Stripeli F, Baras P, et al. R2 relaxometry with MRI for the quantification of tissue iron overload in beta-thalassemic patients. J Magn Reson Imaging. 2006;23:163–170. doi: 10.1002/jmri.20489. [DOI] [PubMed] [Google Scholar]
- 56.Tang H, Jensen JH, Sammet CL, et al. MR characterization of hepatic storage iron in transfusional iron overload. J Magn Reson Imaging. 2014;39:307–316. doi: 10.1002/jmri.24171. [DOI] [PMC free article] [PubMed] [Google Scholar]


