

Abstract
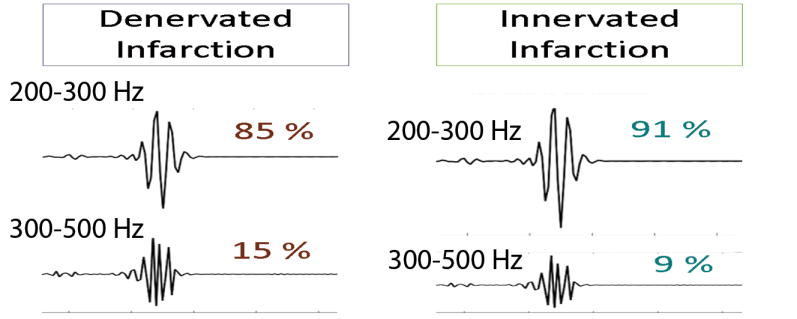
Denervated post-infarct scar is arrhythmogenic. Our aim was to compare QRS frequency content in denervated and innervated left ventricular (LV) scar. In-vivo single lead ECG telemetry device was implanted in 17 heterozygous PTPσ (HET) and 7 lacking PTPσ (KO) transgenic mice. Myocardial infarction (MI) with reperfusion and sham surgery was performed. HET mice developed a denervated scar, whereas KO mice developed innervated scar. The power spectral density was used to assess the QRS frequency content. Denervated as compared to innervated post-MI scar was characterized by the higher relative contribution of 300–500Hz (14±1 vs. 9±1%; P=0.001) but reduced relative contribution of 200–300 Hz (86±1 vs. 91±1%; P=0.001). Norepinephrine concentration in peri-infarct zone correlated with both 1–200 Hz (r=0.75; p=0.03) and 200–500 Hz QRS power (r=0.73;P=0.04). Sympathetic fiber density within the infarct correlated with 200–300/200–500 Hz QRS power ratio (r=0.56;P=0.005). Intracellular sigma peptide injections in post-MI HET mice restored the QRS power.
Keywords: sympathetic nervous system, post-myocardial infarction scar, electrocardiogram
Graphical abstract
Introduction
Myocardial scar from prior myocardial infarction (MI) is the most common substrate for sustained monomorphic ventricular tachycardia (VT) in patients with coronary heart disease (CHD). Moreover, the scar is frequently present in patients with reentrant VTs and nonischemic cardiomyopathies (e.g. idiopathic dilated cardiomyopathy, hypertrophic cardiomyopathy, infiltrative heart disease, arrhythmogenic right ventricular dysplasia, and after repair of congenital or valvular heart disease). The presence of post-MI scar is associated with increased risk of sudden cardiac death (SCD)[1]. Altered sympathetic neurotransmission in the ventricles of the heart plays a critical role in the onset of ventricular tachyarrhythmias [2]. Following MI, development of a myocardial scar is associated with heterogeneity of sympathetic transmission across the left ventricle (LV). Infarct zone is denervated [3], which leads to beta-adrenergic receptor (β-AR) agonist supersensitivity, local areas of hyperinnervation around the scar due to new sympathetic fibers sprouting, which is characterized by low norepinephrine (NE) content, and a compensatory increase in extracellular NE [4]. Post-MI sympathetic denervation assessed with 123-iodine metaiodobenzylguanidine imaging is independently associated with the risk of ventricular tachyarrhythmias and sudden cardiac death [5]. Thus, assessment of the presence and degree of sympathetic denervation in the ventricles of the heart is important for accurate risk stratification of SCD. However, positron emission tomography has limitations: it requires a radioactive component, is expensive, and available in only limited number of centers.
Recently, a novel pharmacological intervention, capable of innervating the scar, was reported [6]. The absence of the neuronal protein tyrosine phosphatase receptor σ (PTPσ) or pharmacologic modulation of PTPσ by the intracellular sigma peptide (ISP) has been shown to preserve or restore sympathetic innervation in the post-MI scar [6]. In future clinical trials, noninvasive monitoring of the innervation scar effectiveness will become important.
Electrocardiography (ECG) is a safe, inexpensive, and widely available tool. Heart rate variability (HRV), QT variability (QTV), and T-wave alternans (TWA) are frequently used to characterize the function of the cardiac autonomic nervous system. Previously it was shown [7–10] that MI changes ventricular conduction properties and causes a reduction in the root-meansquare voltage of high frequencies in the QRS on ECG. We hypothesized that frequency characteristics of ventricular conduction on surface ECG correlate with spectral nerve density and norepinephrine concentration in infarcted LV.
Methods
We analyzed ECG data from 24 mice from a previous experimental study [6]. Methods and results of the experiment were previously fully reported by Gardner et al [6]. All experimental procedures were approved by the OHSU Institutional Animal Care and Use Committee and complied with the Guide for the Care and Use of Laboratory Animals.
Animals and experiments
The study population included 24 age- and sex-matched 12–18-week old PTPσ transgenic mice. All mice from the original experiment [6] were included in this study, without exclusion.
In the first set of experiments (n=16), heterozygous PTPσ+/− (HET, n=9) littermates were used as controls for homozygous PTPσ−/− (KO, n=7) mice. In ischemia-reperfusion group (n=8) the left anterior descending coronary artery was tied up reversibly for 30 minutes and then reperfused by the release of the ligature [11]. Sham surgery group included eight mice. ECG recording was performed after healing of MI, ten days after surgery, in conscious ambulated mice. Control HET mice developed denervated post-MI scar. Experimental KO mice were characterized by the absence of PTPσ, which caused full innervation of the cardiac scar by the sympathetic axons.
In the second set of experiments (n=8), heterozygous PTPσ+/− (HET, n=8) mice underwent ischemia-reperfusion surgery with a 45-minute occlusion, and developed a denervated scar. Then, starting from the 3rd-day post-MI, mice received daily intraperitoneal injections of intracellular sigma peptide (ISP; 10 mmol; 44 mg; n=4), or control vehicle (5% dimethyl sulfoxide/Saline; n=4). The experiment showed that ISP injections restored sympathetic nerve density and normalized NE levels across the LV by two weeks after MI [6].
Direct quantitative assessment of the sympathetic nerve density in left ventricle
Tyrosine hydroxylase staining was quantified to assess sympathetic nerve density in the infarct, proximal and distal peri-infarct zone. Fibrinogen staining was quantified to assess infarct size. NE level in heart tissue was measured using high-performance liquid chromatography with electrochemical detection.
ECG recording and analysis
At least five days before surgery, an ECC transmitter was implanted subcutaneously in a lead II configuration. An ETA-F10 (Data Science International, New Brighton, MN, USA) ECG telemetry transmitter was used to record the single lead ECG continuously at 1 kHz sampling rate with input voltage range of ±2.5 mV and a channel bandwidth of 1 to 200 Hz (a low order filter). In this study, we analyzed three-minute ECG recordings obtained 10–14 days after MI or sham surgery, in conscious ambulated mice, free (after complete wash-out) from any pharmacological intervention. Based on the number of beats 3-minute mice ECG recording is approximately equivalent to 30-minute human ECG recording. We selected for analysis ECG recordings with 100% consecutive normal (N) sinus beats. ECG recordings with ectopic beats were excluded. All ECG recordings were manually reviewed using the custom MATLAB (MathWorks, Inc., Natick, MA) viewer, and beats origin was verified by investigators (GS, EG, MK, LGT). Custom written computer software developed under MATLAB (MathWorks, Inc., Natick, MA) was used for the analysis. Fiducial points were detected automatically. Appropriate selection of fiducial points was confirmed by investigators (GS, EG, MK) with the aid of a graphical display.
ECG analysis: Heart rate dynamics
We measured time domain HRV parameters: standard deviation (SD) of all normal NN intervals (SDNN), and root mean square of the successive differences (rMSSD) between NN intervals. In addition, Poincaré plot analysis was performed: short-axis (SD1) to long-axis (SD2) ratio was calculated.
ECG analysis of repolarization: QTc, QT variability, and T-wave alternans
In order to correct QT interval for heart rate, we utilized a QT interval correction equation specific to mice developed by Mitchell et al. [12]: QTc = QT/(RR/100)1/2.
Due to poorly defined repolarization phase in the murine surface ECG [13], we utilized the template approach [14] to measure beat-to-beat QTV. One investigator (GS) manually defined QT interval on the template beat, placing T-end marker at the presumed end of repolarization. Then algorithm automatically stretched or compressed each ST-T segment, measuring relative ST-T segment changes. Normalized QT-interval variance (QTVN) and QT variability index (QTVI) were calculated as previously described [14].
Modified moving average and correlation methods were used to measure TWA, as previously described [15].
Assessment of ventricular conduction frequency composition
As mouse and human ECG morphologies differ from one another [16], and it is unknown which ECG segment on the mouse ECG best reflects the human QRS complex, we measured the frequency composition of the following two segments reflecting ventricular conduction (Figure 1): (1) QRSJpeak measured from QRS onset to peak of J-wave; (2) QRSJend measured from QRS onset to end of J wave. The power spectral density (PSD) was measured on the median beat of the ECG signal [17] using a non-parametric Fast-Fourier transform algorithm based on the Welch-Bartlett power estimation method [18], with a Hanning window of length ten samples and a 50% overlap between segments. In order to explore the distribution of power over different bands of frequency, the available frequency range of 0 to 500Hz (Nyquist frequency) was divided into ten subsets of 50Hz frequency intervals. The relative contribution of high frequencies was quantified over the frequency range of 200–500Hz. In addition, the PSD across the whole frequency range was plotted and studied as a continuous variable.
Figure 1.

A representative example of mouse ECG with detected fiducial points: QRS onset, J-peak, J-end, and T-end.
To control for noise, measurements of the PSD and root-mean-square (RMS) voltage of the baseline segment of ECG signal (from the end of T-wave to the beginning of QRS complex) was performed [19]. The noise was measured as the RMS voltage of the ECG segment from Tend to the beginning of QRS complex. Signal-to-noise ratio [20] was calculated for QRST segment (from the beginning of QRS complex to the end of T wave) on the median beat.
Comparison of QRS frequency composition in mice vs. human
To compare ECG frequency composition in mice and human, we compared our data with previously reported data by Franke et al.[21]. The entire median beat was taken into analysis. ECG frequency composition was expressed as the power ratio of the spectral power in the respective band to the power of 0–60 Hz band [21] in both datasets. Franke et al.[21] reported individual data for 27 healthy young subjects (male college freshmen), which we compared with the similarly expressed data of wild-type HET mice from the control sham group (N=5).
Comparison of power spectral density before and after experimental interventions
In order to compare PSD before and after experimental interventions, we performed analysis of ECG, recorded before any experimental interventions (either ischemia-reperfusion, or sham operation). Baseline ECG was analyzed as described above.
Statistical analysis
Statistical analysis was performed using Stata 14 (StataCorp, College Station, TX). All continuous variables are presented as mean ± standard deviation (SD). Due to a small sample size of the experiment, nonparametric Wilcoxon rank-sum test was used to compare study groups. P-values less than 0.05 were considered significant. In order to appropriately account for the correlations induced by the clustered data structure (PSD measured at different frequencies), we constructed multilevel mixed regression models to determine the strength of associations of the PSD with study comparison group (sham vs. MI; KO vs. HET; ISP vs. vehicle). The relative contribution of very high (300–500 Hz) and high (200–300 Hz) frequencies was calculated as a power ratio to the 200–500 Hz band power. Pearson correlation coefficients were calculated to quantify correlations between the sympathetic TH+ fiber density within the infarct, norepinephrine tissue level, and QRS power measures. To compare human and mice ECG frequency composition, two-sample t-test with unequal variances assumption was used. Paired t-test was performed to compare PSD before and after experimental interventions in study groups.
Results
Study population characteristics
The study population consisted of all the 24 mice from the original study [6] including 17 (56%) mice with heterozygous PTPσ (HET) and 7 (44%) knockout PTPσ (KO) cases. In the first set of experiments, 4 HET, and 4 KO mice underwent MI with ischemia-reperfusion surgery while the other 5 HET and 3 KO mice were subjected to sham surgery. In the second set of experiments, the post-MI scar was re-innervated by ISP injections. As previously reported [6], sympathetic nerve density and the NE level in the infarct LV tissue was significantly higher in KO mice with innervated post-MI scar, and in ISP-treated, as compared to vehicle-treated HET mice. No difference in the infarct size between study groups was reported [6].
Heart rate variability and beat-to-beat variability in repolarization
There was no difference in mean heart rate and time domain HRV between HET and KO mice (Supplemental Table 1), as well as between post-MI and sham groups (Table 1). However, KO mice were characterized by the higher SD1/SD2 ratio on the Poincaré plot, as compared to HET mice, which was observed both in denervated and innervated scar groups (Supplemental Table 2).
Table 1.
Comparison of ECG parameters in ischemia-reperfusion model and sham surgery groups
| MI scar (N=8) | Sham (N=8) | P value | |
|---|---|---|---|
| Mean NN-interval(SD), ms | 135.8(17.5) | 130.5(16.2) | 0.401 |
| SDNN(SD),ms | 8.5(4.9) | 9.1(7.3) | 0.753 |
| rMSSD(SD),ms | 6.8(3.2) | 7.7(7.6) | 0.462 |
| SD1/SD2 on Poincaré plot(SD) | 0.52(0.21) | 0.49(0.20) | 0.600 |
|
| |||
| Mean QT interval(SD),ms | 96.5(15.5) | 91.5(15.2) | 0.462 |
| Mean QTc interval(SD),ms | 82.4(8.6) | 79.8(8.6) | 0.462 |
| QTVN(SD) | 0.010(0.007) | 0.015(0.015) | 1.00 |
|
|
|||
| QTVI(SD) | 0.419(0.169) | 0.428(0.141) | 0.753 |
|
| |||
| Peak-to-peak QRS amplitude(SD), mV | 1.35(0.53) | 1.88(0.55) | 0.092 |
MI=myocardial infarction
QTc and beat-to-beat QT variability did not differ in denervated and innervated post-MI scar, in any comparisons. Using two different approaches to measuring TWA, no TWA was detected.
Denervated post-MI scar is characterized by frequency content of ventricular activation
The mean signal-to-noise ratio across all the subjects was sufficiently high (11 dB). Figure 2 shows representative median beat filtered over the ranges of 100–200Hz, 200–300Hz, and 300–500Hz. Importantly, at the range of high frequencies (300–500Hz) power of signal exceeded the power of noise by 50 fold.
Figure 2.

A representative example of the mouse ECG signal filtered over different bands of frequency in time domain: Unfiltered median beat (A), and the filtered over the ranges of 100–200Hz (B), 200–300Hz (C) and 300–500Hz (D) median beat.
Development of an MI was characterized by the drop in average power of the QRS ECG signal across all frequencies, both in HET and KO groups (Figure 3). The peak-to-peak QRS amplitude was borderline-decreased in the post-MI scar group (Table 1). Averaged across all frequencies and all subjects QRSJpeak PSD was nearly twice higher in sham than in MI group (7.53 (95%CI 6.99–8.08) vs. 3.74 (95%CI 3.20–4.29) mV2/Hz*10−4 ; P<0.0001).
Figure 3.

Comparison of the average power spectral density (PSD) of ventricular conduction measured in two ECG segments in HET (black) and KO (red) mice: (A–C) PSD of QRSJpeak segment; (D–F) PSD of QRSJend segment. Panels A and D show sham control group. Panels B and E show myocardial infarction group. Panels C and F compare ISP-treated (red) vs. vehicle-treated (black) HET mice with myocardial infarction.
There were statistically significant differences in the relative contribution of high frequencies in the ECG signal in HET as compared to KO mice, observed only in the experimental post-MI group, but not in sham (Table 2). Denervated infarction was characterized by the significantly higher relative contribution of very high frequencies (300–500Hz) but reduced relative contribution of moderately high frequencies (200–300 Hz) within QRS. Respectively, innervated post-MI scar was characterized by preserved frequencies in the band 200–300 Hz, and significantly smaller relative contribution of very high frequencies (300–500Hz). Observed differences in frequencies content of ventricular conduction were consistent for both types of QRS measure: QRSJpeak and QRSJend. Figure 3 and Supplemental Figure 1 illustrate differences in the frequency content between denervated and innervated infarction. In MI group, but not in a sham group, averaged across all frequencies and all subjects QRSJpeak PSD was higher in KO than in HET mice (Table 3). Mixed regression analysis showed that in experimental post-MI group 1SD increase in QRSJpeak PSD was associated with more than doubled odds of being in the KO group (OR 2.37; 95% CI 1.28–4.42; P=0.006). Consistently with other findings, paired comparison of PSD before and after experimental intervention revealed decrease in 200–300Hz band power in HET post-MI group (before 194.7±178.3 vs. after 158.5±123.8 mV2/Hz*10−4), but increase in 200–300Hz band power in KO post-MI group (before 247.3±211.4 vs. after 309.5±202.1 mV2/Hz*10−4; P=0.018). No difference before and after sham intervention was observed in the study groups.
Table 2.
Comparison of the QRS frequency content in study groups
| Measurement | Myocardial Ischemia-Reperfusion Model |
Sham Surgery | HET Post-MI treated | ||||||
|---|---|---|---|---|---|---|---|---|---|
| HET post- MI (N=4) |
KO post- MI (N=4) |
P | HET sham (N=5) |
KO sham (N=3) |
P | ISP-treated (N=4) |
Vehicle- treated (N=4) |
P | |
| 200–300/200–500Hz QRSJpeak power ratio(SD), % |
85.7(1.24) | 91.0(1.34) | 0.001 | 87.9(5.61) | 86.6(4.55) | 0.733 | 89.9(1.00) | 82.8(9.97) | 0.249 |
| 300–500/200–500Hz QRSJpeak power ratio(SD), % |
14.3(1.24) | 8.98(1.34) | 12.1(5.61) | 13.4(4.55) | 10.1(1.00) | 17.2(9.97) | |||
| 200–300/200–500Hz QRSJend power ratio(SD), % |
85.3(1.01) | 90.6(2.05) | 0.008 | 88.6(2.90) | 86.4(1.11) | 0.184 | 88.7(2.10) | 84.3(5.34) | 0.201 |
| 300–500/200–500Hz QRSJend power ratio(SD), % |
14.7(1.01) | 9.37(2.05) | 11.4(2.90) | 13.6(1.11) | 11.3(2.10) | 15.7(5.34) | |||
Table 3.
Comparison of the averaged across all frequencies and subjects power spectral density
| Study Groups | Mean QRSJpeak PSD (95% CI), mV2/Hz*10−4 |
P-value | Mean QRSJend PSD (95% CI), mV2/Hz*10−4 |
P-value | ||
|---|---|---|---|---|---|---|
| Sham | HET (n=5) | 7.62 (7.37–7.87) | 0.060 | 6.15 (6.10–6.21) | <0.0001 | |
| KO (n=3) | 7.24 (6.92–7.56) | 6.79 (6.71–6.87) | ||||
|
| ||||||
| Post-MI | HET (n=4) | 3.50(3.45–3.55) | <0.0001 | 2.72(2.67–2.77) | <0.0001 | |
| KO (n=4) | 3.95(3.89–4.00) | 3.17(3.12–3.23) | ||||
|
| ||||||
| Post-MI | HET | Vehicle (n=4) | 1.47 (1.37–1.57) | <0.0001 | 1.77(1.63–1.91) | <0.0001 |
| ISP (n=4) | 2.16 (2.00–2.32) | 2.84(2.60–3.08) | ||||
ISP injections resulted in partial restoration of the QRS power composition in post-MI HET mice (Figure 3), consistent with histologically proven re-innervation of the scar by the sympathetic fibers. Averaged across all frequencies and across all subjects PSD was higher in ISP than in vehicle group (Table 3). Mixed regression analysis showed that 1SD increase in QRSJpeak PSD was associated with more than doubled odds of being in the ISP group (OR 2.33; 95% CI 1.23–4.38; P=0.009).
No statistically significant differences in the absolute or relative power of the high-frequency signal, recorded during ECG baseline segment (from Tend to QRS onset), between study groups were observed (Supplemental Table 3).
ECG characteristics correlate with norepinephrine tissue level in peri-infarct zone, and with sympathetic nerve density in the post-infarct scar
Peak-to-peak QRS amplitude, the power and the frequency content of QRSJpeak (but not QRSJend) significantly correlated with the level of NE in the peri-infarct tissue (Figure 4). There was no correlation between NE content in the scar itself, or right ventricle, and ECG characteristics. Moreover, the moderately strong correlation between the sympathetic TH+ fiber density within the infarct, and 200–300/200–500 Hz QRSJend power ratio (Figure 4), as well as 200–300/200–500 Hz QRSJpeak power ratio (r = 0.45; P=0.027) has been observed.
Figure 4.

Correlations between ECG characteristics and the peri-infarct tissue level of norepinephrine (A–C), and the sympathetic TH+ fiber density within the infarct (D). Scatterplot of (A) peak-to-peak QRS amplitude, (B) 1–200 Hz QRSJpeak power, and (C) 200–500 Hz QRSJpeak power (Y) against norepinephrine concentration in left ventricular peri-infarct tissue (X). (D) Scatterplot of 200–300/200–500 Hz QRSJend power ratio (Y) against the sympathetic TH+ fiber density within the infarct (X). A line of best fit is shown.
Comparison of ECG signal frequency composition in mice and man
As expected, ECG signal in mice has a higher proportion of high frequencies (60–260 Hz), as compared to human (Table 4). Interestingly, no significant differences in a relative contribution of the 40–80Hz band, as well as of very high frequencies (200–500 Hz band) between mice and a man were observed.
Table 4.
Comparison of ECG signal frequency composition in mice vs. human
| Measurement | Healthy young men[21] (N=27) |
Wild-type HET mice; Sham group (N=5) |
P |
|---|---|---|---|
| 30–60/0–60Hz Signal power ratio(SD) | 0.70(0.18) | 0.46(0.09) | < 0.0001 |
| 40–80/0–60Hz Signal power ratio(SD) | 0.72(0.31) | 0.74(0.21) | 0.872 |
| 60–120/0–60Hz Signal power ratio(SD) | 0.61(0.31) | 1.37(0.60) | 0.045 |
| 90–180/0–60Hz Signal power ratio(SD) | 0.38(0.25) | 1.50(0.76) | 0.030 |
| 130–260/0–60Hz Signal power ratio(SD) | 0.22(0.13) | 0.81(0.43) | 0.035 |
| 180–360/0–60Hz Signal power ratio(SD) | 0.09(0.06) | 0.22(0.16) | 0.155 |
| 250–500/0–60Hz Signal power ratio (SD) | 0.04(0.02) | 0.01(0.02) | 0.056 |
Discussion
This study illuminated mechanisms behind QRS frequencies distribution and showed that the QRS frequency content correlates with (1) the sympathetic nerve density in the infarcts, and (2) the NE level in the LV myocardium peri-infarct tissue. Denervated post-MI scar in LV is characterized by the shift of the QRS frequencies distribution towards the higher contribution of very high frequencies (300–500Hz), and lower contribution of moderately high frequencies (200–300Hz) within the QRS complex on the surface ECG, reflecting the presence of ventricular conduction disturbances. Results of our study are consistent with a previously observed high-frequency component of fragmented endocardial electrograms, associated with initiation of reentrant ventricular tachycardia in post-MI patients [22]. We also confirmed previously reported [7–10] findings that denervated infarction causes reduction of the power across moderately high frequencies (200–300 Hz). In contrast, increase in 200–300Hz power band was observed in innervated infarction. Neither HRV nor QTV or TWA reflected sympathetic nerve density in the LV infarction. Importantly, our study results uncovered the mechanistic association between the level of NE in the LV myocardium peri-infarct tissue and peak-to-peak QRS amplitude or power of the QRS.
Frequency content and average power spectra of the heart beat
Frequency content and the average power spectra of the heart beat carry important information about electrophysiological properties of the heart [23]. Results of this study reconfirmed that signal amplitudes reflect conduction velocity in the heart [24], which, in turn, could be modulated by the NE level in the LV tissue. Importantly, we identified specific frequency band, which is especially sensitive to the presence or absence of sympathetic nerves. This information could be further used in the development of the noninvasive diagnostic test. Our study once again demonstrated the importance of the appropriate recording and analysis of high frequencies within the ECG signal [23; 25]. However, it is important to emphasize that our study is a mechanistic proof of a concept, rather than readily available test. Further studies are needed to better characterize ECG features within identified diagnostic power band, which could be done in the analysis of multi-lead orthogonal ECG.
Our study raised the question about the high-frequency cutoff of ECG signal bandwidth. In 1989 the American Heart Association recommended [26] the high-frequency cutoff of 125 Hz (150 Hz for infant ECGs), based on technological limitations at that time. Since that time the semiconductor industry made major advances and introduced fast low-power 24 bit Sigma-Delta ADC with a dynamic range of more than 115 dB (> 19-bit effective resolution) and options for high sampling rates (up to 200 kHz). Clinical value of high-frequency ECG components has been shown by many investigators [23]. However, currently, most of commercially available ECG recording systems preclude clinical studies of high-frequency ECG signal. Upgrade of modern ECG manufacturing industry is warranted.
Denervated and innervated post-MI scar: mechanism and arrhythmogenic potential
Our findings are expected and consistent with well-understood electrophysiology of post-MI scar. Denervated post-MI scar and low levels of LV tissue NE in the certain areas of LV creates heterogeneity of activation, which is favorable for initiation of reentrant ventricular arrhythmia. High-frequency mid-diastolic potentials, recorded on endocardial LV bipolar electrogram at the time of ventricular tachycardia mapping and entrainment, are the hallmarks of the isthmus of the VT circuit [27]. In our main experiment [6], using optical mapping, we previously showed that denervated MI is characterized by increased dispersion of action potential duration, supersensitivity to β-adrenergic stimulation, and Ca2+ mishandling. Sympathetic reinnervation prevented these changes and rendered hearts resistant to arrhythmias.
Heart rate variability and repolarization variability did not reflect sympathetic nerve density in the ventricles of the heart
Observed in this study high SD1/SD2 ratio in Poincare plot in KO mice was consistent with relatively high levels of NE in the myocardium of KO mice. It was previously shown that SD1/SD2 ratio is increased during exercise after complete parasympathetic blockade due to a reduction in the long-term oscillation of heart rate [28]. This was the only HRV marker that reflected elevated tissue (possibly sinus node tissue) NE level. We did not find an association between QTV, TWA, and sympathetic nerve density in the ventricles of the heart, or NE level in the LV tissue.
Differences in ventricular activation presentation and frequency content on murine vs. human ECG
The morphology of QRS complex is different in mice as compared to a human. Large “R-prime” wave in mice is conventionally called “J-wave” because of early repolarization that coincides with it. In mice phase 1 of repolarization is more prominent than in human, resulting in significant repolarization occurring before ventricular activation is completed. There is a controversy regarding the definition of the end of QRS complex in mice due to prominent early repolarization phase, presented by a significant J-wave [16]. Early studies suggested that the J-wave should not be included in the QRS complex [29]. However, recent investigators defined the end of QRS complex at the end of J-wave [30]. Optical mapping studies showed that ventricular activation in mice lasts until the very end of the J-wave [16; 31]. To address this problem, we studied two QRS segments: one ending at J-peak, and another ending at J-end. The fact that results of our study were similar if using both definitions of QRS segment confirms the notion that high frequencies characterize ventricular conduction properties within the QRS, which are not due to late potentials or early repolarization.
Interestingly, we did not find significant differences in the very high-frequency component of QRS (above 200 Hz) between mice and man. While murine action potential and contributing cardiac ion channels function is significantly different in mice and a human [13; 16; 29–32], the sympathetic nervous system in the ventricles of the heart in both species is similar [33]. This observation corroborates interpretation of our main finding: very high frequencies QRS composition characterizes sympathetic nerve function within the ventricles of the heart.
Limitations
There were important limitations regarding our population of study which must be considered when trying to translate the results from mouse to human. There is a significant cardiac electrodynamics difference between human and mouse; mouse heart beat is approximately ten times faster than human; mouse action potential duration is about ten times shorter and more triangular shape in comparison with human [32], which limits interpretation of the negative findings regarding ECG repolarization characteristics in this study.
Furthermore, single-lead recorded ECG is also a limitation of this study. Further studies will be needed to develop clinical ECG test that should incorporate analysis of orthogonal XYZ ECG, or 12-lead ECG. In addition, use of the bandwidth of 1–200Hz and attenuation of power in the frequencies higher than 200Hz limited our study due to the reduction of the intensity of power in high frequencies, as well as constrained our freedom to compare different bands of frequencies in the attenuated and not attenuated ranges with each other. Despite limitations, the conducted experiment performed direct measurements of the sympathetic nerve density in the LV of heart and enabled unique translation of the mechanisms behind surface ECG features.
Conclusion
Sympathetic nerve density in the LV post-MI scar and NE level in peri-infarct zone correlates with the frequency characteristics of ventricular conduction on surface ECG. Denervated post-MI scar is characterized by a relative increase of very high (300–500Hz) frequency content and relative decrease of 200–300 Hz frequencies contribution, which correlates with the sympathetic nerve density within the infarct. NE level in peri-infarct tissue is correlated with QRS complex amplitude and QRS frequency power. Understanding of the mechanisms behind ECG features will help to develop novel diagnostic and prognostic ECG tools.
Supplementary Material
Highlights.
Sympathetic nerve density within the infarct correlates with QRS frequency content.
Norepinephrine level in peri-infarct tissue correlates with QRS frequencies power.
Frequency content of QRS complex can help to distinguish denervated and innervated infarcts
Acknowledgments
The authors would like to thank the National Institute of Health #R01HL118277 (LGT) and R01HL093056 (BH) for its support.
Footnotes
Publisher's Disclaimer: This is a PDF file of an unedited manuscript that has been accepted for publication. As a service to our customers we are providing this early version of the manuscript. The manuscript will undergo copyediting, typesetting, and review of the resulting proof before it is published in its final citable form. Please note that during the production process errors may be discovered which could affect the content, and all legal disclaimers that apply to the journal pertain.
References
- 1.Solomon SD, Zelenkofske S, Mcmurray JJ, Finn PV, Velazquez E, Ertl G, et al. Sudden death in patients with myocardial infarction and left ventricular dysfunction, heart failure, or both. N Engl J Med. 2005;352(25):2581–2588. doi: 10.1056/NEJMoa043938. [DOI] [PubMed] [Google Scholar]
- 2.Schwartz PJ, La Rovere MT, Vanoli E. Autonomic nervous system and sudden cardiac death. Experimental basis and clinical observations for post-myocardial infarction risk stratification. Circulation. 1992;85(1 Suppl):I77–I91. [PubMed] [Google Scholar]
- 3.Barber MJ, Mueller TM, Henry DP, Felten SY, Zipes DP. Transmural myocardial infarction in the dog produces sympathectomy in noninfarcted myocardium. Circulation. 1983;67(4):787–796. doi: 10.1161/01.cir.67.4.787. [DOI] [PubMed] [Google Scholar]
- 4.Kimura K, Ieda M, Kanazawa H, Yagi T, Tsunoda M, Ninomiya S, et al. Cardiac sympathetic rejuvenation: a link between nerve function and cardiac hypertrophy. Circ Res. 2007;100(12):1755–1764. doi: 10.1161/01.RES.0000269828.62250.ab. [DOI] [PubMed] [Google Scholar]
- 5.Fallavollita JA, Heavey BM, Luisi AJ, Jr, Michalek SM, Baldwa S, Mashtare TL, Jr, et al. Regional myocardial sympathetic denervation predicts the risk of sudden cardiac arrest in ischemic cardiomyopathy. J Am Coll Cardiol. 2014;63(2):141–149. doi: 10.1016/j.jacc.2013.07.096. [DOI] [PMC free article] [PubMed] [Google Scholar]
- 6.Gardner RT, Wang L, Lang BT, Cregg JM, Dunbar CL, Woodward WR, et al. Targeting protein tyrosine phosphatase sigma after myocardial infarction restores cardiac sympathetic innervation and prevents arrhythmias. Nature communications. 2015;6(6235) doi: 10.1038/ncomms7235. [DOI] [PMC free article] [PubMed] [Google Scholar]
- 7.Mor-Avi V, Shargorodsky B, Abboud S, Laniado S, Akselrod S. Effects of coronary occlusion on high-frequency content of the epicardial electrogram and body surface electrocardiogram. Circulation. 1987;76(1):237–243. doi: 10.1161/01.cir.76.1.237. [DOI] [PubMed] [Google Scholar]
- 8.Pettersson J, Pahlm O, Carro E, Edenbrandt L, Ringborn M, Sörnmo L, et al. Changes in high-frequency QRS components are more sensitive than ST-segment deviation for detecting acute coronary artery occlusion. Journal of the American College of Cardiology. 2000;36(6):1827–1834. doi: 10.1016/s0735-1097(00)00936-0. [DOI] [PubMed] [Google Scholar]
- 9.Abboud S, Belhassen B, Miller HI, Sadeh D, Laniado S. High frequency electrocardiography using an advanced method of signal averaging for non-invasive detection of coronary artery disease in patients with normal conventional electrocardiogram. J Electrocardiol. 1986;19(4):371–380. doi: 10.1016/s0022-0736(86)81065-2. [DOI] [PubMed] [Google Scholar]
- 10.Abboud S, Berenfeld O, Sadeh D. Simulation of high-resolution QRS complex using a ventricular model with a fractal conduction system. Effects of ischemia on highfrequency QRS potentials. Circ Res. 1991;68(6):1751–1760. doi: 10.1161/01.res.68.6.1751. [DOI] [PubMed] [Google Scholar]
- 11.Gardner RT, Habecker BA. Infarct-derived chondroitin sulfate proteoglycans prevent sympathetic reinnervation after cardiac ischemia-reperfusion injury. The Journal of neuroscience : the official journal of the Society for Neuroscience. 2013;33(17):7175–7183. doi: 10.1523/JNEUROSCI.5866-12.2013. [DOI] [PMC free article] [PubMed] [Google Scholar]
- 12.Mitchell GF, Jeron A, Koren G. Measurement of heart rate and Q-T interval in the conscious mouse. Am J Physiol. 1998;274(3 Pt 2):H747–H751. doi: 10.1152/ajpheart.1998.274.3.H747. [DOI] [PubMed] [Google Scholar]
- 13.Danik S, Cabo C, Chiello C, Kang S, Wit AL, Coromilas J. Correlation of repolarization of ventricular monophasic action potential with ECG in the murine heart. Am J Physiol Heart Circ Physiol. 2002;283(1):H372–H381. doi: 10.1152/ajpheart.01091.2001. [DOI] [PubMed] [Google Scholar]
- 14.Baumert M, Porta A, Vos MA, Malik M, Couderc JP, Laguna P, et al. QT interval variability in body surface ECG: measurement, physiological basis, and clinical value: position statement and consensus guidance endorsed by the European Heart Rhythm Association jointly with the ESC Working Group on Cardiac Cellular Electrophysiology. Europace. 2016 doi: 10.1093/europace/euv405. [DOI] [PMC free article] [PubMed] [Google Scholar]
- 15.Kim R, Cingolani O, Wittstein I, Mclean R, Han L, Cheng KL, et al. Mechanical Alternans Is Associated With Mortality in Acute Hospitalized Heart Failure Prospective Mechanical Alternans Study (MAS) Circ.-Arrhythmia Electrophysiol. 2014;7(2):259–266. doi: 10.1161/CIRCEP.113.000958. [DOI] [PMC free article] [PubMed] [Google Scholar]
- 16.Boukens BJ, Rivaud MR, Rentschler S, Coronel R. Misinterpretation of the mouse ECG: 'musing the waves of Mus musculus'. J Physiol. 2014;592(21):4613–4626. doi: 10.1113/jphysiol.2014.279380. [DOI] [PMC free article] [PubMed] [Google Scholar]
- 17.Rompelman O, Ros HH. Coherent averaging technique: A tutorial review Part 1: Noise reduction and the equivalent filter. Journal of Biomedical Engineering. 1986;8(1):24–29. doi: 10.1016/0141-5425(86)90026-9. [DOI] [PubMed] [Google Scholar]
- 18.Welch P. The use of fast Fourier transform for the estimation of power spectra: A method based on time averaging over short, modified periodograms. IEEE Transactions on Audio and Electroacoustics. 1967;15(2):70–73. [Google Scholar]
- 19.Sörnmo L, Laguna P. Wiley Encyclopedia of Biomedical Engineering. John Wiley & Sons, Inc.; 2006. Electrocardiogram (ECG) Signal Processing. [Google Scholar]
- 20.Jager F, Moody GB, Mark RG European Society of C. Protocol to assess robustness of ST analysers: a case study. Physiol Meas. 2004;25(3):629–643. doi: 10.1088/0967-3334/25/3/004. [DOI] [PubMed] [Google Scholar]
- 21.Franke EK, Braunstein JR, Zellner DC. Study of High Frequency Components in Electrocardiogram by Power Spectrum Analysis. Circulation Research. 1962;10(6):870–879. [Google Scholar]
- 22.Josephson ME. Clinical cardiac electrophysiology : techniques and interpretations. Philadelphia: Wolters Kluwer/Lippincott Williams & Wilkins, Health; 2008. [Google Scholar]
- 23.Tereshchenko LG, Josephson ME. Frequency content and characteristics of ventricular conduction. J Electrocardiol. 2015;48(6):933–937. doi: 10.1016/j.jelectrocard.2015.08.034. [DOI] [PMC free article] [PubMed] [Google Scholar]
- 24.Josephson ME, Anter E. Substrate Mapping for Ventricular Tachycardia: Assumptions and Misconceptions. JACC: Clinical Electrophysiology. 2015;1(5):341–352. doi: 10.1016/j.jacep.2015.09.001. [DOI] [PubMed] [Google Scholar]
- 25.Tereshchenko LG, Waks JW, Kabir M, Ghafoori E, Shvilkin A, Josephson ME. Analysis of speed, curvature, planarity and frequency characteristics of heart vector movement to evaluate the electrophysiological substrate associated with ventricular tachycardia. Comput Biol Med. 2015;65:150–160. doi: 10.1016/j.compbiomed.2015.03.001. [DOI] [PMC free article] [PubMed] [Google Scholar]
- 26.Bailey JJ, Berson AS, Garson A, Jr, Horan LG, Macfarlane PW, Mortara DW, et al. Recommendations for standardization and specifications in automated electrocardiography: bandwidth and digital signal processing. A report for health professionals by an ad hoc writing group of the Committee on Electrocardiography and Cardiac Electrophysiology of the Council on Clinical Cardiology, American Heart Association. Circulation. 1990;81(2):730–739. doi: 10.1161/01.cir.81.2.730. [DOI] [PubMed] [Google Scholar]
- 27.Cassidy DM, Vassallo JA, Miller JM, Poll DS, Buxton AE, Marchlinski FE, et al. Endocardial catheter mapping in patients in sinus rhythm: relationship to underlying heart disease and ventricular arrhythmias. Circulation. 1986;73(4):645–652. doi: 10.1161/01.cir.73.4.645. [DOI] [PubMed] [Google Scholar]
- 28.Tulppo MP, Makikallio TH, Takala TE, Seppanen T, Huikuri HV. Quantitative beat-to-beat analysis of heart rate dynamics during exercise. Am J Physiol. 1996;271(1 Pt 2):H244–H252. doi: 10.1152/ajpheart.1996.271.1.H244. [DOI] [PubMed] [Google Scholar]
- 29.Goldbarg AN, Hellerstein HK, Bruell JH, Daroczy AF. Electrocardiogram of the normal mouse, Mus musculus: general considerations and genetic aspects. Cardiovasc Res. 1968;2(1):93–99. doi: 10.1093/cvr/2.1.93. [DOI] [PubMed] [Google Scholar]
- 30.Salama G, London B. Mouse models of long QT syndrome. J Physiol. 2007;578(Pt 1):43–53. doi: 10.1113/jphysiol.2006.118745. [DOI] [PMC free article] [PubMed] [Google Scholar]
- 31.Boukens BJ, Hoogendijk MG, Verkerk AO, Linnenbank A, Van Dam P, Remme CA, et al. Early repolarization in mice causes overestimation of ventricular activation time by the QRS duration. Cardiovasc Res. 2013;97(1):182–191. doi: 10.1093/cvr/cvs299. [DOI] [PubMed] [Google Scholar]
- 32.Ahrens-Nicklas RC, Christini DJ. Anthropomorphizing the mouse cardiac action potential via a novel dynamic clamp method. Biophys J. 2009;97(10):2684–2692. doi: 10.1016/j.bpj.2009.09.002. [DOI] [PMC free article] [PubMed] [Google Scholar]
- 33.Brum PC, Kosek J, Patterson A, Bernstein D, Kobilka B. Abnormal cardiac function associated with sympathetic nervous system hyperactivity in mice. Am J Physiol Heart Circ Physiol. 2002;283(5):H1838–H1845. doi: 10.1152/ajpheart.01063.2001. [DOI] [PubMed] [Google Scholar]
Associated Data
This section collects any data citations, data availability statements, or supplementary materials included in this article.