

Abstract
Alcohol use disorders encompass a range of drinking levels and behaviors, including low, binge and heavy drinking. In this regard, investigating the neural state of individuals who chronically self-administer lower doses of alcohol may provide insight into mechanisms that prevent the escalation of alcohol use. DNA methylation is one of the epigenetic mechanisms that stabilizes adaptations in gene expression and has been associated with alcohol use. Thus, we investigated DNA methylation, gene expression and the predicted neural effects in the nucleus accumbens of male rhesus macaques categorized as “low” or “binge” drinkers, compared to “alcohol-naïve” and “heavy” drinkers based on drinking patterns during a 12 month alcohol self-administration protocol. Using genome-wide CpG-rich region enrichment and bisulfite sequencing, the methylation levels of 2.6 million CpGs were compared between alcohol naïve (AN), low/binge (L/BD) and heavy/very heavy (H/VHD) drinking subjects (n=24). Through regional clustering analysis, we identified nine significant differential methylation regions (DMRs) that specifically distinguished ANs and L/BDs, and then compared those DMRs among H/VHDs. The DMRs mapped to genes encoding ion channels, receptors, cell adhesion molecules and cAMP, NF-κβ and Wnt signaling pathway proteins. Two of the DMRs, linked to PDE10A and PKD2L2, were also differentially methylated in H/VHDs, suggesting an alcohol-dose independent effect. However two other DMRs, linked to the CCBE1 and FZD5 genes, had L/BD methylation levels that significantly differed from both ANs and H/VHDs. The remaining 5 DMRs also differentiated L/BDs and ANs, however H/VHDs methylation levels were not distinguishable from either of the two groups. Functional validation of two DMRs, linked to FZD5 and PDE10A, support their role in regulating gene expression and exon usage, respectively. In summary, the findings demonstrate that L/BD is associated with unique DNA methylation signatures in the primate NAcc, and identifies synaptic genes that may play a role in preventing the escalation of alcohol use.
Keywords: alcohol, differentially methylated regions, DNA methylation, exon-usage, gene expression, nonhuman primates
INTRODUCTION
Alcohol use disorders (AUDs) are defined as maladaptive behaviors characterized by alcohol craving, seeking and consumption that, in some cases, evolve into compulsive alcohol use, loss of behavioral control, increased alcohol tolerance, withdrawal symptoms and relapse (DSM5; Enoch and Goldman, 2002; WHO, 2002). Individuals with AUDs report a broad range of alcohol consumption, between 0.7g/kg/day and ≥ 3.9g/kg/day (Hietala et al., 1994; Hirth et al., 2016; Volkow et al., 2002; Wang et al., 2016). In addition, while some individuals establish chronic heavy drinking behavior, others maintain chronic, lower levels of consumption, and still others develop binge-drinking patterns. While these drinking patterns and levels of alcohol consumption may be influenced, in part, by varying rates of alcohol metabolism, underlying regulatory mechanisms that coordinate the reward response and tolerance to the intoxicating effects of alcohol are also potential contributing factors. Thus the neural study of individuals that stably maintain lower levels of alcohol use could provide insight into mechanisms limiting the escalation of alcohol use.
DNA methylation is a form of epigenetic regulation that stabilizes changes in chromatin structure, gene regulation and expression (Cedar and Bergman, 2009; Gutierrez-Arcelus et al., 2015) in response to environmental stimuli, such as drugs of abuse. Altered DNA methylation at individual loci has been linked to alcohol dependence (Bleich et al., 2006; Bonsch et al., 2005), and global CpG methylation has been reported higher in alcoholic populations (Bonsch et al., 2004; Thapar et al., 2012; Wang et al., 2016). A recent genome-wide study identified differential DNA methylation in the prefrontal cortex (PFC) of human postmortem alcoholic and non-alcoholic subjects (Wang et al., 2016). A subset of the differentially methylated CpGs mapped to differentially expressed genes in the same samples, suggesting that DNA methylation may contribute to transcriptional regulation in alcoholics. In addition, the genes identified were involved in synaptic plasticity processes known to mediate alcohol-associated behaviors. A step forward in clarifying the regulatory mechanisms underlying the neural state associated with differing alcohol use behaviors, low/binge or heavy/very heavy, requires the epigenomic comparison of individuals with differing severity of alcohol use and drinking patterns.
The nonhuman primate (NHP) alcohol self-administration model provides unique opportunity to investigate the neural state associated with a broad range of alcohol consumption histories (from 0.5 g/kg/day to up to 4.4 g/kg/day; Baker et al., 2014). In this model, macaques are given open access to both 4% (w/v) ethanol and water ad libitum for 22 hours/day for 12 months, with precise daily recordings of all fluids and food consumed (Grant et al., 2008b). Studies modeling the alcohol self-administration consumption patterns in macaques have identified four stable and distinguishable classifications, termed low, binge, heavy and very heavy drinking. Together, the low and binge drinkers consume an average of 1.9 g/kg/day alcohol and never (low) or only occasionally (binge) reach blood ethanol concentrations (BECs) above 80 mg/dl, the baseline measure of human intoxication (Baker et al., 2014). In contrast, the heavy and very heavy drinking subjects regularly consume 3.0 g/kg/day or greater and regularly reach BECs above 80 mg/dl. The highly accurate alcohol consumption data and behavioral consistency across categorical classifications provide unique opportunity to analyze the neural state associated with the spectrum of alcohol use, and to identify mechanistic hallmarks exclusive to either low/binge or heavy/very heavy alcohol consumption, or alternatively, common to all levels of alcohol use.
Alcohol, like other drugs of abuse, activates molecular pathways within the mesocorticolimbic system that ultimately translates into drug-seeking behaviors. The NAc core (NAcc) is implicated in the control of motivated behaviors by discrete cues (Chaudhri et al., 2010). In particular, the NAcc can be viewed as a relay station selecting and integrating the most relevant environmental stimuli among competing limbic and cortical afferents to drive behavioral output (Ito and Hayen, 2011). Extensive evidence has demonstrated that the NAcc is essential in modulating alcohol dependence, tolerance, craving and withdrawal (Lovinger and Kash, 2015; Lovinger and Roberto, 2013; Luscher and Malenka, 2011; Siciliano et al., 2015; Zhou et al., 2007). Profiling the epigenome in the NAcc is of central importance to understanding the neural state motivating differing alcohol consumption patterns.
In the present study, we use a genome-wide approach to detect the methylation levels of approximately 2.6 million CpGs in the NAcc of rhesus macaques that self-administered alcohol for 12 months. We combined the bisulfite sequencing of CpG rich regions and regional clustering analysis to identify nine significant differentially methylated regions (DMRs) among alcohol-naïve (AN) and low/binge drinkers (L/BDs). Next we compared the identified DMRs in heavy and very heavy drinkers (H/VHDs) to ascertain the differential association of DMRs between the two classifications of L/BD and H/VHD drinkers. Functional validation of the DMRs supports their role in modulating alcohol-associated gene expression. All nine DMRs identified mapped to genes with cellular functions that contribute to synaptic function, including cell surface receptors, ion channels and signal transduction molecules, underscoring their role in modulating neural function in the presence of alcohol.
MATERIALS AND METHODS
Subjects
All of the monkeys in this study were born and reared at the Oregon National Primate Research Center (ONPRC) with their mothers until 2–3 years of age. Male rhesus macaques (n=42, Macaca mulatta) that were late adolescents, young adults and middle-aged adults (4.0–5.0, 5.1–7.0 and 7.1–9.5 years at the start of the 12 month open access period, respectively; n=16, n=18 and n=8 per age group) were included in this study. All subjects in the alcohol self-administration study were initially selected to minimize relatedness; the average kinship coefficient of all subjects was 0.003. Monkeys were individually housed, and all subjects underwent the same experimental conditions. Monkeys were allowed visual, auditory and olfactory sensory contact with each other in a room with 12:12-hour light-dark cycle with lights on at 7 a.m. All of the animal procedures used in this study were approved by the ONPRC IACUC and were performed in accordance with the NIH and the National Resource Council’s Guide for the Care and Use of Laboratory Animals.
Macaque ethanol drinking classifications
Voluntary and long-term ethanol self-administration was induced using schedule-induced polydipsia as previously described (Grant et al., 2008a). Briefly, monkeys were trained daily to use the operant panel and induced to drink 0.0, 0.5, 1.0 and 1.5 g per kg ethanol (4%) in 30 day epochs. During the following 12 months, subjects had open access (22 hrs/day) to 4% (w/v) alcohol and water ad libitum. The alcohol intake data were collected and recorded in an automated fashion by computer, and average g/kg body weight per day (g/kg/day) was based on the 12 months of open alcohol access.
While macaques self-administer a broad range (0.5–4.4 g/kg/day) of alcohol during the 12 months of open access to ethanol and water, the present study focuses on the subjects among the lower end of this spectrum, those classified as “low” or “binge” drinkers (LDs and BDs, respectively) (Baker et al., 2014). Specifically, subjects were classified as BDs if they voluntarily consumed more than 2g/kg/day but less than 3 g/kg/day for more than 55% of the days during 12 months of access to 4% alcohol; subjects that did not reach the BD alcohol consumption threshold were defined as LDs (Supplementary Figure 1b). Overall, all the L/BDs had a mean daily alcohol use of 1.9 g/kg (Supplementary Figure 1a). To determine whether the methylation changes observed in L/BDs were also present among subjects that consumed much more alcohol, we included additional subjects classified as “heavy” or “very heavy” drinkers based on their alcohol consumption levels in the same 12 month self-administration study (Baker et al., 2014). Here identified as heavy/very heavy drinkers (H/VHDs) these subjects consumed an average of between 2.4 and 4.4 g/kg/day. Importantly, L/BDs never, or occasionally, reach BECs above 80 mg/dl, the baseline measure of human intoxication (Baker et al., 2014). In contrast, H/VHDs routinely measure BECs above 80 mg/dl. We had previously confirmed that the ethanol drinking levels did not reflect general differences in thirst and were not associated with the age of the subjects (Cervera-Juanes et al., 2016).
This study included twenty-four subjects (8 ANs, 7 L/BDs and 9 H/VHDs) in the genome-wide bisulfite sequencing (GWBS) study; the sample size was expanded to a total of 42 subjects for the bisulfite amplicon sequencing (BSAS) validation study (13 AN, 16 L/BDs, 13H/VHDs). Based on sample availability, 26 of the same animals were included in the RNA analysis (8 ANs, 9 L/BDs and 9 H/VHDs).
Tissue collection and genomic DNA isolation
After the 12-month open access period, a detailed necropsy protocol previously described was used to systematically collect tissues from all subjects (Cervera-Juanes et al., 2016; Davenport et al., 2014). Briefly, monkeys were anesthetized with ketamine (10 mg/kg), maintained on isoflurane, and perfused with ice-cold oxygenated monkey perfusion solution [containing (in mM) 124 NaCl, 23 NaHCO3, 3 NaH2PO4, 5 KCl, 2 MgSO4, 10 d-glucose, 2 CaCl2]. Brains were quickly removed and sectioned along the coronal plane using a brain matrix (Daunais et al., 2010). The block containing the NAcc was initially selected by each individual’s MRI images and verified using visible landmarks. In macaques, the NAcc is approximately 2mm × 2mm and extends approximately 3mm rostral/caudal (Paxinos, 1999). The core is differentiated from the shell based on visible landmarks. Using the curvature of the internal capsule, the area just ventral to its end is the NAcc. From the frozen 4mm coronal brain block maintained on dry ice a small circular dissection of approximately 1 mm3 was made taking care to not collect white matter from the tract (dorsal to the core). This relatively small dissection avoids the NAc shell and yields enough tissue for nucleic acid isolation. Genomic DNA and RNA were extracted from the NAcc using the All Prep DNA/RNA/miRNA Universal kit (Qiagen Sciences Inc, Germantown, MD) following the manufacturer’s recommendations.
High-throughput DNA methylation analysis
Three micrograms of genomic DNA were sheared using a Bioruptor UCD200 (Diagenode, Denville, NJ), generating fragments around 300bp. The SureSelect XT Human Methyl-Seq library preparation (Agilent Technologies, Santa Clara, CA) was used following the manufacturer’s instructions. The enriched fragment libraries were then bisulfite treated using EZ DNA Methylation-Gold (Zymo Research, Irvine, CA). The final libraries were quantified using a 2100 Bioanalyzer (Agilent Technologies, Santa Clara, CA). DNA libraries were sequenced on an Illumina HiSeq2500 at the OHSU Massively Parallel Shared Sequence Resource (MPSSR).
CpG methylation rate analysis
The quality of the bisulfite-converted sequencing reads were assessed with FastQC (Team, 2014). Reads were trimmed using Trim Galore (Terry et al., 2011), aligned to the reference genome (MacaM (Zimin et al., 2014)) using Bismark (Krueger and Andrews, 2011) and M-bias plots were generated (Hansen et al., 2012). Bisulfite conversion was also evaluated using Bismark, and all samples had >98% cytosine conversion. Methylation rates were determined using Bismark methylation extractor. The CpG methylation rates were calculated as the ratio of methylated reads over the total number of reads. Methylation rates for CpGs with fewer than 10 reads were excluded from further analysis. The remaining CpGs (2.6 million) had an average of 60x read coverage. All sequence reads were submitted to the Sequence Read Archive at NCBI under project accession number PRJNA294610. An overview of these results is described in Supplementary table 1.
Bisulfite amplicon sequencing (BSAS)
The GWBS DMR methylation levels were validated using targeted bisulfite amplicon sequencing (BSAS) and an expanded sample set (n=42). Primers were designed within 200 bp of each DMR, using the Bisulfite Primer Seeker tool from Zymo Research (Supplementary table 2). Each gDNA (250ng) was bisulfite converted using EZ DNA Methylation-Gold (Zymo Research, Irvine, CA) and 12.5 ng of bisulfite-converted DNA was used for each PCR reaction. Library construction, analysis of the percent methylation at each CpG in each amplicon and PCR allele bias correction were performed as previously described (Cervera-Juanes et al., 2016).
High-throughput real time PCR
RNA extracted from the same NAcc tissues was used for qRT-PCR analysis. The Fluidigm Reverse Transcription Master Mix (Fluidigm, Inc., San Francisco, CA) was used to reverse-transcribe 100 ng of each RNA sample following the manufacturer’s instructions. Next, the cDNA was pre-amplified and unincorporated primers were removed following manufacturer’s instructions. The reactions were diluted (10x) with 43 µl of TE buffer (TEKnova, Hollister, CA).
qPCR was performed using the BioMark™ HD System and the 96.96 GE Dynamic Arrays (Fluidigm, Inc., San Francisco, CA) in triplicate assays. The Fluidigm sample premix and the assay premix were prepared following manufacturer’s instructions. The samples and reagents were mixed using the Nanoflex IFC controller (Fluidigm). Thermal qPCR conditions were: 95 °C for 60 s, 35 cycles of 95 °C for 5 s, and 60 °C for 20 s. Data was processed by automatic threshold for each assay, with derivative baseline correction using BioMark Real-Time PCR Analysis Software 3.1.2 (Fluidigm). The quality threshold was set at the default of 0.65.
The primer sequences are listed in Supplementary table 3. The mRNA expression levels were normalized as previously described (Cervera-Juanes et al., 2016), except for using the geometric mean of three constitutive genes; B-Actin, Tubulin1 and Phosphoglycerate kinase (PGK1 (Boda et al., 2009)). We also confirmed that different levels of alcohol use did not affect their expression in the NAcc (data not shown).
Statistical Analysis
The exploratory nature of the present study limited our ability to estimate a priori the sample size needed to detect the effects of low/binge levels of alcohol on the methylome. Thus, we used a group-comparison (AN vs L/BD vs H/VHD) that was previously established based on the specific drinking parameters during 12 months of alcohol consumption, to maximize the opportunity to detect significant effects of alcohol dose on DNA methylation levels. Not all of the subjects had both DNA and RNA samples available, and thus the number of subjects for DNA methylation and expression analysis varies slightly. The maximum number of samples available was used for each analysis.
One of the limitations of GWBS data analysis is that the significance of single differentially methylated CpGs does not survive multiple-testing correction when analyzing millions of CpG data points. Thus, we employed the comb-p method that combines p-values in sliding windows across the sequenced regions accounting for spatial correlations (Pedersen et al., 2012). In detail, the CpG methylation rates of AN (n= 8), L/BD (n= 7) and H/VHD (n= 9) subjects were first subjected to the Wilcoxon 2-sample independent test using the wilcoxon.test function in the R programming language (Team, 2014). The comb-p method uses a sliding window correction where each Wilcoxon p-value is adjusted by applying the Stouffer-Liptak-Kechris (slk) method (Kechris et al., 2010; LIptak, 1958; Stouffer, 1949) of neighboring p-values as weighted according to the observed auto-correlation (ACF) at the appropriate lag. Briefly, comb-p first calculates the ACF at varying distance lags, then the ACF is used to perform the slk correction where each p-value is adjusted according to adjacent p-values as weighted according to the ACF. Thus, a given p-value is pulled lower if its neighbors also have low p-values. Next, a q-value score based on the Benjamini-Hochberg false discovery rate (FDR) correction is calculated. The peak-finding algorithm is used to find enrichment regions. Once the regions are identified, a p-value for each region can be assigned using the Stouffer-Liptak correction. Then, the FDR q-value is used to define the extent of the region while the slk-corrected p-value and a one-step Sidak multiple-testing correction (SIdak, 1967) is used to define the significance of the region. Parameters for Comb-p were DIST=300, STEP=60, and THRESHOLD=0.05. The specific codes used will be available upon request.
The Shapiro-Wilk test (appropriate for small sample sizes) was used to assess the normality of the average methylation and single CpG methylation rates for the 2 amplicons analyzed by BSAS, and also the mRNA expression for FZD5, and PDE10A. The variables analyzed followed a normal distribution. We used the 1.5xIQ (interquartile range) method to identify outliers, which, if present, were excluded from the corresponding analysis. The sample size for each analysis is specified in the results section as well as in the figure legends.
Prior to applying the independent t-test to compare the individual CpG methylation rate within the DMRs between ANs and L/BDs, the Levene’s test for equality of the variances was used. When the variance was heterogeneous, the Welch-Satterthwaite method was used for estimating the standard error.
One-way ANOVA (one-sided) was used to compare the difference in the average DMR DNA methylation and mRNA relative expression for FZD5 and PDE10A between AN, L/BDs and H/VHDs. Prior to applying one-way ANOVA, Levene’s test was used to test homogeneous variance assumption for parametric methods (pFZD5-DMR= 0.099, pPDE10A-DMR= 0.028, pFZD5-mRNA= 0.021, pPDE10A-exon1A-mRNA= 0.921, pLRP5-mRNA= 0.207). Because of the heterogeneous variance of the DMR average methylation for PDE10A (p= 0.010), we applied the nonparametric Kruskal-Wallis test. Bonferroni correction for the multiple comparisons was used to correct the overall type I error rate.
Pearson correlation analysis was used to explore associations between mRNA expression, DMR average methylation and average ethanol (g/kg/day) consumption.
All statistical analyses were carried out using IBM SPSS Statistics (Armonk, NY), R and Comb-p software, with values α<0.05.
RESULTS
Alcohol-associated differentially methylated CpGs in the NAcc
Genome-wide targeted capture technology, combined with bisulfite sequencing, enabled the precise measurement of the methylation levels at contiguous CpGs in potential regulatory regions. Using the Agilent SureSelect Human Methyl-Seq enrichment system, we recovered 3.1 of the 3.7 million targetted CpGs. We thus achieved broad representation of the genome-wide design, capturing CpG islands, shores, shelves, promoters and DNAse I hypersensitive sites. Of the average 2.6 million CpGs per individual that met our quality requirements (Supplementary table 1), 61,918 CpGs (2.4%) had significant methylation differences between ANs and L/BDs, and 76,754 (2.9%) between ANs and H/VHDs (Wilcoxon test). The significant CpGs showed a greater proportion of hypomethylated CpGs in L/BDs (32,917/61,918=53%; Figure 1a). In contrast, H/VHDs had more hypermethylation than ANs (53,646/76,754=70%; Figure 1a).
Figure 1.
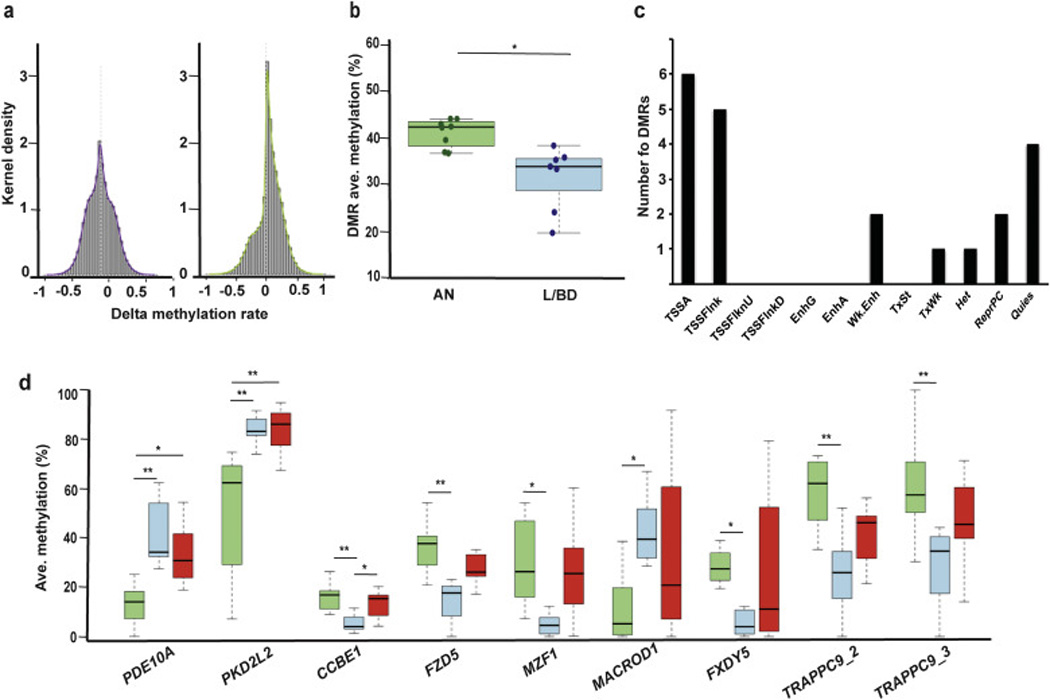
Characterization of significant differentially methylated CpGs and regions (DMRs) in the NAc core. a) Kernel density estimation plot (R package, vR3.0.2) of the overall delta methylation rates of the significant CpGs discovered comparing AN and L/BD (left) and AN and H/VHD (right). b) Comparison of the average DMR methylation between AN (green, n=8) and L/BD (blue, n= 7); p-value (independent t-test) = 0.043. c) Distribution of chromatin states associated with the 9 NAcc DMRs, based on 7 brain regions reported in the Epigenomics Roadmap Database (Roadmap Epigenomics et al., 2015). TSSA indicates active transcription start site; TSSFlank indicates TSS flanking sequence; TSSFlnkU and TSSDFlnkD are upstream and downstream TSS flaking sequence respectively; EnhG is genomic enhancer; EnhA is active enhancer; Wk.Enh is weak enhancer; TxSt is strong transcriptional activity; TxWk is weak transcriptional activity; Het is associated heterochromatin; ReproPC and ReproPC are repressed polycomb region and weak polycomb region respectively; Quies is quiescent state. d) The average methylation rate for the 9 DMRs is shown for ANs (green), L/BDs (blue) and HDs (red). ANOVA; *p-value<0.05; **p-value<0.01.
Alcohol-associated DMRs in the NAcc
In the present study, we identified coordinated methylation changes at neighboring CpGs, an approach that minimizes the false discovery associated with thousands of differentially methylated individual CpGs and enhances the prospect of identifying functional effects (Bock, 2012; Pedersen et al., 2012; Robinson et al., 2014). We adapted the comb-p method (Pedersen et al., 2012) to identify a set of 9 robust DMRs distinguishing ANs and L/BDs. The size of the DMRs ranged from 39–114 bp (mean= 68), and the number of CpGs per DMR ranged from 5 to 17 (mean= 9), with an average CpG density of 0.14. As with the genome-wide CpG data, the DMRs associated with low/binge alcohol consumption were hypomethylated relative to ANs (p= 0.043, n= 15, Independent t-test; Figure 1b), even when considering that three of the DMRs were hypermethylated in L/BDs as compared to ANs (Table 1). While the individual CpG methylation level could vary across each DMR, the relative CpG methylation levels were consistent between ANs and L/BDs (Supplementary figure 2).
Table 1.
Differentially methylated regions (DMRs) identified between alcohol-naïve (AN) and low-binge drinkers (L/BDs).
| Chromosome position |
Genes within 50kb | Genomic context |
CGI context |
# CpGs | Ave methylation Δ (%) |
Sidak p-value |
| chr08:139107695- 139107753 |
TRAPPC9_2 | Genebody | Island | 7 | −13.76 | 1.18E-05 |
| chr05:135384405- 135384492 |
PKD2L2, LOC101928005, MYOT, FAM13B | Genebody | Island | 11 | 34.28 | 1.35E-05 |
| chr11:8943832- 8943895 |
MACROD1LOC101927673, OTUB1, COX8A LOC105369338, FLRT1, RNU6-45P, NAA40 |
Genebody | Island | 12 | 23.58 | 5.44E-05 |
| chr19:50234849- 50234961 |
MZF1, MZF1-AS1, CHMP2A, CENPBD1P1, TRIM28 MIR6807, ZBTB45, LOC105372486, RPL23AP79 |
Genebody | Island | 17 | −17.54 | 9.16E-05 |
| chr18:49145143- 49145202 |
CCBE1, ACTBP3, LOC105372148 | Genebody | Island | 10 | −4.91 | 1.66E-04 |
| chr06:166591697- 166591764 |
PDE10A, LOC105378115 | Promoter | Shore | 7 | 21.5 | 2.50E-03 |
| chr08:139108390- 139108427 |
TRAPPC9_3 | Genebody | Island | 5 | −13.51 | 3.92E-03 |
| chr02b:95648544- 95648601 |
FZD5, PLEKHM3, CCNYL1, MIR4775 | Promoter | Shore | 7 | −8.57 | 1.58E-02 |
| chr19:30712805- 30712856 |
FXYD5, FXYD7, FXYD1, LGI4, FXYD3, MIR6887, HPN AS1 |
Genebody | Island | 7 | −17.42 | 4.68E-02 |
Detail for each DMR: chromosome position in the MacaM genome, genes located within 50 kb of the DMR (closest gene shown in bold; using GRCh37/hg19 genome), genomic context (Genebody: intron or exon; Promoter: up to 5 kb of TSS; using GRCh37/hg19 genome), CGI context, the number of CpGs within the DMR, the average methylation difference between the comparison classes and corrected Sidak p-value for the DMR.
To clarify the potential functional roles of these DMRs, we first considered their genomic contexts. The DMRs were positioned within 7 CpG islands (CGI) and 2 CGI shores (Table 1), both locations commonly linked to transcriptional initiation (Illingworth and Bird, 2009; Sandoval et al., 2011). Next, we considered DMR context relative to gene boundaries, including gene body, promoter (up to 5kb upstream of the transcription start site, TSS) or intergenic (excluding promoters) regions. Taking advantage of the high DNA sequence similarity of rhesus macaques and humans, and the more complete human genome annotations, each macaque DMR was mapped to the orthologous human gene. Human-macaque DMR sequence conservation ranged from 90–100%, with the exception of TRAPPC9_2 that had a lower (77%) sequence homology (data not shown). Seven of the DMRs were located within a gene body (Table 1). In addition, 8 of these genes encode multiple alternative transcript variants (TVs) in the human genome, with the only exception being FZD5. Six of the DMRs are located within less than 3 kb of a 1st exon (data not shown), one DMR (MZF1) is located in an alternative 3’ exon and two DMRs (TRAPPC9_2 and _3) are located within an intron and upstream of the ncRNA PEG13. We then used the Epigenomics Roadmap database to compare the chromatin states measured in the 7 human brain regions included in the data set (hippocampus middle, substantia nigra, anterior caudate, cingulate and angular gyrus, inferior temporal lobe, dorsolateral prefrontal cortex) overlapping with the DMRs (Roadmap Epigenomics et al., 2015); NAcc analysis is not included in the database. These analyses predict that 7 DMRs coincide with transcription start site (TSS), and 2 overlap with enhancer regions (Figure 1c; Supplementary table 4). Together with the CGI and genomic context, the data suggest that the DMRs are associated with gene regulatory functions.
DMR methylation and alcohol dose
We next evaluated the relationship between alcohol consumption and differential methylation among the 9 DMR-associated genes. Two of the DMRs (PDE10A and PKD2L2) showed methylation levels that were similar in both L/BDs and H/VHDs, and were significantly different from ANs (p(PDE10A)ANvsL/BD= 0.002, p(PDE10A)ANvsH/VHD= 0.015; p(PKD2L2)ANvsL/BD= 0.003, p(PKD2L2)ANvsH/VHD= 0.004; One-way ANOVA with Bonferroni correction for multiple comparisons), suggesting that they are generally alcohol responsive (Figure 1d). In contrast, one DMR (CCBE1) identified the L/BD CpG methylation levels as significantly different from both ANs and H/VHDs (p(CCBE1)ANvsL/BD= 0.002, p(CCBE1)L/BDvsH/VHD= 0.032; One-way ANOVA with Bonferroni correction for multiple comparisons). Although the DMR associated with FZD5 only identified significantly different levels of methylation between ANs and L/BDs in the GWBS analysis (p(FZD5)ANvsL/BD= 0.009, p(FZD5)L/BDvsH/VHD= 0.087; One-way ANOVA with Bonferroni correction for multiple comparisons; Figure 1d), the targeted methylation study with an expanded number of subjects detected significant methylation differences in L/BDs as compared to both ANs and H/VHDs (p(FZD5)ANvsL/BD= 0.031, p(FZD5)L/BDvsH/VHD= 0.046; One-way ANOVA with Bonferroni correction for multiple comparisons; Figure 2c). Thus, the L/BD-specific methylation levels suggest a unique regulatory state associated with lower levels of alcohol use (Figure 1d). For 5 DMRs, the CpG methylation levels were also significantly different between ANs and L/BDs, however methylation levels among H/VHDs did not significantly differ from either of the other two groups, precluding their assignment as alcohol responsive or L/BD specific (p(MACROD1)ANvsL/BD= 0.044; p(FXYD5)ANvsL/BD= 0.017; p(MZF1)ANvsL/BD= 0.035; p(TRAPPC9_2)ANvsL/BD= 0.005; p(TRAPPC9_3)ANvsL/BD= 0.008; One-way ANOVA with Bonferroni correction for multiple comparisons; Figure 1d). Based on our study design, the CpG methylation states detected provide a snap-shot of the DNA state following 12 months of alcohol use. It is not known whether the DMRs were induced by alcohol, or rather were pre-existing epigenetic liabilities that influenced alcohol consumption. However the L/BD and H/VHD methylation levels associated with PDE10A and PKD2L2 do not coincide with those detected among ANs, suggesting that, at least, these two are alcohol-induced (Figure 1d).
Figure 2.
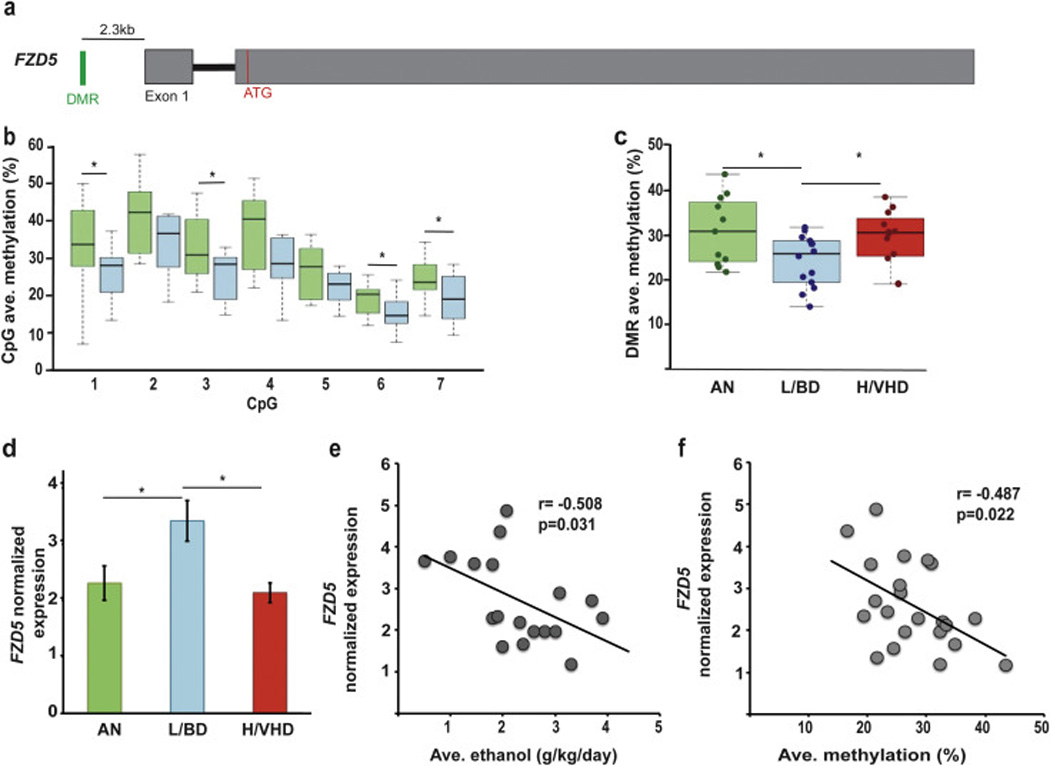
Summary of DMR location and gene structure, CpG methylation and transcript expression for FZD5. a) The two exons are represented in grey. The translation start site is represented by a red line (ATG). The DMR (green line) is located in the promoter region, approximately 2.3kb upstream of the transcription start site (TSS). b) The average methylation rate for the 8 CpGs within the DMR is shown for ANs (green boxes) and L/BDs (blue boxes) (nAN= 8, nL/BD= 7, independent t-test, p(AN-L/BD)= 0.016, c) Comparison of the average DMR methylation based on BSAS analysis: ANs shown in green (n=11), L/BDs shown in blue (n=14) and HDs shown in red (n= 12). One-way ANOVA with Bonferroni correction for multiple comparisons, p(FZD5)ANvsL/BD= 0.031, p(FZD5)L/BDvsH/VHD= 0.046. d) The relative expression of the single gene transcript is shown (nAN= 8, nL/BD= 9, nHD= 8); One-way ANOVA test with Bonferroni correction for multiple comparisons, p(AN-L/BD)= 0.022, p(L/BD-HD)= 0.013). Error bars are mean +/− SEM. e) Correlation between the average amount of alcohol and the normalized expression of FZD5. Pearson’s coefficient r= −0.508, p-value= 0.031. f) Correlation between the average DMR methylation and the normalized expression of FZD5. Pearson’s coefficient r= −0.487, p-value= 0.022.
DMRs are linked to synaptic signaling pathway genes
The DMRs identified in this study mapped to genes involved in synaptic plasticity mechanisms, such as cell adhesion (FXYD5), extracellular matrix remodeling (CCBE1), ion channels (PKD2L2), cell surface receptors (FZD5) and signaling pathways that ultimately regulate gene expression (PDE10A, MACROD1, MZF1, TRAPPC9) (Table 1). Among the DMRs identified, we selected two (PDE10A and FZD5) for validation studies based on their differing alcohol-dose patterns and their roles in two signaling pathways prominently associated with alcohol use, cAMP and Wnt, respectively. In addition, these two genes have been previously identified in alcohol studies in rodents and humans (Logrip, 2015; Wang et al., 2016), although the relationship between alcohol dose, DNA methylation and gene expression had not been described. Using BSAS and a larger sample set, we confirmed the significant DNA methylation difference between ANs, L/BDs and H/VHDs (Figure 2c; Figure 3c). The promoter location of these two DMRs suggests that they contribute to the regulation of gene expression (Table 1). Thus, we also evaluated gene expression and the potential role of DNA methylation in coordinating alternative exon usage. There was no effect of the age of the subjects on the expression levels of these two genes (One-way ANOVA, p>0.05).
Figure 3.
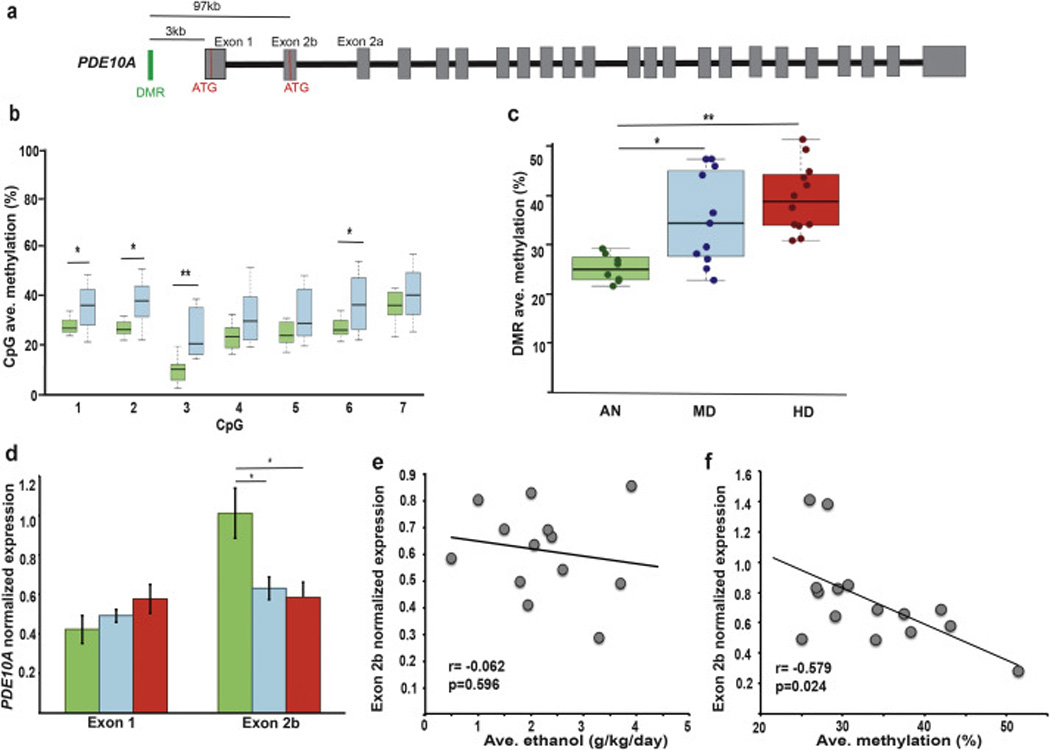
Summary of DMR location and gene structure, CpG methylation and transcript expression for PDE10A. a) The exons are represented in grey. The translation start site is represented by a red line (ATG). The DMR (green line) is located in the promoter region, approximately 3.0kb upstream of the transcription start site (TSS) of exon 1a. Exon 1b is an alternative first exon with an in-frame ATG codon. b) The average methylation rate for the 7 CpGs within the DMR is shown for ANs (green boxes) and L/BDs (blue boxes) (nAN= 8, nL/BD= 7, independent t-test, p(AN-L/BD)= 0.016). c) Comparison of the average DMR methylation based on BSAS analysis: ANs shown in green (n=9), L/BDs shown in blue (n=11) and HDs shown in red (n= 12). One-way ANOVA with Bonferroni correction for multiple comparisons, p(AN-L/BD)= 0.037; p(L/BD-HD)=0.008. d) The relative expression of TVs using either exon 1a or 1b is shown (nAN= 7, nL/BD= 8, nHD= 6; One-way ANOVA test with Bonferroni correction for multiple comparisons, exon 1b: p(AN-L/BD)= 0.026, p(AN-HD)= 0.015). Error bars are mean +/−SEM. e) Correlation between the average amount of alcohol and the normalized expression of PDE10A. Pearson’s coefficient r= −0.062, p-value= 0.596. f) Correlation between the average DMR methylation and the normalized expression of PDE10A. Pearson’s coefficient r= −0.579, p-value= 0.024.
The DMR associated with the FZD5 gene (encoding the Wnt receptor Fz5, frizzled class receptor 5) is located in the promoter, approximately 2.3kb upstream of the exon 1 (Figure 2a) of the macaque TV-201 (ENSMMUT00000019170.2 (Yates et al., 2016)). The FZD5-DMR CpGs were hypomethylated in L/BDs relative to ANs among the expanded subject set (Figure 2b). This finding was consistent with the lower average DMR methylation in L/BDs as compared not only with the ANs, but also with H/VHDs (pAN-L/BD= 0.031; pL/BD-H/VHD= 0.046, n= 37; One-way ANOVA with Bonferroni correction for multiple comparisons; Figure 2c). The finding of significant hypermethylation among H/VHDs here, and not in the GWBS, is attributed to the larger sample size. Consistent with a hypomethylated promoter and transcriptional permissive chromatin state in L/BDs relative to ANs and H/VHDs, the mRNA expression was significantly higher in the L/BDs (Figure 2d; pAN-L/BD= 0.022; pL/BD-H/VHD= 0.013, n= 26; One-way ANOVA with Bonferroni correction for multiple comparisons) and negatively correlated with the amount of alcohol consumed (r= −0.508, p= 0.031, n= 18; Pearson correlation; Figure 2e). Importantly, there was a negative association between the average DMR methylation and FZD5 expression (r= −0.487, p= 0.022, n= 22; Pearson correlation; Figure 2f), supporting a role of DNA methylation regulating FZD5 expression. The chromatin states suggest that the FZD5-DMR overlaps with a promoter region that includes predicted binding sites for transcription factors (TRANSFAC (Matys et al., 2006)) with relevance to synaptic adaptation, including C/EBP, AP-2 alpha and GR (Alberini, 2009; Park et al., 2015; Skoblenick et al., 2010).
The phosphodiesterase 10A gene, PDE10A, encodes 5 different TVs in humans (TV-001, −002, −003, −004, −201; Ensembl 84 (Yates et al., 2016), with TV-002 encoding a longer protein isoform while TV-001 contains an alternative exon 2 (exon 2b; Figure 3a) that includes an in-frame ATG start codon, encoding for a shorter isoform. The rhesus TV-201 (TV-201, MMUL 1.0 (Yates et al., 2016)) has a 96% sequence homology with the human TV-002, while the TV-001 has 98% sequence homology with the predicted macaque TVs using the alternative exon 2b (X1 (XM_015137652.1), X2 (XM_015137653.1), X3 (XM_015137654.1) and X6 (XM_015137657.1; Mmul_8.0.1; NCBI)). The DMR is located in the promoter region, 3kb upstream of exon 1 and approximately 97kb upstream of the alternative exon 2b (Figure 3a). The PDE10A–DMR is hypermethylated in L/BDs as compared with ANs (Figure 3b; n= 19, Independent t-test). In addition, the hypermethylated status extends to H/VHDs (Figure 3c; pAN-L/BD= 0.029; pAN-H/VHD= 0.001, n= 31; Kruskal-Wallis with Bonferroni correction for multiple comparisons), suggesting that methylation is modified in response to alcohol use, independently of the dose consumed. Interestingly, we did not detect a change in expression of exon 1, however, and consistent with the hypermethylated DMR, there was a significant decrease in expression of exon 2b in both L/BDs and H/VHDs (Figure 3d, pAN-L/BD= 0.026; pAN-H/VHD= 0.015, n= 26, One-way ANOVA with Bonferroni correction for multiple comparisons) that was independent of the dose of alcohol consumed (r= −0.062, p= 0.596, n= 13; Pearson correlation; Figure 3e). Indeed, the expression of exon 2b was negatively correlated with methylation level (r= −0.579, p= 0.024, n= 15; Pearson correlation; Figure 3f), suggesting a role of DNA methylation in regulating the expression of this particular exon. The chromatin states suggest that the DMR overlaps with an enhancer domain and a region repressed by the polycomb complex, suggesting that the DMR regulates the expression of alternative TVs by modulating the accessibility of transcriptional regulators, such as Sp1, C/EBP, NFAT and AP-2 alpha (Alberini, 2009; Paonessa et al., 2013; Skoblenick et al., 2010; Vihma et al., 2016), which are predicted to bind in the same region (TRANSFAC (Matys et al., 2006)).
DISCUSSION
We used a genome-wide approach to identify significant differentially methylated CpGs and regions underlying the neural state uniquely associated with chronic low/binge drinking. One of the first findings of our study is that the low/binge drinking pattern is associated with global hypomethylation relative to AN subjects, which is in contrast to the alcohol-linked hypermethylation that we identified among heavier drinkers, and has also been reported by others (Bonsch et al., 2004; Thapar et al., 2012; Wang et al., 2016). This finding suggests that there are wide-spread unique DNA methylation and gene expression profiles associated with lower alcohol use. Supporting this notion, a previous study using a subset of the same individuals included in this study identified a unique immune response in L/BDs as compared to both AN and H/VHD subjects (Messaoudi et al., 2013).
Remarkably, the L/BD regional cluster analysis identified 9 DMRs, 4 of which mapped to genes with known links to alcohol use (PDE10A, CCBE1, FZD5, MZF1) (Driver et al., 2015; Edenberg et al., 2010; Logrip, 2015; Wang et al., 2016). The other 5 DMRs map to 4 genes of relevance to synaptic signaling (PKD2L2, FXDY5, TRAPPC9, MACROD1) (Fiederling et al., 2011; Georgolios et al., 2012; Hu et al., 2005; Spanagel et al., 2014; Wu et al., 2011) although this is the first report to specifically link them to sustained levels of voluntary alcohol drinking. Moreover, expression analysis of two DMRs (PDE10A and FZD5) supports the DMRs serving a functional role in modulating alcohol-associated transcript expression. Thus our genome-wide analysis approach selectively identified highly relevant DMRs, linked genes and synaptic functions associated with low-binge drinking.
We further explored whether the DMR methylation states identified in the L/BDs differ from those associated with more severe, heavy drinking behavior (H/VHD). Interestingly, this study uncovered three different classes of DMRs. First, two DMRs (PKD2L2, PDE10A) were alcohol dose-independent with a distribution of subjects segregated from ANs, implicating mechanisms that are responsive to alcohol use in general. The polycystic kidney disease 2-like protein (encoded by PKD2L2) is a voltage-gated cation channel that regulates calcium homeostasis. While the role of Ca2+ in modulating alcohol relapse has been demonstrated both in rodents and humans (Spanagel et al., 2014), we identify, for the first time, PKD2L2 as one of the mediators linking Ca2+ and chronic alcohol use. The other alcohol dose-independent DMR mapped to PDE10A, encoding cyclic nucleotide phosphodiesterase10A, a dual-specificity phosphodiesterase able to deactivate both cAMP and cGMP. Inhibition of PDE10A activity in the dorsolateral striatum was reported to significantly reduce alcohol and saccharin self-administration in rodent models (Logrip, 2015), highlighting its role in regulating motivated behaviors. While inhibition of PDE10A in the NAcc had no effect on rodent alcohol use (Logrip et al., 2014), the contribution of alternative PDE10A TVs are unknown. Our study not only confirms the association between PDE10A with alcohol use, but it also identifies a dose-independent relationship between alcohol consumption, increased PDE10A–DMR methylation levels and a correlated decrease in exon 2b expression in the NAcc. We postulate that the downregulation of the associated PDE10A TVs contribute to maintaining the alcohol-induced high levels of cAMP/cGMP reported by others (Logrip, 2015).
Second, we identified two alcohol dose-dependent DMRs that were unique to L/BDs, mapping to the CCBE1 and FZD5 genes. The CCBE1 gene (collagen and calcium binding EGF domain 1) encodes an extracellular matrix (ECM) protein, and thus it may be involved in the control of the diffusion rates of membrane receptors, neurotransmitters and ions through the extracellular space (Dityatev and Schachner, 2003; Gundelfinger et al., 2010; Pizzorusso et al., 2002). Interestingly, a SNP variant in CCBE1 was identified within a genome-wide association study (GWAS) of alcohol dependence (Edenberg et al., 2010), suggesting a role in human alcohol use, as well. The FZD5 gene, encoding the Frizzled receptor 5, functions as a receptor for Wnt in the canonical and non-canonical pathways. In the adult brain, extensive evidence supports a critical role of the Wnt7a- and Wnt3a–Fz5 canonical pathways and the Wnt5a non-canonical Wnt/Ca2+ pathway in modulating presynaptic and postsynaptic plasticity, respectively (Dickins and Salinas, 2013; Rosso and Inestrosa, 2013; Sahores et al., 2010). Our study identifies an exclusive relationship between low-binge alcohol consumption, decreased FZD5-DMR methylation and a correlated increase in FZD5 expression. Together, and based on the unique association with L/BDs, CCBE1 and FZD5 identify mechanisms that may regulate alcohol use behaviors, for example, limiting the escalation of alcohol use.
The third class of DMRs were differentially methylated in L/BDs relative to ANs, however H/VHDs methylation rates were indistinguishable from either group. The mechanism accounting for these alcohol-dose patterns is not clear. One possibility is that DMR methylation is modulated by the lower drinking state, but the regulation of methylation dissipates with heavier alcohol use. Alternatively, the L/BD methylation state may precede alcohol use, and influence drinking behaviors. For example, the L/BD-specific DMRs map to 4 genes (FXDY5, MZF1, TRAPPC9, and MACROD1) with known roles in modulating gene expression and neural development. Accordingly, the DMR methylation may be associated with a developmentally acquired, pre-existing neural state that modulates the intoxicating effects, or diminishes the rewarding effects of alcohol. Consistent with this model, we previously demonstrated that in some of the same subjects, the alcohol-naïve pre-existing levels of MAOA expression were associated with future alcohol drinking behaviors (Cervera-Juanes et al., 2016). Genetic variants that influence site-specific CpG methylation may also contribute to the dose-specific DNA methylation patterns observed in L/BDs and H/VHDs. Studies are underway to detect genetic variants that may influence individual DMR methylation state. Alternatively, pre-existent differences in DNA methylation levels might be induced by early life experiences, or inherited through transgenerational and/or intergenerational mechanisms.
Future studies are needed to clarify the potential functional effects of these DNA methylation signals in conferring either protection or vulnerability for escalated alcohol use. Our study could be identifying a set of these pre-existent marks. For instance, cell adhesion or nuclear factor κβ (NF-κβ) signaling mechanisms. FXYD5 encodes dysadherin, an enzyme known to downregulate E-cadherin and modify cell-cell adhesion in numerous cancers (Georgolios et al., 2012; Ino et al., 2002; Mitselou et al., 2010). While E-cadherin is one of the most well studied developmental cadherins, recent reports also detected it associated with adult GABAergic synapses (Fannon and Colman, 1996; Fiederling et al., 2011). Interestingly, GWAS have repeatedly found associations between cell adhesion molecules and addiction phenotypes (Zhong et al., 2015), although this is the first report to specifically link E-cadherin to alcohol use. Three other L/BD-specific DMRs are linked to two genes, TRAPPC9 and MACROD1 (Wu et al., 2011; Hu et al., 2005), implicated in regulating the NF-κβ. In addition to the central role of NF-κβ in the control of cell survival, immunity, inflammation and synaptic plasticity (Ghosh and Hayden, 2008), chronic heavy alcohol use is known to modulate the immune system and to alter the complex interactions between NF-κβ and the glucocorticoid receptor (GR) (Szabo and Mandrekar, 2002). Importantly, NF-κβ has been associated with inflammatory peptides with chronic alcohol use in a different set of monkeys under the same self-administration protocol (Barr et al., 2016). Others have shown that moderate alcohol consumption has a protective anti-inflammatory role by inhibiting NF-κβ activation (Mandrekar et al., 2007), however our studies hint that NF-κβ mediated mechanisms may also play a role in regulating alcohol consumption. A downstream target of the AC/cAMP/PKA pathway recently identified as a target of alcohol is the transcription factor of the Kruppel family of zinc finger proteins encoded by MZF1 (Driver et al., 2015; Luo et al., 2009). While the role of MZF1 in the brain is currently unknown, it was found that ethanol interfered with the phosphorylation and transcriptional activation of MZF1 in mesenchymal stem cells, ultimately impairing bone healing (Driver et al., 2015). Our study provides the first evidence suggesting a role of MZF1 in mediating the effects of alcohol in the NAcc, as well.
Synaptic maintenance and plasticity is a complex and highly regulated phenomenon in which the three signaling pathways identified in this study (Wnt, cAMP and NF-κβ) are involved. In addition, the cross-talk across them highlights their role in contributing to the regulation of different aspects of synapse plasticity in association to alcohol use behaviors (low/binge and/or heavy drinking). For instance, synapse formation, dendritic spine morphology, synaptic receptor function, formation and proper arrangement of presynaptic active zones and postsynaptic densities at synapses, stimulation of recycling and exocytosis of synaptic vesicles (Cerpa et al., 2011; Cuitino et al., 2010; Farias et al., 2009; Sato et al., 2010; Varela-Nallar et al., 2010) are all regulated by the genes identified in this study. While the present study determined only one time-point when these synaptic mechanisms are modified relative to alcohol use, they nonetheless identify new targets for exploring mechanisms preventing accelerated alcohol use.
While this study focuses on the association between DNA methylation and lower levels of alcohol consumption, a similar approach can be used to identify DMRs that are associated specifically with heavier levels of alcohol use, or that are correlated with continuous measures of alcohol use. An additional possibility is that mid-level alcohol use is uniquely associated with DNA methylation signals, identifying additional biological mechanisms.
In summary, the globally hypomethylated nature of CpGs and DMRs among low/binge suggest a unique link between lower levels of alcohol consumption and DNA methylation in the primate brain. The role of DNA methylation in coordinating the synaptic state is supported by evidence of comparable alcohol-associated transcriptional expression patterns. Further studies are needed to clarify the functional implications of the alcohol-responsive TVs at the cellular level, and how those changes might relate to alcohol consumption behavior. Overall, the detected genes offer novel insights into potential protective and adaptive mechanisms that may influence alcohol use and dependence. In addition, the origin of these epigenetic marks (pre-existing or induced) and their role in preventing or modulating the neuroadaptations that would lead to escalated drinking requires additional investigation. These possibilities can be investigated in the macaque alcohol self-administration model by using longitudinal study designs that capture DNA methylation levels prior to and after alcohol access. While these studies cannot be conducted on the NAcc, peripheral tissues from the same subjects could be used to perform longitudinal studies. In addition, tissue derived from full siblings or from parents might also provide evidence supporting transgenerational inheritance of epigenetic signatures.
Supplementary Material
Supplementary Figure 1. Distribution of the ethanol consumption amounts and patterns during 12 months of open access. Low-moderate drinkers (L/BD, n= 16). a) Animals are ranked based on the average daily amount of ethanol consumed (g/kg/day) over 12 months. b) The percentage of days consuming more than 2g/kg of ethanol is shown in grey diamonds, and the percentage of days for which alcohol consumption was below 0.5g/kg is represented in brown squares.
Supplementary Figure 2. DNA methylation profiles of individual CpGs within the significant DMRs identified comparing AN (green) and L/BD (blue) in genome-wide screen (n=15). a) PDE10A-DMR contains 7 CpGs. b) MACROD1-DMR contains 12 CpGs. c) PKD2L2-DMR contains 11 CpGs. d) FXYD5-DMR contains 7 CpGs. e) FZD5-DMR contains 7 CpGs. f) TRAPPC9 contains two DMRs: TRAPPC9_2 is shown with a solid line (5 CpGs) and TRAPPC9_3 is shown with a dashed line (7 CpGs). g) CCBE1-DMR contains 10 CpGs. h) MZF1-DMR contains 17 CpGs.
Highlights.
Differential methylation analysis identifies genes exclusively associated with low/binge alcohol use
Low/binge methylation is linked to cell adhesion, cAMP, Wnt, and NF-κβ signaling genes
The association between DNA methylation and exon usage is reported
DNA methylation identifies mechanisms that may prevent escalating alcohol use
Acknowledgments
This study was supported by funding from the National Institute of Health: U01AA020928 (BF), U01AA013510 (KAG), R24AA019431 (KAG), OD011092 (ONPRC)
Footnotes
Publisher's Disclaimer: This is a PDF file of an unedited manuscript that has been accepted for publication. As a service to our customers we are providing this early version of the manuscript. The manuscript will undergo copyediting, typesetting, and review of the resulting proof before it is published in its final citable form. Please note that during the production process errors may be discovered which could affect the content, and all legal disclaimers that apply to the journal pertain.
CONFLICT OF INTEREST
The authors declare no conflict of interest.
AUTHOR CONTRIBUTIONS
BF and RC-J were responsible for the study concept and design. KAG provided the animal samples, and the alcohol intake data. RC-J performed DNA and RNA isolation, prepared the DNA methylation libraries and performed the mRNA expression analysis. LJW performed the bioinformatic analysis of the DNA methylation data. BP contributed statistical analysis. RC-J, LJW and BF assisted with data analysis and interpretation of findings. RC-J and BF drafted the manuscript. KAG provided critical revision of the manuscript and important intellectual contributions. All authors reviewed content and approved the final version for publication.
REFERENCES
- Alberini CM. Transcription factors in long-term memory and synaptic plasticity. Physiol Rev. 2009;89:121–145. doi: 10.1152/physrev.00017.2008. [DOI] [PMC free article] [PubMed] [Google Scholar]
- Baker EJ, Farro J, Gonzales S, Helms C, Grant KA. Chronic alcohol self-administration in monkeys shows long-term quantity/frequency categorical stability. Alcoholism, clinical and experimental research. 2014;38:2835–2843. doi: 10.1111/acer.12547. [DOI] [PMC free article] [PubMed] [Google Scholar]
- Barr T, Helms C, Grant K, Messaoudi I. Opposing effects of alcohol on the immune system. Prog Neuropsychopharmacol Biol Psychiatry. 2016;65:242–251. doi: 10.1016/j.pnpbp.2015.09.001. [DOI] [PMC free article] [PubMed] [Google Scholar]
- Bleich S, Lenz B, Ziegenbein M, et al. Epigenetic DNA hypermethylation of the HERP gene promoter induces down-regulation of its mRNA expression in patients with alcohol dependence. Alcoholism, clinical and experimental research. 2006;30:587–591. doi: 10.1111/j.1530-0277.2006.00068.x. [DOI] [PubMed] [Google Scholar]
- Bock C. Analysing and interpreting DNA methylation data. Nature reviews Genetics. 2012;13:705–719. doi: 10.1038/nrg3273. [DOI] [PubMed] [Google Scholar]
- Boda E, Pini A, Hoxha E, Parolisi R, Tempia F. Selection of reference genes for quantitative real-time RT-PCR studies in mouse brain. J Mol Neurosci. 2009;37:238–253. doi: 10.1007/s12031-008-9128-9. [DOI] [PubMed] [Google Scholar]
- Bonsch D, Lenz B, Kornhuber J, Bleich S. DNA hypermethylation of the alpha synuclein promoter in patients with alcoholism. Neuroreport. 2005;16:167–170. doi: 10.1097/00001756-200502080-00020. [DOI] [PubMed] [Google Scholar]
- Bonsch D, Lenz B, Reulbach U, Kornhuber J, Bleich S. Homocysteine associated genomic DNA hypermethylation in patients with chronic alcoholism. Journal of neural transmission. 2004;111:1611–1616. doi: 10.1007/s00702-004-0232-x. [DOI] [PubMed] [Google Scholar]
- Cedar H, Bergman Y. Linking DNA methylation and histone modification: patterns and paradigms. Nature reviews Genetics. 2009;10:295–304. doi: 10.1038/nrg2540. [DOI] [PubMed] [Google Scholar]
- Cerpa W, Gambrill A, Inestrosa NC, Barria A. Regulation of NMDA-receptor synaptic transmission by Wnt signaling. The Journal of neuroscience : the official journal of the Society for Neuroscience. 2011;31:9466–9471. doi: 10.1523/JNEUROSCI.6311-10.2011. [DOI] [PMC free article] [PubMed] [Google Scholar]
- Cervera-Juanes R, Wilhem LJ, Park B, et al. MAOA expression predicts vulnerability for alcohol use. Molecular psychiatry. 2016;21:472–479. doi: 10.1038/mp.2015.93. [DOI] [PMC free article] [PubMed] [Google Scholar]
- Chaudhri N, Sahuque LL, Schairer WW, Janak PH. Separable roles of the nucleus accumbens core and shell in context- and cue-induced alcohol-seeking. Neuropsychopharmacology : official publication of the American College of Neuropsychopharmacology. 2010;35:783–791. doi: 10.1038/npp.2009.187. [DOI] [PMC free article] [PubMed] [Google Scholar]
- Cuitino L, Godoy JA, Farias GG, et al. Wnt-5a modulates recycling of functional GABAA receptors on hippocampal neurons. The Journal of neuroscience : the official journal of the Society for Neuroscience. 2010;30:8411–8420. doi: 10.1523/JNEUROSCI.5736-09.2010. [DOI] [PMC free article] [PubMed] [Google Scholar]
- Daunais JB, Kraft RA, Davenport AT, et al. MRI-guided dissection of the nonhuman primate brain: a case study. Methods. 2010;50:199–204. doi: 10.1016/j.ymeth.2009.03.023. [DOI] [PMC free article] [PubMed] [Google Scholar]
- Davenport AT, Grant KA, Szeliga KT, Friedman DP, Daunais JB. Standardized method for the harvest of nonhuman primate tissue optimized for multiple modes of analyses. Cell and tissue banking. 2014;15:99–110. doi: 10.1007/s10561-013-9380-2. [DOI] [PMC free article] [PubMed] [Google Scholar]
- Dickins EM, Salinas PC. Wnts in action: from synapse formation to synaptic maintenance. Front Cell Neurosci. 2013;7:162. doi: 10.3389/fncel.2013.00162. [DOI] [PMC free article] [PubMed] [Google Scholar]
- Dityatev A, Schachner M. Extracellular matrix molecules and synaptic plasticity. Nature reviews Neuroscience. 2003;4:456–468. doi: 10.1038/nrn1115. [DOI] [PubMed] [Google Scholar]
- Driver J, Weber CE, Callaci JJ, et al. Alcohol inhibits osteopontin-dependent transforming growth factor-beta1 expression in human mesenchymal stem cells. J Biol Chem. 2015;290:9959–9973. doi: 10.1074/jbc.M114.616888. [DOI] [PMC free article] [PubMed] [Google Scholar]
- DSM5. The diagnostic and statistical manual of mental health [Google Scholar]
- Edenberg HJ, Koller DL, Xuei X, et al. Genome-wide association study of alcohol dependence implicates a region on chromosome 11. Alcoholism, clinical and experimental research. 2010;34:840–852. doi: 10.1111/j.1530-0277.2010.01156.x. [DOI] [PMC free article] [PubMed] [Google Scholar]
- Enoch MA, Goldman D. Problem drinking and alcoholism: diagnosis and treatment. Am Fam Physician. 2002;65:441–448. [PubMed] [Google Scholar]
- Fannon AM, Colman DR. A model for central synaptic junctional complex formation based on the differential adhesive specificities of the cadherins. Neuron. 1996;17:423–434. doi: 10.1016/s0896-6273(00)80175-0. [DOI] [PubMed] [Google Scholar]
- Farias GG, Alfaro IE, Cerpa W, et al. Wnt-5a/JNK signaling promotes the clustering of PSD-95 in hippocampal neurons. J Biol Chem. 2009;284:15857–15866. doi: 10.1074/jbc.M808986200. [DOI] [PMC free article] [PubMed] [Google Scholar]
- Fiederling A, Ewert R, Andreyeva A, Jungling K, Gottmann K. E-cadherin is required at GABAergic synapses in cultured cortical neurons. Neurosci Lett. 2011;501:167–172. doi: 10.1016/j.neulet.2011.07.009. [DOI] [PubMed] [Google Scholar]
- Georgolios A, Eleftheriadou A, Batistatou A, Charalabopoulos K. Role of the recently identified dysadherin in E-cadherin adhesion molecule downregulation in head and neck cancer. Med Oncol. 2012;29:1463–1467. doi: 10.1007/s12032-011-0118-3. [DOI] [PubMed] [Google Scholar]
- Ghosh S, Hayden MS. New regulators of NF-kappaB in inflammation. Nat Rev Immunol. 2008;8:837–848. doi: 10.1038/nri2423. [DOI] [PubMed] [Google Scholar]
- Grant KA, Leng X, Green HL, Szeliga KT, Rogers LS, Gonzales SW. Drinking typography established by scheduled induction predicts chronic heavy drinking in a monkey model of ethanol self-administration. Alcoholism, clinical and experimental research. 2008a;32:1824–1838. doi: 10.1111/j.1530-0277.2008.00765.x. [DOI] [PMC free article] [PubMed] [Google Scholar]
- Grant KA, Stafford J, Thiede A, Kiley C, Odagiri M, Ferguson B. Who is at risk? Population characterization of alcohol self-administration in nonhuman primates helps identify pathways to dependence. Alcohol research & health : the journal of the National Institute on Alcohol Abuse and Alcoholism. 2008b;31:289–297. [PMC free article] [PubMed] [Google Scholar]
- Gundelfinger ED, Frischknecht R, Choquet D, Heine M. Converting juvenile into adult plasticity: a role for the brain’s extracellular matrix. The European journal of neuroscience. 2010;31:2156–2165. doi: 10.1111/j.1460-9568.2010.07253.x. [DOI] [PubMed] [Google Scholar]
- Gutierrez-Arcelus M, Ongen H, Lappalainen T, et al. Tissue-specific effects of genetic and epigenetic variation on gene regulation and splicing. PLoS Genet. 2015;11:e1004958. doi: 10.1371/journal.pgen.1004958. [DOI] [PMC free article] [PubMed] [Google Scholar]
- Hansen KD, Langmead B, Irizarry RA. BSmooth: from whole genome bisulfite sequencing reads to differentially methylated regions. Genome biology. 2012;13:R83. doi: 10.1186/gb-2012-13-10-r83. [DOI] [PMC free article] [PubMed] [Google Scholar]
- Hietala J, West C, Syvalahti E, et al. Striatal D2 dopamine receptor binding characteristics in vivo in patients with alcohol dependence. Psychopharmac ol ogy. 1994;116:285–290. doi: 10.1007/BF02245330. [DOI] [PubMed] [Google Scholar]
- Hirth N, Meinhardt MW, Noori HR, et al. Convergent evidence from alcohol-dependent humans and rats for a hyperdopaminergic state in protracted abstinence. Proceedings of the National Academy of Sciences of the United States of America. 2016 doi: 10.1073/pnas.1506012113. [DOI] [PMC free article] [PubMed] [Google Scholar]
- Hu WH, Pendergast JS, Mo XM, et al. NIBP, a novel NIK and IKK(beta)-binding protein that enhances NF-(kappa)B activation. J Biol Chem. 2005;280:29233–29241. doi: 10.1074/jbc.M501670200. [DOI] [PMC free article] [PubMed] [Google Scholar]
- Illingworth RS, Bird AP. CpG islands--’a rough guide’. FEBS Lett. 2009;583:1713–1720. doi: 10.1016/j.febslet.2009.04.012. [DOI] [PubMed] [Google Scholar]
- Ino Y, Gotoh M, Sakamoto M, Tsukagoshi K, Hirohashi S. Dysadherin, a cancer-associated cell membrane glycoprotein, down-regulates E-cadherin and promotes metastasis. Proceedings of the National Academy of Sciences of the United States of America. 2002;99:365–370. doi: 10.1073/pnas.012425299. [DOI] [PMC free article] [PubMed] [Google Scholar]
- Ito R, Hayen A. Opposing roles of nucleus accumbens core and shell dopamine in the modulation of limbic information processing. The Journal of neuroscience : the official journal of the Society for Neuroscience. 2011;31:6001–6007. doi: 10.1523/JNEUROSCI.6588-10.2011. [DOI] [PMC free article] [PubMed] [Google Scholar]
- Kechris KJ, Biehs B, Kornberg TB. Generalizing moving averages for tiling arrays using combined p-value statistics. Stat Appl Genet Mol Biol. 2010;9 doi: 10.2202/1544-6115.1434. Article29. [DOI] [PMC free article] [PubMed] [Google Scholar]
- Krueger F, Andrews SR. Bismark: a flexible aligner and methylation caller for Bisulfite-Seq applications. Bioinformatics. 2011;27:1571–1572. doi: 10.1093/bioinformatics/btr167. [DOI] [PMC free article] [PubMed] [Google Scholar]
- LIptak T. On the combination of independent tests. Magyar Tudomanyos Akademia Matematikai Kutato Intezetenek Kozlemenyei. 1958;3:171–197. [Google Scholar]
- Logrip ML. Phosphodiesterase regulation of alcohol drinking in rodents. Alcohol. 2015 doi: 10.1016/j.alcohol.2015.03.007. [DOI] [PMC free article] [PubMed] [Google Scholar]
- Logrip ML, Vendruscolo LF, Schlosburg JE, Koob GF, Zorrilla EP. Phosphodiesterase 10A regulates alcohol and saccharin self-administration in rats. Neuropsychopharmacology : official publication of the American College of Neuropsychopharmacology. 2014;39:1722–1731. doi: 10.1038/npp.2014.20. [DOI] [PMC free article] [PubMed] [Google Scholar]
- Lovinger DM, Kash TL. Mechanisms of Neuroplasticity and Ethanol’s Effects on Plasticity in the Striatum and Bed Nucleus of the Stria Terminalis. Alcohol research : current reviews. 2015;37:109–124. [PMC free article] [PubMed] [Google Scholar]
- Lovinger DM, Roberto M. Synaptic effects induced by alcohol. Current topics in behavioral neurosciences. 2013;13:31–86. doi: 10.1007/7854_2011_143. [DOI] [PMC free article] [PubMed] [Google Scholar]
- Luo X, Zhang X, Shao W, Yin Y, Zhou J. Crucial roles of MZF-1 in the transcriptional regulation of apomorphine-induced modulation of FGF-2 expression in astrocytic cultures. Journal of neurochemistry. 2009;108:952–961. doi: 10.1111/j.1471-4159.2008.05845.x. [DOI] [PubMed] [Google Scholar]
- Luscher C, Malenka RC. Drug-evoked synaptic plasticity in addiction: from molecular changes to circuit remodeling. Neuron. 2011;69:650–663. doi: 10.1016/j.neuron.2011.01.017. [DOI] [PMC free article] [PubMed] [Google Scholar]
- Mandrekar P, Jeliazkova V, Catalano D, Szabo G. Acute alcohol exposure exerts anti-inflammatory effects by inhibiting IkappaB kinase activity and p65 phosphorylation in human monocytes. J Immunol. 2007;178:7686–7693. doi: 10.4049/jimmunol.178.12.7686. [DOI] [PubMed] [Google Scholar]
- Matys V, Kel-Margoulis OV, Fricke E, et al. TRANSFAC and its module TRANSCompel: transcriptional gene regulation in eukaryotes. Nucleic acids research. 2006;34:D108–D110. doi: 10.1093/nar/gkj143. [DOI] [PMC free article] [PubMed] [Google Scholar]
- Messaoudi I, Asquith M, Engelmann F, et al. Moderate alcohol consumption enhances vaccine-induced responses in rhesus macaques. Vaccine. 2013;32:54–61. doi: 10.1016/j.vaccine.2013.10.076. [DOI] [PMC free article] [PubMed] [Google Scholar]
- Mitselou A, Batistatou A, Nakanishi Y, Hirohashi S, Vougiouklakis T, Charalabopoulos K. Comparison of the dysadherin and E-cadherin expression in primary lung cancer and metastatic sites. Histol Histopathol. 2010;25:1257–1267. doi: 10.14670/HH-25.1257. [DOI] [PubMed] [Google Scholar]
- Paonessa F, Latifi S, Scarongella H, Cesca F, Benfenati F. Specificity protein 1 (Sp1)-dependent activation of the synapsin I gene (SYN1) is modulated by RE1-silencing transcription factor (REST) and 5’-cytosine-phosphoguanine (CpG) methylation. J Biol Chem. 2013;288:3227–3239. doi: 10.1074/jbc.M112.399782. [DOI] [PMC free article] [PubMed] [Google Scholar]
- Park HJ, Lee S, Jung JW, Kim BC, Ryu JH, Kim DH. Glucocorticoid-and long-term stress-induced aberrant synaptic plasticity are mediated by activation of the glucocorticoid receptor. Arch Pharm Res. 2015;38:1204–1212. doi: 10.1007/s12272-015-0548-0. [DOI] [PubMed] [Google Scholar]
- Paxinos GHX, Toga AW. The rhesus monkey brain in stereotaxic coordinates. San Diego: Academic Press; 1999. [Google Scholar]
- Pedersen BS, Schwartz DA, Yang IV, Kechris KJ. Comb-p: software for combining, analyzing, grouping and correcting spatially correlated P-values. Bioinformatics. 2012;28:2986–2988. doi: 10.1093/bioinformatics/bts545. [DOI] [PMC free article] [PubMed] [Google Scholar]
- Pizzorusso T, Medini P, Berardi N, Chierzi S, Fawcett JW, Maffei L. Reactivation of ocular dominance plasticity in the adult visual cortex. Science. 2002;298:1248–1251. doi: 10.1126/science.1072699. [DOI] [PubMed] [Google Scholar]
- Roadmap Epigenomics C, Kundaje A, Meuleman W, et al. Integrative analysis of 111 reference human epigenomes. Nature. 2015;518:317–330. doi: 10.1038/nature14248. [DOI] [PMC free article] [PubMed] [Google Scholar]
- Robinson MD, Kahraman A, Law CW, et al. Statistical methods for detecting differentially methylated loci and regions. Front Genet. 2014;5:324. doi: 10.3389/fgene.2014.00324. [DOI] [PMC free article] [PubMed] [Google Scholar]
- Rosso SB, Inestrosa NC. WNT signaling in neuronal maturation and synaptogenesis. Front Cell Neurosci. 2013;7:103. doi: 10.3389/fncel.2013.00103. [DOI] [PMC free article] [PubMed] [Google Scholar]
- Sahores M, Gibb A, Salinas PC. Frizzled-5, a receptor for the synaptic organizer Wnt7a, regulates activity-mediated synaptogenesis. Development. 2010;137:2215–2225. doi: 10.1242/dev.046722. [DOI] [PMC free article] [PubMed] [Google Scholar]
- Sandoval J, Heyn H, Moran S, et al. Validation of a DNA methylation microarray for 450,000 CpG sites in the human genome. Epigenetics : official journal of the DNA Methylation Society. 2011;6:692–702. doi: 10.4161/epi.6.6.16196. [DOI] [PubMed] [Google Scholar]
- Sato N, Yamabuki T, Takano A, et al. Wnt inhibitor Dickkopf-1 as a target for passive cancer immunotherapy. Cancer Res. 2010;70:5326–5336. doi: 10.1158/0008-5472.CAN-09-3879. [DOI] [PubMed] [Google Scholar]
- Siciliano CA, Calipari ES, Cuzon Carlson VC, et al. Voluntary ethanol intake predicts kappa-opioid receptor supersensitivity and regionally distinct dopaminergic adaptations in macaques. The Journal of neuroscience : the official journal of the Society for Neuroscience. 2015;35:5959–5968. doi: 10.1523/JNEUROSCI.4820-14.2015. [DOI] [PMC free article] [PubMed] [Google Scholar]
- SIdak Z. Rectangular confidence region for the means of multivariate normal distributions. J Am Stat Assoc. 1967;62:626–633. [Google Scholar]
- Skoblenick KJ, Argintaru N, Xu Y, et al. Role of AP-2alpha transcription factor in the regulation of synapsin II gene expression by dopamine D1 and D2 receptors. J Mol Neurosci. 2010;41:267–277. doi: 10.1007/s12031-009-9299-z. [DOI] [PubMed] [Google Scholar]
- Spanagel R, Vengeliene V, Jandeleit B, et al. Acamprosate produces its anti-relapse effects via calcium. Neuropsychopharmacology : official publication of the American College of Neuropsychopharmacology. 2014;39:783–791. doi: 10.1038/npp.2013.264. [DOI] [PMC free article] [PubMed] [Google Scholar]
- Stouffer SA. The American soldier. Vol. 1. Princeton, NJ: Princeton University Press; 1949. [Google Scholar]
- Szabo G, Mandrekar P. Ethanol-mediated regulation of transcription factors in immunocompetent cells. Front Biosci. 2002;7:a80–a89. doi: 10.2741/A742. [DOI] [PubMed] [Google Scholar]
- Team RC. R: A language and environment for statistical computin. 2014 [Google Scholar]
- Terry MB, Delgado-Cruzata L, Vin-Raviv N, Wu HC, Santella RM. DNA methylation in white blood cells: association with risk factors in epidemiologic studies. Epigenetics : official journal of the DNA Methylation Society. 2011;6:828–837. doi: 10.4161/epi.6.7.16500. [DOI] [PMC free article] [PubMed] [Google Scholar]
- Thapar M, Covault J, Hesselbrock V, Bonkovsky HL. DNA methylation patterns in alcoholics and family controls. World journal of gastrointestinal oncology. 2012;4:138–144. doi: 10.4251/wjgo.v4.i6.138. [DOI] [PMC free article] [PubMed] [Google Scholar]
- Varela-Nallar L, Alfaro IE, Serrano FG, Parodi J, Inestrosa NC. Wingless-type family member 5A (Wnt-5a) stimulates synaptic differentiation and function of glutamatergic synapses. Proceedings of the National Academy of Sciences of the United States of America. 2010;107:21164–21169. doi: 10.1073/pnas.1010011107. [DOI] [PMC free article] [PubMed] [Google Scholar]
- Vihma H, Luhakooder M, Pruunsild P, Timmusk T. Regulation of different human NFAT isoforms by neuronal activity. Journal of neurochemistry. 2016;137:394–408. doi: 10.1111/jnc.13568. [DOI] [PubMed] [Google Scholar]
- Volkow ND, Wang GJ, Maynard L, et al. Effects of alcohol detoxification on dopamine D2 receptors in alcoholics: a preliminary study. Psychiatry research. 2002;116:163–172. doi: 10.1016/s0925-4927(02)00087-2. [DOI] [PubMed] [Google Scholar]
- Wang F, Xu H, Zhao H, Gelernter J, Zhang H. DNA co-methylation modules in postmortem prefrontal cortex tissues of European Australians with alcohol use disorders. Sci Rep. 2016;6:19430. doi: 10.1038/srep19430. [DOI] [PMC free article] [PubMed] [Google Scholar]
- WHO. Global status report on alcohol and health. WHO. 2002 [Google Scholar]
- Wu Z, Li Y, Li X, et al. LRP16 integrates into NF-kappaB transcriptional complex and is required for its functional activation. PloS one. 2011;6:e18157. doi: 10.1371/journal.pone.0018157. [DOI] [PMC free article] [PubMed] [Google Scholar]
- Yates A, Akanni W, Amode MR, et al. Ensembl 2016. Nucleic acids research. 2016;44:D710–D716. doi: 10.1093/nar/gkv1157. [DOI] [PMC free article] [PubMed] [Google Scholar]
- Zhong P, Liu Y, Hu Y, Wang T, Zhao YP, Liu QS. BDNF interacts with endocannabinoids to regulate cocaine-induced synaptic plasticity in mouse midbrain dopamine neurons. The Journal of neuroscience : the official journal of the Society for Neuroscience. 2015;35:4469–4481. doi: 10.1523/JNEUROSCI.2924-14.2015. [DOI] [PMC free article] [PubMed] [Google Scholar]
- Zhou FC, Anthony B, Dunn KW, Lindquist WB, Xu ZC, Deng P. Chronic alcohol drinking alters neuronal dendritic spines in the brain reward center nucleus accumbens. Brain research. 2007;1134:148–161. doi: 10.1016/j.brainres.2006.11.046. [DOI] [PMC free article] [PubMed] [Google Scholar]
- Zimin AV, Cornish AS, Maudhoo MD, et al. A new rhesus macaque assembly and annotation for next-generation sequencing analyses. Biol Direct. 2014;9:20. doi: 10.1186/1745-6150-9-20. [DOI] [PMC free article] [PubMed] [Google Scholar]
Associated Data
This section collects any data citations, data availability statements, or supplementary materials included in this article.
Supplementary Materials
Supplementary Figure 1. Distribution of the ethanol consumption amounts and patterns during 12 months of open access. Low-moderate drinkers (L/BD, n= 16). a) Animals are ranked based on the average daily amount of ethanol consumed (g/kg/day) over 12 months. b) The percentage of days consuming more than 2g/kg of ethanol is shown in grey diamonds, and the percentage of days for which alcohol consumption was below 0.5g/kg is represented in brown squares.
Supplementary Figure 2. DNA methylation profiles of individual CpGs within the significant DMRs identified comparing AN (green) and L/BD (blue) in genome-wide screen (n=15). a) PDE10A-DMR contains 7 CpGs. b) MACROD1-DMR contains 12 CpGs. c) PKD2L2-DMR contains 11 CpGs. d) FXYD5-DMR contains 7 CpGs. e) FZD5-DMR contains 7 CpGs. f) TRAPPC9 contains two DMRs: TRAPPC9_2 is shown with a solid line (5 CpGs) and TRAPPC9_3 is shown with a dashed line (7 CpGs). g) CCBE1-DMR contains 10 CpGs. h) MZF1-DMR contains 17 CpGs.