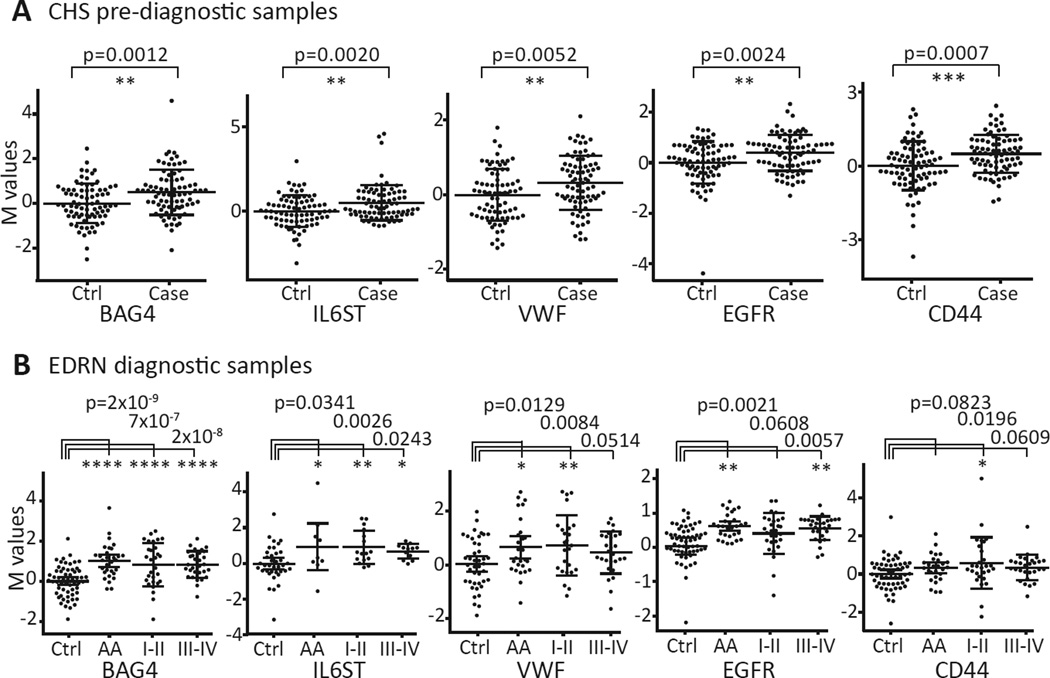
Figure 3. Performance of prediagnostic marker panel members BAG4, IL6ST, VWF, EGFR, and CD44 in prediagnostic and diagnostic sample sets.
Adjusted M value plots with mean and standard deviation indicated for BAG4, IL6ST, VWF, EGFR and CD44 show statistically significantly higher levels in the cases of (A) the CHS and (B) EDRN sample sets (*, p<0.05; **, p<0.01; ***, p<0.001; ****, p<0.0001).

