

Abstract
Background/Aim: To unveil the pathophysiology of primary hyperparathyroidism, molecular details of parathyroid hyperplasia and adenoma have to be revealed. Such details will provide the tools necessary for differentiation of these two look-alike diseases. Therefore, in the present study, a comparative proteomic study using postoperative tissue samples from the parathyroid adenoma and parathyroid hyperplasia patients was performed. Materials and Methods: Protein extracts were prepared from tissue samples (n=8 per group). Protein pools were created for each group and subjected to DIGE and conventional 2DE. Following image analysis, spots representing the differentially regulated proteins were excised from the and used for identification via MALDI-TOF/TOF analysis. Results: The identities of 40 differentially-expressed proteins were revealed. Fourteen of these proteins were over-expressed in the hyperplasia while 26 of them were over-expressed in the adenoma. Conclusion: Most proteins found to be over-expressed in the hyperplasia samples were mitochondrial, underlying the importance of the mitochondrial activity as a potential biomarker for differentiation of parathyroid hyperplasia from adenoma.
Keywords: Parathyroid gland, Parathyroid hyperplasia, Parathyroid adenoma, proteomics, 2DE, MALDI-TOF/TOF
Primary hyperparathyroidism (PHPT) is a common endocrine disease characterized by overproduction of parathyroid hormone (PTH) and an increased serum calcium levels. Most of the PHPT cases are sporadic (>90%) and caused either by a single benign gland (parathyroid adenoma, PA) (80-85%), or by multiple glands that are consisted of multiple adenomas, or by hyperplasia of all four glands (20-15%) (1,2). There are also hereditary cases caused by rare carcinomas e.g., Multiple Endocrine Neoplasia (MEN) types and Hyperparathyroidism-jaw tumor syndrome (HPT-JT) making the classification of PHPT more complicated (<1%) (3-5).
Although studies performed on parathyroid tumor formation at the genetic level have improved our understanding of tumor development (6,7), knowledge on parathyroid adenomas (PA) and hyperplasia (PH) is limited due to lack of extensive studies. Revealing the differences between hyperplasia and adenoma can be important in understanding of the parathyroid disorders. Several genes and epigenetic changes have been implicated in sporadic and hereditary forms of PHPT, but these cases cover only 1% of total observed cases (8-11). The Majority of cases are sporadic and there is no genetic background attached to them. In addition to the genetic studies, proteomic studies are also needed. There are two major studies evaluated the changes at the proteome level in comparison to healthy controls in PA (12,13). A list of differentially-regulated proteins generated by these studies is useful to reveal the metabolic pathways that may play roles in transformation to PA. There is no study evaluating the changes occurring at the proteome level in PH. Selective differentiation of parathyroid tissue into either adenoma or hyperplasia is still not known. Studies focused on this aspect will probably not only yield some answers at the molecular level, but also end-up creating novel approaches for clear differentiation of the PA from the PH. Such differentiation would reduce the operation time, improve therapeutic results, and in case of solitary tumors spare the patient from bilateral neck exploration.
The current standards of practice in pathology fail to differentiate the PA from the PH. Many pathologists are unwilling to distinguish between these two cases because of the known high rate of clinical error. However, the distinction is crucial to make for choosing the right therapy because PA requires removal of a single gland while the PH needs the excision of multiple glands. Accidental removal of thyroid glands due to misdiagnosis of adenoma as hyperplasia can have damaging effect on PTH and calcium metabolism. There are efforts for differentiation of these two conditions at the molecular level using microarray technology (14). In that study, a clear distinction of the cases of multiple gland hyperplasia from the cases of parathyroid adenoma is achieved when an unsupervised clustering by principle component analysis was performed. The study provided a list of potential biologically relevant genes in sporadic parathyroid neoplasia. Parathyroid adenomas showed under- or over-expression of a number of genes involved in DNA repair and cell cycle progression.
In this study, we performed a comparative proteomic analysis to evaluate the differentially expressed proteins between PA and PH. The main method of choice in this study was 2D gel electrophoresis (2DE) followed by MALDI TOF-TOF MS. The experiments were repeated with the same samples using a more reliable less prone-to-variation DIGE approach. The data from 2DE and DIGE experiment were combined and co-analyzed. A total of 40 proteins whose levels have changed were identified. Among the identified proteins, majority were mitochondrial and up-regulated in PH. This finding shifted our attention to the changes in mitochondrial metabolism and led us propose that a novel mitochondrial marker may be discovered to differentiate PH from PA.
Materials and Methods
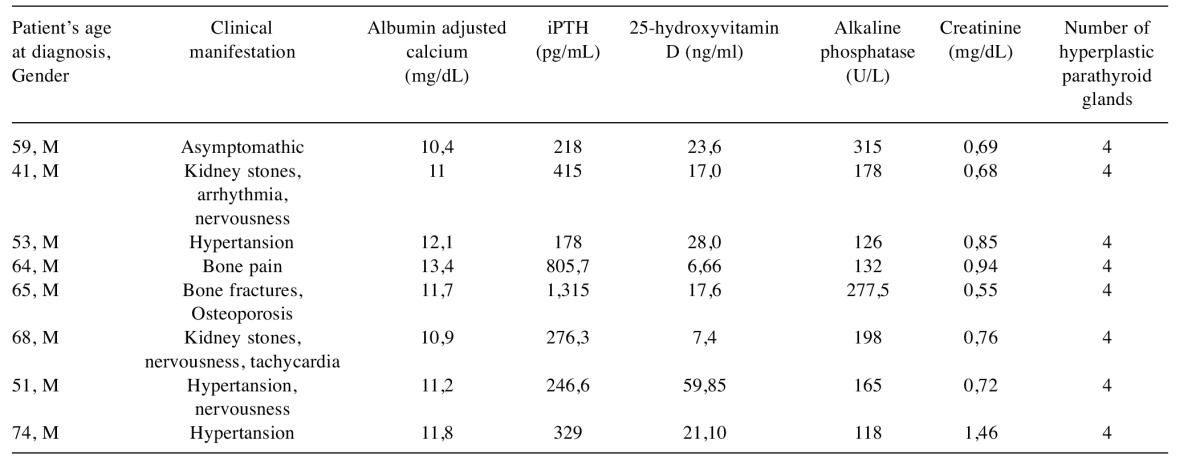
Patients. The study was conducted at the Kocaeli University Medical School, Turkey. Informed consents, approved by the institutional ethics committee, were obtained from each patient. We only included patients with histopathologically confirmed single parathyroid adenomas and parathyroid hyperplasia. All patients were monitored at the Department of General Surgery of the Kocaeli University and underwent paratyroidectomy for management of PHPT. Tissue samples from eight PA patients and eight PH patients with sporadic PHTP were used in this study. The patient selection criteria included, (i) no family history for PHPT, (ii) during and after follow-up, no evidence of recurrent disease. Tissues were removed during parathyroidectomy, immediately snap-frozen in liquid nitrogen and stored at –80˚C until use. The clinical and biochemical properties of the patients were summarized in Table I and Table II.
Table I. Clinical and biochemical characteristics of the patients with sporadic parathyroid adenomas.
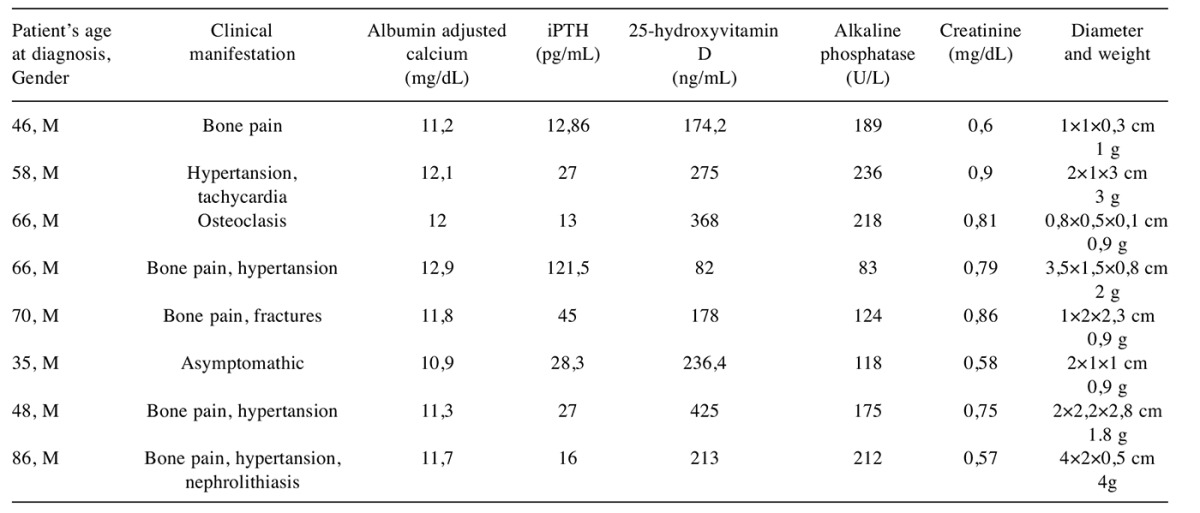
Table II. Clinical and biochemical characteristics of the patients with parathyroid hyperplasia.
Protein extraction. Tissue samples from both PH and PA patients were minced on ice and washed with ample amount of ice-cold washing buffer (10 mMTris-HCl, pH 7.0, 250 mM sucrose) for three times to remove excess blood . After 10 min centrifugation at 4˚C at 2,000 × g, excess wash buffer was decanted and 250 μl of a buffer containing 7 M urea, 2 M thiourea, 4% CHAPS, 30 mMTris pH 8.5, and 1x protease inhibitor cocktail was added over each tissue pellet. The tissue pellets were lysed using 0.5 mm stainless steel beads with the help of a homogenizer (Next Advance, Averill Park, NY, USA) at 4˚C. The supernatant containing the soluble protein extract was obtained by centrifugation at 20,000 × g for 30 min at 4˚C. Protein concentration was determined using Bradford assay with the BSA standard (BioRad, Hercules, CA, USA). The soluble protein containing supernatants were stored in Lo-bind tubes (Eppendorf, Hamburg, Germany) at −80˚C until analysis.
Preparation of pooled samples. Equal amount of protein from each sample was combined into a single tube and protein concentration was re-measured. The protein concentration estimated by the measurement was compared with the calculated protein concentration to validate that samples were correctly pooled. Further validation was achieved using SDS-PAGE followed by visual examination of the protein profiles.
Two-dimensional gel electrophoresis (2DE). For the first-dimensional separation via isoelectric focusing (IEF), 750 μg from each pooled protein sample was loaded onto immobilized pH gradient strips (IPG) (17 cm, pH 3-10) via passive rehydration at 20˚C for 16 h. Isoelectric focusing was performed using Protean isoelectric focusing cell (BioRad). The strips were run through a stepwise incremental voltage program (250V for 30 min (linear), 4,000 V for 2.5 h (linear) and 40,000 V/h (rapid)). The plate temperature was maintained at 20˚C. The strips were then subjected to a two-step equilibration in equilibration buffers containing 6M urea, 2% SDS, 0.375M Tris-HCl pH 8.8, 20% glycerol and 2% DTT for the first step and the same buffer without DTT but with iodoacetamide (2.5%) for the second step with 20 min gentle shaking. Following equilibration steps, the IPG strips were rinsed with SDS-PAGE running buffer and loaded directly onto 1mm-thick 12% in-house made SDS-polycarylamide gels. The second dimension separation was accomplished by using Dodeca gel running sysytem (BioRad). This system can handle up to 12 gels in a single run and minimizes gel-to-gel variation. Electrophoresis was carried out at 16˚C at 45 mA/gel until the front dye reached the bottom of the gels. The gels were stained with ProteofastCoomassie stain (DEKART, Kocaeli,Turkey). Triplicate gels were produced for each sample.
Minimal protein labeling and DIGE. For DIGE experiments, protein samples were prepared in minimal DIGE lysis buffer (7 M urea, 2 M thiourea, 4% CHAPS w/v, 30 mM Tris-HCl, pH 8.5) and equal amounts of proteins were pooled for each group as described above. DIGE-specific Cy2, Cy3, and Cy5 dyes (GE Health Care, Pittsburgh, PA, USA) were used for labeling of 50 μg pooled protein sample in each experiment. The pH of each sample was adjusted to 8.5 before labeling. Experimental set up for differential labeling of the pooled samples for DIGE analysis was summarized in Table III. The reactions were stopped by adding 1.0 μl of 10 mM lysine. After labeling, the labeled protein samples were mixed and the volume of the mixture was completed to 250 μl using 2DE buffer. Conditions similar to 2DE were used for the first and second dimension separations.
Table III. Experimental set up for differential minimal CyDye labeling of soluble tissue protein extracts for DIGE analysis.
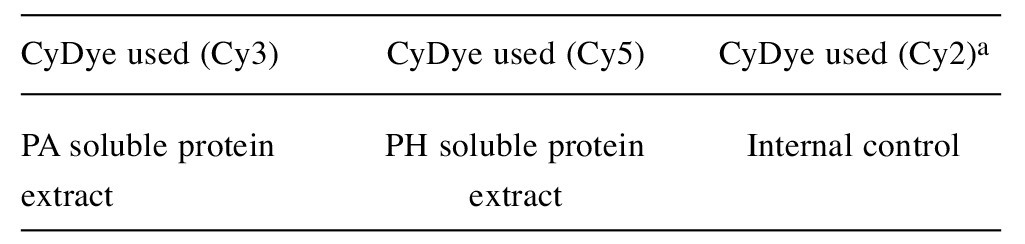
aInternal controls were created by mixing equal amount of samples and used for normalization
Image analysis of 2DE and DIGE gels. The conventional 2DE gels were visualized with VersaDoc MP4000 (BioRad) and PDQuest 2DE Analysis Software (BioRad) was used for spot intensity calibration, spot detection, and background substraction. Three separate gels were run for each pooled group to minimize experimental variation. Stain speckles were filtered and the standardized areas of interest from all gels were warped and matched and the quantity of each spot was normalized by the total valid spot intensity using linear regression model. The statistical significance of image analysis was determined by the Student’s t-test (statistical level of p<0.05 is significant). Gel spots significantly differed in expression (more than 2-fold) were selected and excised from gels using ExQuest Spot-cutter (Bio-Rad, USA) for protein identification. A manual editing tool was used to inspect the determined protein spots detected by the software. Means and standard deviations (SD) were calculated from three independent experiments, and paired Student’s t-tests were used to assess differences in the average protein abundance between the gels. 2D gel image comparison, protein spot intensities with more than two-fold significant-change (p<0.05) in a consistently increased or decreased pattern were considered differentially expressed.
DIGE gels were also visualized with VersaDoc MP4000 (BioRad) by using three different light sources. After automatic spot detection by using PDQuest Analysis Software (BioRad) spots were manually revised with edition tools to prevent mismatches. Spot picking was performed using a preparative 2D gel, which was stained with ProteofastCoomassie stain (DEKART), visualized, and aligned with the DIGE reference image to outline the spots of interest selected in the DIGE analysis. All selected spots were excised using an automated spot cutting tool, ExQuest spot (BioRad), and disposed into 96-well plates for identification.
Inter-experimental comparison between 2DE and DIGE experiments. To perform an inter-experimental comparison between the conventional 2DE and DIGE experiments, “the compare experiment wizard” implemented in PD-Quest Advance software was used. Two master gels created during analysis of the gel images from each independent experimental study were compared and the overlapping differentially regulated protein spots were cut and identified by MALDI-TOF/TOF analysis.
Protein identification by MALDI-TOF/TOF. Protein identification experiments were performed at Kocaeli University DEKART Proteomics Laboratory using ABSCIEX MALDI-TOF/TOF 5800 system (Applied Biosystems, Framingham, MA, USA). Spots of interest were cut from the gels and subjected to in-gel tryptic digestion by using an in-gel digestion kit following the recommended protocol by the manufacturer (Pierce, Thermo Fisher, MA, USA). Before deposition onto a MALDI plate, all samples were desalted with a 10 μl ZipTipC18 (Millipore, Darmstadt, Germany). Peptides were eluted in a volume of 1 μl using a concentrated solution of α-CHCA in 50% acetonitrile and 0.1% trifluoroacetic acid in water and spotted onto the MALDI target plate. The TOF spectra were recorded in the positive ion reflector mode with a mass range from 400 to 2000 Da. Each spectrum was the cumulative average of 2000 laser shots. The spectra were calibrated with the trypsin autodigestion ion peaks m/z (842.510 and 2211.1046) as internal standards. Ten of the strongest peaks of the TOF spectra per sample were chosen for MS/MS analysis. All of the PMFs were searched in the MASCOT version 2.5 (Matrix Science, Boston, MA, USA) by using a streamline software, Protein Pilot (Applied Biosystems, Framingham, MA, USA), with the following criteria: SWISSPROT database; species restriction to H. sapiens; enzyme of trypsin; at least ten independent peptides matched; at most one missed cleavage site; MS tolerance set to ±50 ppm and MS/MS tolerance set to ±0.2 Da; fixed modification being carbamidomethyl (Cys) and variable modification being oxidation (Met); peptide charge of +1 and being monoisotopic. Only significant hits, as defined by the MASCOT probability analysis (p<0.05), were accepted.
Validation of differentially-regulated proteins by western blot analysis. Fifteen μg protein were loaded to each well from the pooled protein samples. To represent each group (PA and PH) four wells were loaded and standard deviation was calculated based on intensities of the bands of each well. The proteins were separated on 12% SDS-PAGE gels, and transferred onto nitrocellulose membranes. To prevent nonspecific bindings, the membranes were blocked for 1 h at room temperature in 5% nonfat dried milk, 1% (v/v) Tween 20 in TBS (50 mMTris, 150 mMNaCl, adjust pH with HCl to pH 7.6). After blocking, the membranes were incubated overnight at 4˚C with appropriately diluted monoclonal primary antibodies in TBS-T against HSP60 (CH60) (1:2,000, Santa Cruz, TX, USA, sc-59566), LMNA/C (1:1000, Santa Cruz, sc-56140), HNRNPH1 (1:1,000, Abcam, ab10374), β-Actin (1:2,500, Santa Cruz, sc-8432), UCHL-1 (1:5000, Pierce, MAI-46079) and OXPHOS cocktail (1:1,000, Abcam, Cambridge, UK, ab110411). β-Actin was used as an internal control of each protein sample to ensure equal protein loading. The membranes were visualized with the ECL detection system (BioRad) by using X-ray films and the VersaDoc imaging system (BioRad). The bands were quantified by using Quantity One 1D image analysis software (BioRad).
Statistical analysis. Quantitative results were expressed as means±standard deviation. Two-sample t-tests assuming unequal variances were used for the statistical analyses (SPSS 18.0, IBM Corporation, Armonk, NY, USA) p<0.05 was considered statistical significant.
Bioinformatics analysis. Protein-protein interaction (PPI) network of the identified proteins was constructed with the online analysis tool STRING v10.0 (http://www.string-db.org) (15). Classification of the proteins based on biological processes and molecular functions was performed by using a freely available classification system PANTHER (version 11.0 Released 2016-07-15, http://www.pantherdb.org/), NCBI and SWISSPROT data banks. Assignment of biological processes and subsequent construction of networks were carried out using the Ingenuity software (Ingenuity Systems, www.ingenuity.com).
Results
Comparative 2DE analysis. The differences between parathyroid hyperplasia and adenoma were analyzed using the changes in global protein expression profiles. Figure 1 summarizes the experimental approaches used in this study. An average of 1,224±129 and 1,316±175 protein spots were detected on 2DE gels prepared from PA and PH protein extracts, respectively. The number of spots that reliably matched between two groups was 973. The rest of the spots were either not matched or were not detected in all replicative gels.
Figure 1. Summary of the experimental approaches used in this study. (A) The gel images from the Coomassie-stained and DIGE experiments. (B) The in silico produced master gel images for comparison of 2DE vs DIGE experiments. (C) Venn diagram depicting common protein spots for the 2DE and DIGE gels. The common spots were identified by MALDI-TOF/TOF analysis.

Changes in spot intensities were compared among the matching spots and 75 regulated proteins were detected. Our findings showed that 60% of the proteins were up-regulated in PA group while there was only 40% were up-regulation in the PH group. Figure 2 shows the histogram of the percentage volumes of the proteins found in different quantities in PH compared to PA samples, while a selection of differentially expressed proteins is depicted on enlarged gel images.
Figure 2. Enlarged images of the selected 2D gel spots to highlight the differential expression. The percent volumes of the identified proteins in PA and PH groups. The values for the bar graphs from the comperative 2DE gel analysis experiment via PDQuest Advance software.

Comparative DIGE analysis. Although, the classical 2D approach is a golden standard for comparative proteomic analysis, it has some intrinsic limitations e.g., high percentage of gel-to-gel variations (16-18). To overcome the limitations of classical 2DE, the use of DIGE has been recommended (19,20). Therefore, we also performed DIGE experiments and produced three images representing PA, PH and the internal control (formed by equal mixing of PA and PH) (Figure 8). Superimposition of the images generated an overlay image containing 738 protein spots. Comparison of the color intensities using an imaging software revealed the presence of 53 regulated protein spots. Fifty seven percent of these spots were up-regulated in PA and 43% were up-regulated in PH.
Figure 8. Representative gel images of DIGE experiments.

Independent 2D-DIGE analysis confirmed differentially-regulated proteins between PA and PH. The question was asked whether the regulated protein spots observed in the classical 2DE experiment matched the regulated protein spots observed in the DIGE experiment. An in silico experiment was performed using the images of 2DE and the images of DIGE to perform a comparative analysis. Fifty of the 75 protein spots that were regulated by 2DE were also detected by DIGE. Those spots were excised from a preparative gel (Figure 3) and subjected to MALDI TOF/TOF analysis and forty of them were identified with high confidence (Table IV).
Figure 3. Representative 2DE maps of PH (A) and PA (B) sample proteins. Spot numbers (SSP numbers) indicate the proteins identified by MALDI TOF/TOF MS and refer to the numbers reported in Table IV.

Table IV. Identified up-regulated proteins by MALDI TOF/TOF-MS in PA and PH groups.
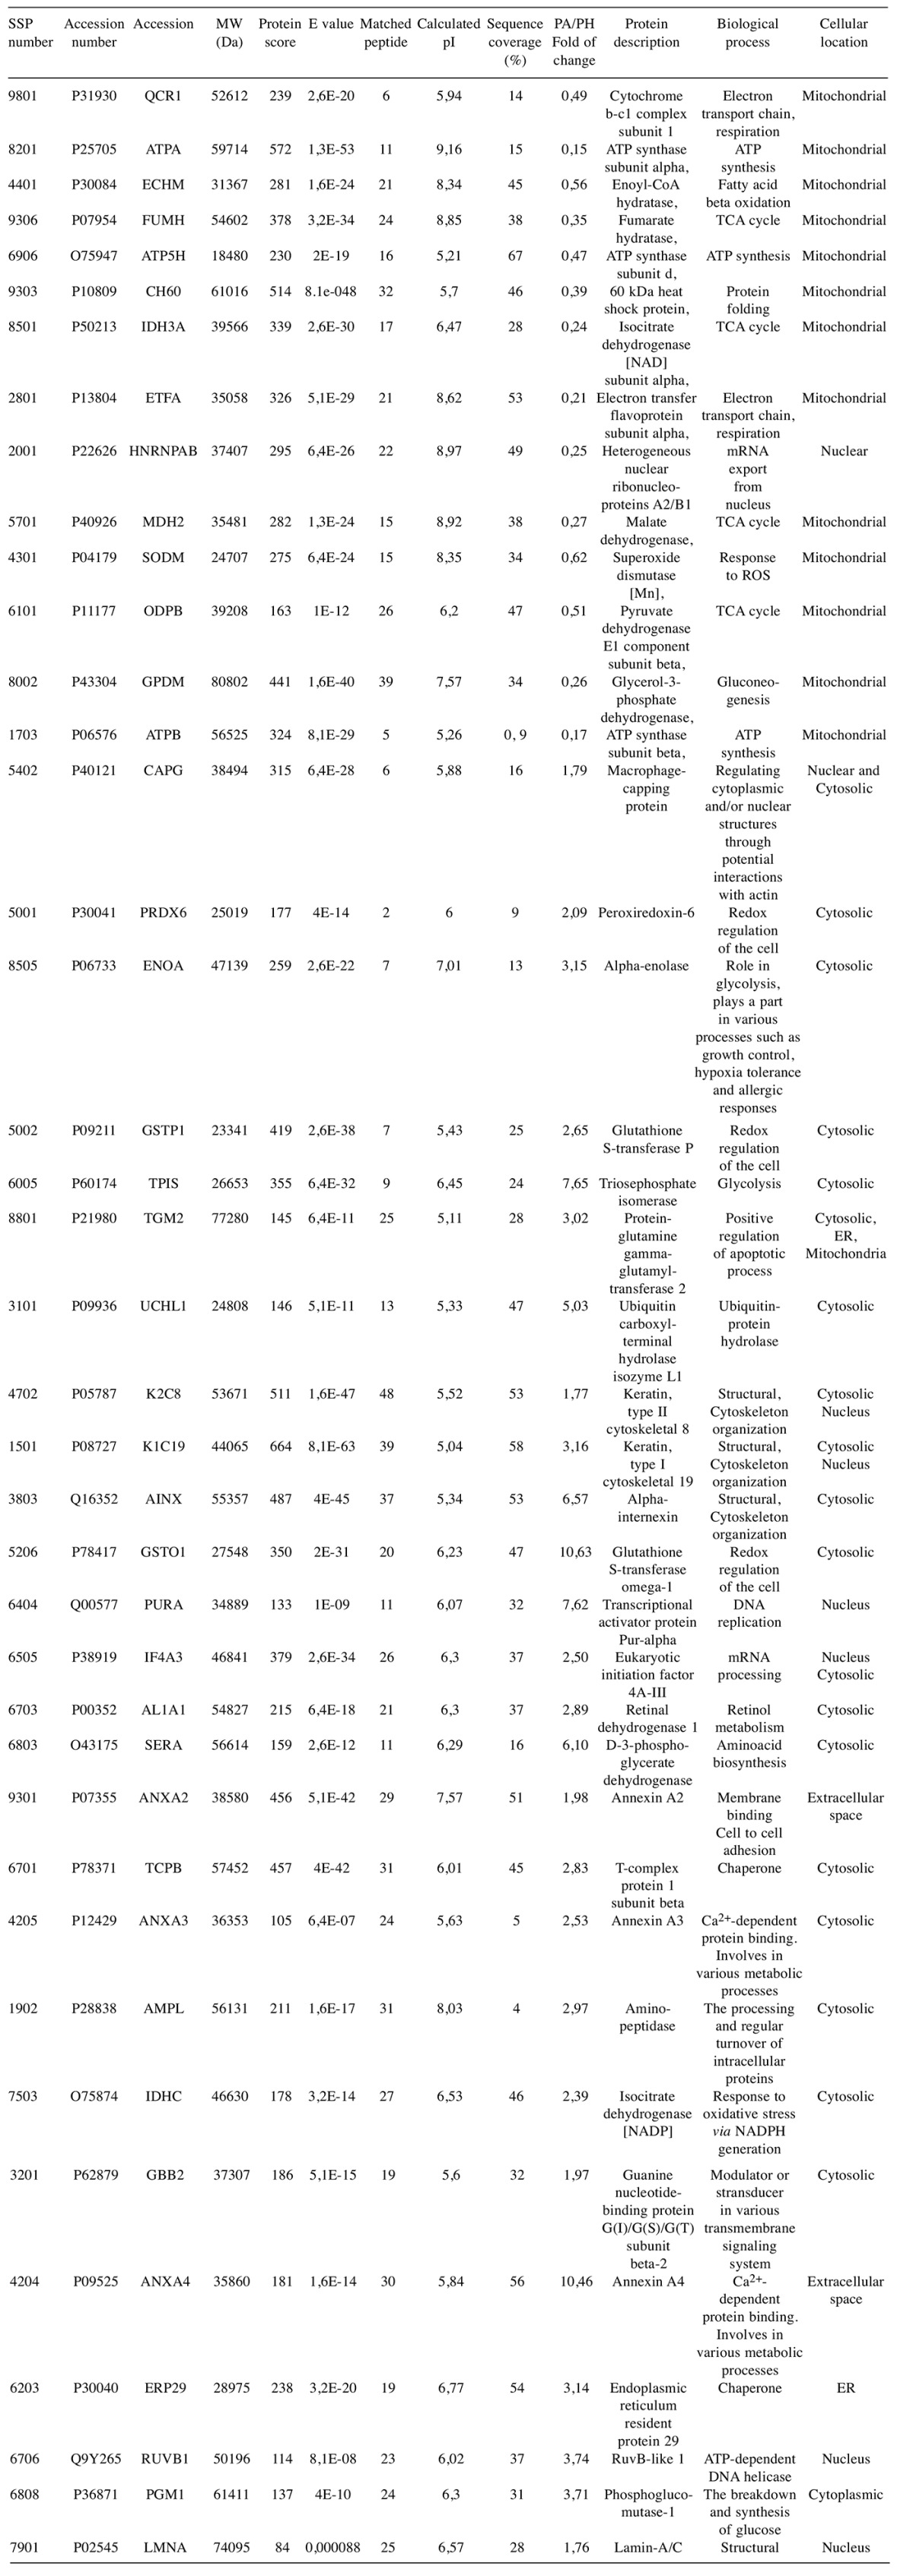
Functional analysis of differentially-regulated proteins. Rather than comparing one group to the other and determine up and down regulated proteins, we focused on the up-regulated protein spots in each group with respect to each other. By this way, we might demonstrate the changes in major metabolic pathways and directly connect them to disease-associated mechanisms. The functional classification of the up-regulated proteins was achieved using Uniprot and PANTHER databases and is summarized in Figure 4A. It was interesting to see that 85% of the differentially up-regulated proteins in the PH group was associated with energy metabolism and they were all mitochondrial proteins. There were two proteins that did not take role in energy metabolism, although one of those proteins, SOD(Mn), is located in the mitochondria. On the contrary to the PH group, there was no uniform pattern detected for the upregulated proteins in the PA group (Figure 4B). Some proteins play role in energy metabolism, some are responsible for the cellular redox balance and some others are crucial for structural integrity. The localizations of these proteins were also varied, although most of them were cytoplasmic.
Figure 4. Functional and localization analysis of the up-regulated proteins. (A) Pie charts representing functional categorization of the identified up-regulated proteins for the PA and the PH groups. (B) Pie charts representing cellular localization for the identified up-regulated proteins for the PA and the PH groups.

PPI analysis of identified proteins. The STRING analysis revealed the functional links among the differentially identified proteins in the PA and the PH groups. There was a meaningful clustering of the up-regulated proteins in the PH group. Each protein formed a link creating an overall network pointing to the changes occurring in the energy metabolism. One way to test this change is to monitor the changes occurring in mitochondrial complexes via western blotting using an antibody mixture called OXPHOS. The western blot analysis with OXPHOS antibody mixture showed the presence of an increasing trends in mitochondrial content towards PH (Figure 5). On the other hand, the up-regulated proteins in the PA group failed to form a meaningful clustering and thus did not point to a specific metabolism (Figure 6).
Figure 5. Western blot analysis of protein pools from the PA and the PH groups. An antibody mixture, OXPHOS, was used to blot the membrane. β-Actin was used as an internal control.
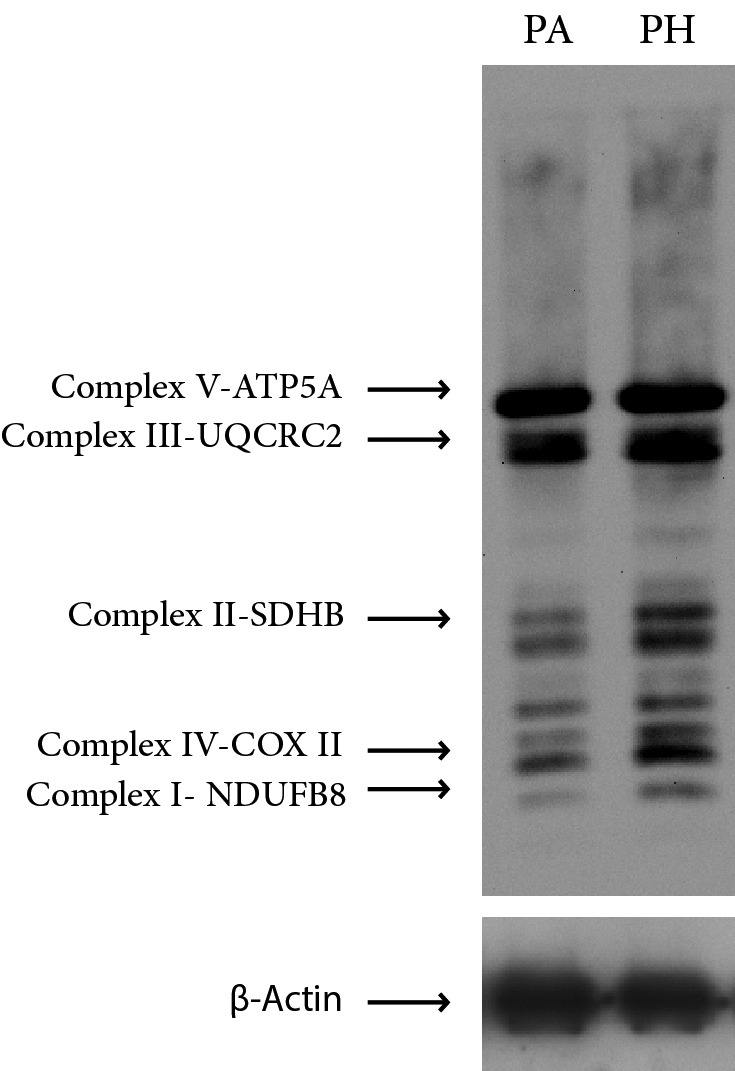
Figure 6. The identified proteins in the PA (A) and the PH (B) groups were mapped by searching the STRING v10.0 software with a confidence level of 0.4. Colored lines between the proteins indicate the various types of interaction evidence.

Validation by western blot analysis. To validate the differential expression of the proteins, four of the identified proteins, LMNA, CH60, HNRNP and UCHL-1 were chosen for further investigation by WB analysis. A representative immunoblot for each tested protein was shown in Figure 7. Densidometric analysis was performed for each of the specific immunoreactive band and the resulting mean values±SD were compared (adenoma vs. hyperplasia) (Figure 3). Data from classical 2DE and 2D-DIGE experiments showed that LMNA and UCHL-1 were down regulated in the PH group. WB analysis confirmed this finding. Similarly, data from classical 2DE and 2D-DIGE experiments showed that CH60 and HNRNP were down-regulated in the PA group. WB analysis also confirmed this finding, indicating that observed regulations represented the actual changes occurred at the proteome level.
Figure 7. Validation of the regulations observed in LMNA, CH60, HNRNP and UCHL-1 by western blotting. β-Actin was used as an internal control. The bar graphs were created from densitometric analysis data which was performed by using the QuantityOne software. To represent each group (PA and PH) four wells were loaded and standard deviation was calculated based on intensities of the bands of each well.

Discussion
The most common proliferative lesions of the parathyroid gland are hyperplasia and adenoma. Differential diagnosis between hyperplasia and adenoma of the parathyroid gland is routinely performed based on histopathological features. The curative treatment of primary hyperparathyroidism is parathyroidectomy, selective surgical excision of abnormal "hyperfunctioning" parathyroid gland(s) (21-24). Differential diagnosis and preoperative decision making between PH and PA is still a challenging task and heavily relies on the experience and the skills of surgeons.
Standard modality used for preoperative localization is parathyroid scintigraphy. Beside scintigraphy, there are multiple imaging modalities which are used for preoperative localization of parathyroid diseases. Comparisons of all these imaging methods have shown that the sensitivities of them very variable and the detection capabilities are different (25). For example, the sensitivity of dual-phase 99mTc sestamibiscintigraphy was 88% for single adenomas, 30% for double adenomas and 44% for multiple-gland hyperplasia (26,27). The detection sensitivity of parathyroid hyperplasia with these modalities is even lower implicating the need for a better diagnostic approaches (28,29).
For the cases with which scintigraphy produce ambiguous diagnosis, another approach relaying on histopathological examination of postoperative samples is performed. However, histopathological examination approach, a time consuming task for the surgeons and pathologist can also be misleading. This diagnostic dilemma needs to be enlightened using novel approaches involving molecular techniques.
In the presented study, we compared proteomic profiles of parathyroid hyperplasia and adenoma. Our aim was to understand the protein expression differences between these two parathyroid lesions and find some clues as to the precise differential diagnosis of PA and PH.
The idea of comparing PH with PA for the purpose of differential diagnosis was tested by Fustar-Preradovic et al., (30). In their study the researchers performed cytomorpho-logical analysis of fine-needle aspiration biopsy smears and found that variations in nucleus size can substantially differentiate PH from PA (30). Although this finding is important it suffers from the limitations of histopathological examination.
Two proteomic studies using 2DE based approach examined PA in comparison to healthy controls. In the earlier study (12) a total of 30 proteins were found to be differentially regulated. Their functional categorization of the regulated proteins indicated the presence of a response to biotic stimuli, cell organization and signal transduction. Bioinformatic analysis of the relevant pathways based on the regulated proteins predicted that 14-3-3 ζ/δ is the key protein in PA network. The study by Giusti et al., (12) demonstrated the use of a proteomic approach for the discovery of potential markers in differential diagnosis of PA. On this line of study, the later work by Varshney et al., (13) monitored the changes in parathyroid proteome in patients with sporadic parathyroid adenoma in comparison to normal parathyroid tissue. Fifteen differentially expressed proteins were reported. Functional categorization of the identified proteins did not bring forward a specific pathway and reported a number of pathways associated with cell death, transcription and signal transduction. The regulated proteins reported by Varshney et al., (13) were different from the ones reported earlier. Although in both studies the same approach involving 2DE coupled with MALDI-MS/MS was used, there were minor differences in experimental approaches e.g. the use of non- linear vs. linear IPG strips as well as demographic properties of the human subjects. In order to make comparisons for the regulated proteins, a Venn diagram was created using the data provided by the earlier aforementioned studies and our data. ANXA2 and LMNA reported by Guisti et al., (12) and ATP5H reported by Varshney et al., (13) were also detected in our study.
The association of ANXA2 and LMNA with disease status were previously reported in tissue samples obtained from human adenomayosis patients who overexpressed ANXA2 and LMNA (31). Ectopic expressions of ANXA2 in HUVEC and ISK cell lines caused changes in LMNA levels indicating presence of a common metabolic ground for these proteins (31). In the light of this evidence, our STRING analysis using ANXA2, LMNA and ATP5H elucidated a central node, formed the by Ubiquitin C (UBC), connecting these three proteins.
When mutual comparisons were made between PH and PA, there were 14 proteins up- and 26 proteins down-regulated in PH. The overall bioinformatic analysis of the regulated proteins did not yield a connection between up- and down-regulated proteins (data not shown). However, when up- and down-regulated proteins were considered as two different groups the bioinformatic analysis for the up-regulated proteins observed in PH revealed important clues about the metabolic tendency in PH. Except HNRNPAB, majority of the regulated proteins were mitochondrial and played pivotal roles in electron transport and ATP synthesis (Table I). The parathyroid glands consist of two types of cells; parathyroid cief cells and oxyphil cells. Chief cells, also called parathyroid principle cells, are much more prevalent in the parathyroid glands. The other cell type is oxyphillcells, which can be derived from chief cells during puberty and may increase in number with age (32,33). Under functional stress the chief cells undergo transformation and forms oxyphil cells (33). The oxyphil cells are unique in their appearance and can be differentiated with the presence of high mitochondrial content. Our observation of the increased presence of mitochondrial proteins may be explained by the transformation of the chief cells to oxyphils. This hypothesis may be strengthen by the finding that the levels of two stress related proteins (SODM and HSP60) were also high in PH.
The changes in mitochondrial activity can be a landmark for some diseases. For example, in cancer cells, mitochondrial respiration and oxidative phosphorylation causes increased proliferation of the cells (34). Similarly in some neurode-generative diseases e.g. Parkinson’s disease mitochondrial dysfunction can be hallmark for understanding the pathophysiology of the disease. So far, except this study no other study has placed importance to the mitochondrial activity as a potential biomarker for differentiation of PH from PA. The question remains to be asked whether monitoring the changes in the level of a single mitochondrial protein would be sufficient for such differentiation of PH from PA or measurement of the levels of a panel of proteins are needed to be measured. Further studies would likely to shed some light into this matter.
We presented exploratory research findings with the hope of discovering a putative biomarker or a biomarker panel to differentiate between PA and PH. The results of this study, although not producing a putative biomarker or a biomarker panel, created a direction towards identifying the changes in mitochondrial proteome. Future studies detailing the changes in mitochondrial proteome between PA and PH should yield a definitive way for differentiation of PA from PH. Such differentiation should be a great help for the community engaged in the study of of parathyroid hyperplasia and adenoma.
Conflicts of Interest
The Authors declare no conflict of interest.
Acknowledgements
This research was partly supported by grants from Kocaeli University Scientific Research Unit under the grant numbers of 2014/057 and 2015/032.
References
- 1.Silverberg SJ, Bilezikian JP. Primary hyperparathyroidism: Still evolving. J Bone Miner Res. 1997;12(5):856–862. doi: 10.1359/jbmr.1997.12.5.856. [DOI] [PubMed] [Google Scholar]
- 2.Miedlich S, Krohn K, Paschke R. Update on genetic and clinical aspects of primary hyperparathyroidism. Clin Endocrinol (Oxf) 2003;59(5):539–554. doi: 10.1046/j.1365-2265.2003.t01-1-01755.x. [DOI] [PubMed] [Google Scholar]
- 3.Marcocci C, Cetani F. Clinical practice. Primary hyperparathyroidism. N Engl J Med. 2011;365(25):2389–2397. doi: 10.1056/NEJMcp1106636. [DOI] [PubMed] [Google Scholar]
- 4.Bilezikian JP, Cusano NE, Khan AA, Liu JM, Marcocci C, Bandeira F. Primary hyperparathyroidism. Nat Rev Dis Primers. 2016;(2):16033. doi: 10.1038/nrdp.2016.33. [DOI] [PMC free article] [PubMed] [Google Scholar]
- 5.Duan K, Gomez Hernandez K, Mete O. Clinicopathological correlates of hyperparathyroidism. J Clin Pathol. 2015;68(10):771–787. doi: 10.1136/jclinpath-2015-203186. [DOI] [PubMed] [Google Scholar]
- 6.Haven CJ, Howell VM, Eilers PH, Dunne R, Takahashi M, van Puijenbroek M, Furge K, Kievit J, Tan MH, Fleuren GJ, Robinson BG, Delbridge LW, Philips J, Nelson AE, Krause U, Dralle H, Hoang-Vu C, Gimm O, Morreau H, Marsh DJ, Teh BT. Gene expression of parathyroid tumors: Molecular subclassification and identification of the potential malignant phenotype. Cancer Res. 2004;64(20):7405–7411. doi: 10.1158/0008-5472.CAN-04-2063. [DOI] [PubMed] [Google Scholar]
- 7.Arnold A. Major molecular genetic drivers in sporadic primary hyperparathyroidism. Trans Am Clin Climatol Assoc. 2016;127:235–244. [PMC free article] [PubMed] [Google Scholar]
- 8.Costa-Guda J, Arnold A. Genetic and epigenetic changes in sporadic endocrine tumors: Parathyroid tumors. Mol Cell Endocrinol. 2013;386(1-2):46–54. doi: 10.1016/j.mce.2013.09.005. [DOI] [PMC free article] [PubMed] [Google Scholar]
- 9.Arnold A, Shattuck TM, Mallya SM, Krebs LJ, Costa J, Gallagher J, Wild Y, Saucier K. Molecular pathogenesis of primary hyperparathyroidism. J Bone Miner Res. 2002;17(Suppl 2):N30–36. [PubMed] [Google Scholar]
- 10.Vierimaa O, Villablanca A, Alimov A, Georgitsi M, Raitila A, Vahteristo P, Larsson C, Ruokonen A, Eloranta E, Ebeling TM, Ignatius J, Aaltonen LA, Leisti J, Salmela PI. Mutation analysis of men1, hrpt2, casr, cdkn1b, and aip genes in primary hyperparathyroidism patients with features of genetic predisposition. J Endocrinol Invest. 2009;32(6):512–518. doi: 10.1007/BF03346498. [DOI] [PubMed] [Google Scholar]
- 11.Cetani F, Pardi E, Borsari S, Marcocci C. Molecular pathogenesis of primary hyperparathyroidism. J Endocrinol Invest. 2012;34(7 Suppl):35–39. [PubMed] [Google Scholar]
- 12.Giusti L, Cetani F, Ciregia F, Da Valle Y, Donadio E, Giannaccini G, Banti C, Pardi E, Saponaro F, Basolo F, Berti P, Miccoli P, Pinchera A, Marcocci C, Lucacchini A. A proteomic approach to study parathyroid glands. Mol Biosyst. 2011;7(3):687–699. doi: 10.1039/c0mb00191k. [DOI] [PubMed] [Google Scholar]
- 13.Varshney S, Bhadada SK, Arya AK, Sharma S, Behera A, Bhansali A, Rao SD. Changes in parathyroid proteome in patients with primary hyperparathyroidism due to sporadic parathyroid adenomas. Clin Endocrinol (Oxf) 2014;81(4):614–620. doi: 10.1111/cen.12479. [DOI] [PubMed] [Google Scholar]
- 14.Morrison C, Farrar W, Kneile J, Williams N, Liu-Stratton Y, Bakaletz A, Aldred MA, Eng C. Molecular classification of parathyroid neoplasia by gene expression profiling. Am J Pathol. 2004;165(2):565–576. doi: 10.1016/S0002-9440(10)63321-4. [DOI] [PMC free article] [PubMed] [Google Scholar]
- 15.Szklarczyk D, Franceschini A, Wyder S, Forslund K, Heller D, Huerta-Cepas J, Simonovic M, Roth A, Santos A, Tsafou KP, Kuhn M, Bork P, Jensen LJ, von Mering C. String v10: Protein-protein interaction networks, integrated over the tree of life. Nucleic Acids Res. 2014;43(Database issue):D447–452. doi: 10.1093/nar/gku1003. [DOI] [PMC free article] [PubMed] [Google Scholar]
- 16.Rabilloud T, Vaezzadeh AR, Potier N, Lelong C, Leize-Wagner E, Chevallet M. Power and limitations of electrophoretic separations in proteomics strategies. Mass Spectrom Rev. 2009;28(5):816–843. doi: 10.1002/mas.20204. [DOI] [PubMed] [Google Scholar]
- 17.Rabilloud T, Chevallet M, Luche S, Lelong C. Two-dimensional gel electrophoresis in proteomics: Past, present and future. J Proteomics. 2010;73(11):2064–2077. doi: 10.1016/j.jprot.2010.05.016. [DOI] [PubMed] [Google Scholar]
- 18.Jafari M, Primo V, Smejkal GB, Moskovets EV, Kuo WP, Ivanov AR. Comparison of in-gel protein separation techniques commonly used for fractionation in mass spectrometry-based proteomic profiling. Electrophoresis. 2012;33(16):2516–2526. doi: 10.1002/elps.201200031. [DOI] [PMC free article] [PubMed] [Google Scholar]
- 19.Friedman DB, Lilley KS. Optimizing the difference gel electrophoresis (dige) technology. Methods Mol Biol. 2008;428:93–124. doi: 10.1007/978-1-59745-117-8_6. [DOI] [PubMed] [Google Scholar]
- 20.Hariharan D, Weeks ME, Crnogorac-Jurcevic T. Application of proteomics in cancer gene profiling: Two-dimensional difference in gel electrophoresis (2d-dige) Methods Mol Biol. 2010;576:197–211. doi: 10.1007/978-1-59745-545-9_11. [DOI] [PubMed] [Google Scholar]
- 21.Bilezikian JP, Brandi ML, Eastell R, Silverberg SJ, Udelsman R, Marcocci C, Potts JT Jr. Guidelines for the management of asymptomatic primary hyperparathyroidism: Summary statement from the fourth international workshop. J Clin Endocrinol Metab. 2014;99(10):3561–3569. doi: 10.1210/jc.2014-1413. [DOI] [PMC free article] [PubMed] [Google Scholar]
- 22.Udelsman R, Akerstrom G, Biagini C, Duh QY, Miccoli P, Niederle B, Tonelli F. The surgical management of asymptomatic primary hyperparathyroidism: Proceedings of the fourth international workshop. J Clin Endocrinol Metab. 2014;99(10):3595–3606. doi: 10.1210/jc.2014-2000. [DOI] [PubMed] [Google Scholar]
- 23.Callender GG, Udelsman R. Surgery for primary hyperparathyroidism. Cancer. 2014;120(23):3602–3616. doi: 10.1002/cncr.28891. [DOI] [PubMed] [Google Scholar]
- 24.Dowthwaite SA, Young JE, Pasternak JD, Yoo J. Surgical management of primary hyperparathyroidism. J Clin Densitom. 2013;16(1):48–53. doi: 10.1016/j.jocd.2012.11.006. [DOI] [PubMed] [Google Scholar]
- 25.Nguyen BD. Parathyroid imaging with tc-99m sestamibi planar and spect scintigraphy. Radiographics. 1999;19(3):601–614. doi: 10.1148/radiographics.19.3.g99ma10601. [DOI] [PubMed] [Google Scholar]
- 26.Mehta NY, Ruda JM, Kapadia S, Boyer PJ, Hollenbeak CS, Stack BC Jr. Relationship of technetium tc 99m sestamibi scans to histopathological features of hyperfunctioning parathyroid tissue. Arch Otolaryngol Head Neck Surg. 2005;131(6):493–498. doi: 10.1001/archotol.131.6.493. [DOI] [PubMed] [Google Scholar]
- 27.Ruda JM, Hollenbeak CS, Stack BC Jr. A systematic review of the diagnosis and treatment of primary hyperparathyroidism from 1995 to 2003. Otolaryngol Head Neck Surg. 2005;132(3):359–372. doi: 10.1016/j.otohns.2004.10.005. [DOI] [PubMed] [Google Scholar]
- 28.Eslamy HK, Ziessman HA. Parathyroid scintigraphy in patients with primary hyperparathyroidism: 99mtc sestamibi spect and spect/ct. Radiographics. 2008;28(5):1461–1476. doi: 10.1148/rg.285075055. [DOI] [PubMed] [Google Scholar]
- 29.Guerin C, Lowery A, Gabriel S, Castinetti F, Philippon M, Vaillant-Lombard J, Loundou A, Henry JF, Sebag F, Taieb D. Preoperative imaging for focused parathyroidectomy: Making a good strategy even better. Eur J Endocrinol. 2015;172(5):519–526. doi: 10.1530/EJE-14-0964. [DOI] [PubMed] [Google Scholar]
- 30.Fustar-Preradovic L, Sarcevic B, Danic D. Morphometry in differential diagnosis of pathologically altered parathyroid glands: Adenoma and hyperplasia. Coll Antropol. 2012;(36 Suppl 2):47–51. [PubMed] [Google Scholar]
- 31.Zhou S, Yi T, Liu R, Bian C, Qi X, He X, Wang K, Li J, Zhao X, Huang C, Wei Y. Proteomics identification of annexin a2 as a key mediator in the metastasis and proangiogenesis of endometrial cells in human adenomyosis. Mol Cell Proteomics. 2012;11(7):M112.017988. doi: 10.1074/mcp.M112.017988. [DOI] [PMC free article] [PubMed] [Google Scholar]
- 32.Ritter CS, Haughey BH, Miller B, Brown AJ. Differential gene expression by oxyphil and chief cells of human parathyroid glands. J Clin Endocrinol Metab. 2012;97(8):E1499–1505. doi: 10.1210/jc.2011-3366. [DOI] [PMC free article] [PubMed] [Google Scholar]
- 33.McGregor DH, Lotuaco LG, Rao MS, Chu LL. Functioning oxyphil adenoma of parathyroid gland. An ultrastructural and biochemical study. Am J Pathol. 1978;92(3):691–711. [PMC free article] [PubMed] [Google Scholar]
- 34.Gasparre G, Porcelli AM, Lenaz G, Romeo G. Relevance of mitochondrial genetics and metabolism in cancer development. Cold Spring Harb Perspect Biol. 2013;5(2):pii:a011411. doi: 10.1101/cshperspect.a011411. [DOI] [PMC free article] [PubMed] [Google Scholar]