

Summary
Master regulatory genes require stable silencing by the Polycomb-Group (PcG) to prevent misexpression during differentiation and development. Some PcG proteins covalently modify histones, which contributes to heritable repression. The role for other effects on chromatin structure is less understood. We characterized the organization of PcG target genes in ES cells and neural progenitors using 5C and super-resolution microscopy. The genomic loci of repressed PcG targets formed discrete, small (20-140Kb) domains of tight interaction that corresponded to locations bound by canonical Polycomb Repressive Complex 1 (PRC1). These domains changed during differentiation as PRC1 binding changed. Their formation depended upon the Polyhomeotic component of canonical PRC1, and occurred independently of PRC1-catalyzed ubiquitylation. PRC1 domains differ from topologically associating domains in size and boundary characteristics. These domains have the potential to play a key role in transmitting epigenetic silencing of PcG targets by linking PRC1 to formation of a repressive higher order structure.
Graphical abstract
Kundu et al. determined the 3D chromatin architecture of developmentally regulated genes repressed by PRC1 in pluripotent ES-cells. PRC1 target genes are compacted into discrete domains whose formation requires the Polyhomeotic protein. These domains are lost when PRC1 binding is lost. These structures could convey epigenetic memory of gene repression.

Introduction
Polycomb group complexes, including PRC1 and PRC2, silence developmentally regulated genes (Di Croce and Helin, 2013). The mechanisms that generate silencing are not clear. PRC2 methylates histone H3 on lysine 27 (H3K27), and this modification has been shown to be important for Drosophila developmental repression. Disruption of H3K27 methylation is believed to be a key defect in human cancers such as glioblastoma (Cao et al., 2002; Czermin et al., 2002; Kuzmichev et al., 2002; Lewis et al., 2013; Muller et al., 2002; Pengelly et al., 2013; Schwartzentruber et al., 2012; Simon and Kingston, 2013; Voigt and Reinberg, 2013; Wu et al., 2012). H3K27me3 modification does not directly silence gene expression but helps to guide the heritability of silenced domains and to recruit another key family of PcG complexes called PRC1 (Campos et al., 2014; Entrevan et al., 2016; Simon and Kingston, 2013; Steffen and Ringrose, 2014). PRC1 family complexes can catalyze ubiquitylation of histone H2A on lysine 119 (H2AK119Ub), can create compacted chromatin structures in vitro, and can bring together distant genomic regions in vivo (Bantignies et al., 2011; Buchwald et al., 2006; Cheutin and Cavalli, 2014; Eskeland et al., 2010; Francis et al., 2004; Grau et al., 2011; Schoenfelder et al., 2015; Wang et al., 2004). Large PcG-enriched domains in Drosophila form structures that are distinct from heterochromatin or active chromatin, indicating silenced domains have special spatial characteristics (Boettiger et al., 2016). Key questions concern how the activities of the PRC1 complexes contribute to spatial organization and silencing.
Based on the in vitro nucleosome compaction activity, an attractive hypothesis for in vivo gene silencing is that PRC1 complexes generate compacted domains of chromatin that exclude the transcription machinery. Distant PRC1-bound regions engage in long-range looping interactions in fly and mammalian cells and assemble into Polycomb bodies in Drosophila. PRC1 is also required to bring together ends of the large Hox gene clusters in mammals, which are classical targets of polycomb-mediated gene repression (Eskeland et al., 2010; Isono et al., 2013). These interactions correlate with the repressed state of Hox genes and are highly conserved across species as evidenced by the ‘Hox kissing’ phenomenon in fly and the ‘Hox spatial network’ in mouse cells (Bantignies et al., 2011; Schoenfelder et al., 2015). However the nature and structure of the genomic regions involved in these long-range contacts, and how they might change upon changes in regulation, is not known. It is also not known which of the many PRC1 family complexes and subunits might be necessary for generating chromatin contacts at PRC1-repressed loci, although recent studies have implied a role for the Polyhomeotic protein in Drosophila (Wani et al., 2016). Determining how these structures relate to silencing in mammals requires understanding their characteristics and determining which proteins are needed to generate these putative silenced structures.
Compacted chromatin domains created by the action of PRC1 might or might not follow similar rules for positioning as TADs, in that they might be within TADs or instead might straddle TAD boundaries. The mechanism governing their formation and function might be distinct; for example it is not known whether any domain formed would be limited to regions bound by PRC1 or PRC2 components (typically much smaller regions than TADs), or extend beyond the limits of PcG binding. Hence such domains must be distinguished from the long-range interactions that are central to TADs. The large Hox gene clusters serve as examples of the possible dual roles that chromatin interactions might play in regulation. The boundaries that define which Hox genes are expressed or repressed correlate with CTCF binding sites in Drosophila and are disrupted by mutation of CTCF binding sites in mammals (Bowman et al., 2014; Narendra et al., 2015). These boundaries are proposed to define domains of long-range interaction that tie distant enhancer regions to Hox genes, within specific TAD domains, and thereby determine the activation of these genes in a spatially appropriate manner (Andrey et al., 2013; Darbellay and Duboule, 2016; Noordermeer et al., 2011). If PRC1 generates separate compacted domains that drive repression of its target genes, these domains would likely be smaller than megabase TAD domains. Such domains would coincide with changes in repressed status, and correlate with disruption of the long-range TAD interactions that define activation.
We investigated whether PRC1 forms compacted chromatin domains in mammalian cells by measuring interactions of selected Polycomb-repressed genes at high resolution. Using two independent technologies, we demonstrate that in mouse embryonic stem cells (ESC), the chromatin of PRC1-targeted developmentally regulated genes is organized in closed and compacted structures. These structures require canonical PRC1 for formation, are typified by interactions only between PRC1 bound regions and are lost when PRC1-target genes are activated or when PRC1 is lost from lineage-specific targets upon cell-fate specification. Variant PRC1 complexes and H2A ubiquitylation are neither necessary nor sufficient to form these domains. These PRC1 associated compaction domains encompass entire genes or multiple genes and therefore form at a significantly larger scale than the in vitro compaction of nucleosomes driven by PRC1 (Francis et al., 2004; Grau et al., 2011). We hypothesize that these PRC1-associated domains might repress PcG targets by creating a local chromatin environment that is incompatible with the long-range interactions needed for enhancer interaction and activation.
Results
Polycomb repressed Hox clusters form self-interacting domains that require canonical PRC1
To characterize how canonical PRC1 might be involved in organizing chromatin conformation, we first identified PRC1 and PRC2 occupied loci in mouse ESC. PRC1 is a large family of complexes broadly classified as canonical and variant PRC1 (Figure 1A) (Farcas et al., 2012; Gao et al., 2012; Morey et al., 2013; Morey et al., 2012; Tavares et al., 2012). To specify PRC1 occupied loci we performed ChIP-Seq for the PRC1 subunits Phc1, Cbx2, Cbx7, Ring1b and H2A-K119Ub (Table S3). While Ring1b identifies all PRC1 occupied loci, Phc1 and Cbx7 identify loci bound by canonical PRC1. Ring1b is required to bring together the extremities of Hox clusters in ESC (Eskeland et al., 2010). Similarly, Drosophila Polycomb (Pc) is required for long-range loops between Antp and Abd-B genes (Bantignies et al., 2011). These data suggested that members of the PRC1 family are necessary for the looping of repressed Hox gene clusters, but did not distinguish between potential roles for canonical and variant PRC1 complexes.
Figure 1. Chromatin is organized into self-interacting domains of local interactions at Hox gene clusters in ESC and requires canonical PRC1.

A, Schematic - Canonical and variant PRC1 complexes have distinct subunit composition but are found to co-exist at PRC1 targets. B, CRISPR-Cas9 targeting of Phc1 leads to loss of Phc1 protein expression. Phc2 expression is not increased to compensate for Phc1-loss. Ezh2 and Actin are controls. C, RNA-Seq shows that Hox cluster genes, which are PRC1 targets, change gene expression in Phc1-KO ESC. Orange – PRC1 occupied genes in WT ESC. Blue – Hox cluster genes. D, ChIP-PCR at select PRC1 target loci (GD – gene desert control) show loss of canonical PRC1 subunits Phc1 and Cbx7, approximately 50% reduction in Ring1b occupancy and no significant change in Kdm2b. Data represented as mean +/- SD. E-F, HoxA and HoxD compaction domains are lost upon loss of canonical PRC1 from chromatin. 5C Z-score interaction maps showing ∼1Mb regions comprising HoxA (E) and HoxD (F) clusters respectively in WT (left) and Phc1-KO (middle) ESC. PRC1 associated compaction domains (red squares) are lost in Phc1-KO while Hi-C TADs are preserved. Z-scores are derived by correcting interaction frequencies for distance dependence of chromatin fragments. This corrects the strong background interactions inherent between immediately adjacent fragments (see Methods). Black diagonal shows axis of symmetry. Difference maps were derived by subtracting Z-scores of interactions in WT ESC from Phc1-KO ESC. Blue – stronger interaction in WT. Orange – stronger in Phc1-KO. See also Figures S1, S2, S5, S10, S11 and Tables S1, S2.
All canonical PRC1 in mESC contains Phc1, and the Ph protein in Drosophila and mice has been implicated in long-range interactions via the function of its SAM domain (Isono et al., 2013; Wani et al., 2016). Therefore we hypothesized that canonical PRC1 was needed for local short-range interactions that would form compacted domains in ESC. We tested this hypothesis by targeting the Phc1 gene with CRISPR/Cas9 and confirmed loss of Phc1 protein from Phc1-KO ESC (Figure 1B). We performed ChIP to show that, as expected, Phc1 was lost from all tested loci, and that Cbx7 and Cbx2 occupancy was reduced by 90%. In contrast, Ring1b and H2A-K119Ub enrichment were reduced by about 50% and 25%, respectively, while Kdm2b enrichment was reduced 10% (Figures 1D, S5 and data not shown). Thus, Phc1 deletion caused loss of canonical PRC1 at PcG targets, while binding and function of variant PRC1 appeared to be largely preserved. We performed RNA-Seq to compare the gene expression changes between WT and Phc1-KO ESC, and found that 1324 genes were differentially expressed. Significantly, most Hox genes were upregulated (Figure 1C) as well as nearly 200 other PcG targets (Figure S1, Table S1.)
To determine whether Phc1 knockout impacted chromatin organization, we interrogated the chromatin conformation of developmentally regulated PRC1 occupied regions by 5C (Dostie et al., 2006). This allowed us to comprehensively measure interactions in a chosen subset of the mouse genome at higher resolution and coverage than afforded by Hi-C or 4C. We placed alternating reverse and forward 5C probes on every restriction fragment in the test regions, achieving a density of approximately one primer per 4 Kb. The median size of used fragments was 2.3 Kb. Our test regions ranged from 500kb to >1Mb in size, included the four Hox clusters, which are well-studied PRC1 occupied regions, and regions around genes that lose or gain PRC1 during neural fate specification (see below).
To test the hypothesis that PRC1 generates domains of compacted chromatin, we needed to address background variation and lower signal-to-noise ratios that can occur at short distances. We developed a computational strategy that accounted for detection biases in interaction frequencies of individual primers, corrected for distance dependency of chromatin interactions down to the shortest primer distance of a few hundred base pairs, and detected areas of significant interactions based on comparison to local background. The chosen parameters for this analysis allow detection of regions consistently enriched for chromatin interactions of 15-20 Kb and larger, as the design requires at least 5 neighboring primers to show significant interaction (see Methods for a detailed description.)
Analysis of 5C interactions in ESC revealed PRC1 occupied regions that are transcriptionally inactive, form self-contained domains of high chromatin interactions, and that are delimited by PcG protein binding. The entire HoxA cluster is occupied by PRC1 and PRC2, and Hoxa genes are repressed in ESC (Bernstein et al., 2006; Mazzoni et al., 2013; Narendra et al., 2015) (also Figure 3A). We observed a local domain of high interactions that encompassed the HoxA cluster in ESC, spanning ∼140Kb (Figure 1E, left). This domain was lost in Phc1-KO ESC (Figure 1E, middle). We measured the difference between these interactions and saw predominant WT ESC interactions (Figure 1E, right; blue – interactions enriched, orange – interactions depleted in WT). Similarly, the HoxD cluster is repressed and bound by PRC1 and PRC2 in ESC (Bernstein et al., 2006; Soshnikova and Duboule, 2009) (also Figure 3A). We observed a self-interacting domain encompassing the PRC1-occupied HoxD cluster in WT ESC that spanned ∼100Kb. In Phc1-KO ESC, all significant local interactions were lost within the HoxD gene cluster (Figure 1F). Thus, PRC1-associated compaction domains at Hox gene clusters were abrogated upon loss of Phc1 and subsequent derepression. In contrast, long-range interaction patterns corresponding with the much larger TAD structures previously identified by Hi-C (Dixon et al., 2012) were preserved at both regions in the Phc1-KO ESC, indicating that different mechanisms govern the formation of these two types of domains identified by 5C (Figure 1E-F – TADs observed as large blue domains on top right and bottom left, and Figure S2).
Figure 3. Neural differentiation leads to decompaction of PRC1 bound Hox gene clusters.

A, Genome browser profiles showing changes in PRC1 and PRC2 occupancy by ChIP-Seq at HoxA and HoxD gene loci in WT ESC and NPC. Blue and green bars represent computationally identified 5C interaction domains. RNA-Seq profiles are in Figure S2B. B-C, 5C Z-score interaction maps showing ESC and NPC at ∼1Mb regions comprising HoxA (A) and HoxD (B) clusters respectively. Blue bars are ChIPseq peaks for PRC1 and PRC2 (ES – Top to bottom: Phc1, Ring1b, Cbx7, Ezh2, H3K27me3; NPC – Top to bottom: Ring1b, Cbx8, Ezh2, H3K27me3). PRC1 associated compaction domains (red squares) are reduced (B) or lost (C) in NPC. Grey arrow – PRC1-associated interactions over Hoxa genes that are present in ESC and lost in NPC; green arrow – interactions that become more prominent in NPC; red arrow – PRC1-associated interactions over posterior Hoxa genes that are retained in NPC. Z-score and difference maps are as described in Figure 1. See Fig S8 and S9 for magnified views; S12, S13 for IF maps. D, DNA-FISH and STORM imaging of HoxA, HoxB and HoxD clusters in NPC showing decompaction of Hox loci. Color bar shows the Z-axis depth color code of images. E, Comparison of area occupied by Hox clusters (top) and radius of gyration of these particles (bottom) in the three cell types showing significant decompaction upon PRC1 loss. See Methods for details and figs S1, S2 and Tables S2, S3.
Self-interacting PRC1-associated domains appear compact by super-resolution microscopy
To confirm the chromatin organization observed by 5C, we analyzed three PcG repressed domains using super-resolution microscopy. We used stochastic optical reconstruction microscopy (STORM) and an ‘oligo-paint’ strategy that was previously applied to PcG targets in Drosophila and mammals (Beliveau et al., 2015; Beliveau et al., 2012; Boettiger et al., 2016). To image the locus of interest by DNA-fluorescence in situ hybridization (FISH), we hybridized fluorescently labeled oligonucleotides spaced approximately every 200 bp along the entire locus. We inferred the degree of chromatin compaction on the basis of area covered by STORM FISH signal in PRC1-bound regions of the HoxA, HoxB and HoxD clusters in WT ESC and determined how compaction changes in Phc1-KO ESC that lose canonical PRC1 binding.
Consistent with 5C data, STORM imaging showed that HoxA, HoxB and HoxD regions were all uniformly compacted in WT ESC (Figure 2; HoxB was used to compare to previous characterization of this locus (Eskeland et al., 2010). Upon loss of Phc1, these loci were decompacted, indicated by FISH signal spreading over a larger area (Figures 2, 3E). Another measure of decompaction, the radius of gyration (Boettiger et al., 2016) was also significantly greater in Phc1-KO ESC than in WT (Figure 3E). Thus, the 5C and STORM data together demonstrate that PRC1 occupied regions are organized into discrete and contiguous domains of compaction that require canonical PRC1.
Figure 2. Loss of chromatin interactions upon deletion of Phc1 correlates with chromatin decompaction of Hox gene clusters.
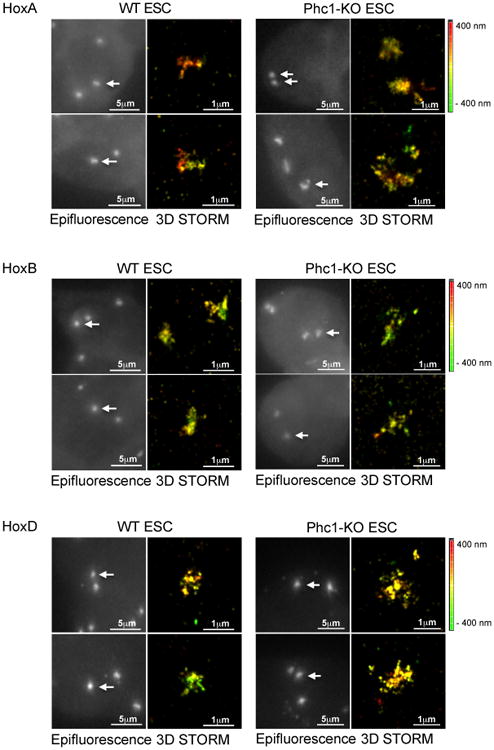
DNA-FISH and STORM imaging of HoxA, HoxB and HoxD clusters in WT and Phc1-KO ESC shows that Hox gene clusters are organized in a densely stained, compact conformation in WT ESC, when repressed, and become decompacted upon loss of canonical PRC1. Oligo probes had 42 bases of sequence complementarity. White arrows represent the object imaged by STORM. Color bar represents the Z-axis depth color code of images. Quantification shown in Figure 3.
Compaction domains are lost as PRC1 occupancy changes upon neural fate specification
PRC1 is involved in maintaining differentiated states so we reasoned that cell-fate specification from pluripotent ESC might generate conformation changes at PcG bound loci. We differentiated ESC to neural progenitor cells (NPC) in vitro and identified PRC1 bound loci that changed gene expression upon neural fate specification by ChIP-Seq and RNA-Seq (Figure S1). Since Cbx7 is lost upon differentiation, we used Cbx2 and Cbx8 as markers of canonical PRC1 (Creppe et al., 2014; Morey et al., 2012; O'Loghlen et al., 2012). We interrogated a set of genomic regions that included the HoxA and HoxD gene clusters, and also developmentally regulated single gene loci. These include Pax6, a region of chr2 containing three genes – Nkx2.4, Nkx2.2 and Pax1, and a region of chr6 containing two genes - Igf2bp3 and Stk31.
PRC1 and PRC2 were lost from anterior HoxA cluster genes (Hoxa1-Hoxa5) upon neural differentiation (Figure 3A) (Mazzoni et al., 2013; Narendra et al., 2015). Simultaneously, the self-interacting domain that spanned the whole locus was no longer present, and there were no significant interactions adjacent to the TAD boundary at the anterior end of HoxA (grey arrows). The long-range interactions, proposed to be involved in activation, between the anterior HoxA cluster and the adjacent TAD increased (green arrow) (Wang et al., 2011). Importantly, we observed a self-interacting domain that coincided with the remaining genes occupied by PRC1 (Hoxa7-13) and spanned ∼90 Kb (red arrow, Figures 3B, S2; S8 for magnified view). This partial reduction of the PRC1 compaction domain distinguished the chromatin conformation of NPC HoxA cluster from Phc1-KO ESC, where the entire domain was lost, and showed a correlation between PRC1 binding and domain formation.
Several Hoxd genes were expressed (Hoxd1, 4, 8, 9, 13) in NPC, and binding of PRC1 was diminished across much of the locus (Figure 3A). Correspondingly, the HoxD domain was lost (Figure 3C; Figure S9 for magnified view). Note that we cannot determine from these data whether a much smaller domain, below our detection resolution of 15-20 Kb, remains in NPC at the distal end of HoxD where there remains some PRC1 binding. We conclude that loss of PRC1-associated domains correlate with regulated derepression of Hox genes that occurred upon differentiation. The TAD domain boundaries of both HoxA and HoxD became more distinct upon differentiation (orange in difference maps, Figure 3) and we observed sub-TAD structures emerge (Dixon et al., 2015; Phillips-Cremins et al., 2013). However, the PRC1 associated self-interacting domains of HoxA and HoxD both spanned previously identified TAD domain boundaries (Figures 1, 3, S2). Thus PRC1 domain boundaries are distinct from TAD boundaries.
We tested whether the loss of local chromatin interactions of Hox loci in NPC could also be visualized by STORM. Whereas HoxA, HoxB and HoxD gene clusters occupied a compacted area in WT ESC (Figure 2), we observed a larger area upon differentiation to NPC (Figure 3D). Interestingly, the degree of decompaction in NPC was similar to decompaction seen in Phc1-KO ESC (Figure 3E), suggesting that loss of PRC1 at these loci may be an important dynamic during differentiation and may contribute to chromatin opening in NPC.
Chromatin interactions of PRC1-occupied genes change upon neural fate specification
Self-interacting domains that overlap with PRC1 binding were not unique to the Hox loci and were also seen on other PRC1 targets, although with interesting changes in organization. We describe two examples of neural fate associated transcription factors – Nkx2-2 and Pax6 (Briscoe et al., 1999; Ericson et al., 1997). Both genes are occupied by PRC1 and PRC2 in ESC and lose PcG occupancy in NPC where they are expressed (Figures S1B, S3A). A 22kb long repressive domain that corresponded with the Pax6 locus in ESC was lost in NPC (Figure 4A). This smaller domain had boundaries that corresponded, within the limits of our resolution and 5C restriction fragment distribution, to the boundaries of PRC1 binding.
Figure 4. Altered PRC1 occupancy at developmentally regulated genes upon neural differentiation alters chromatin organization.
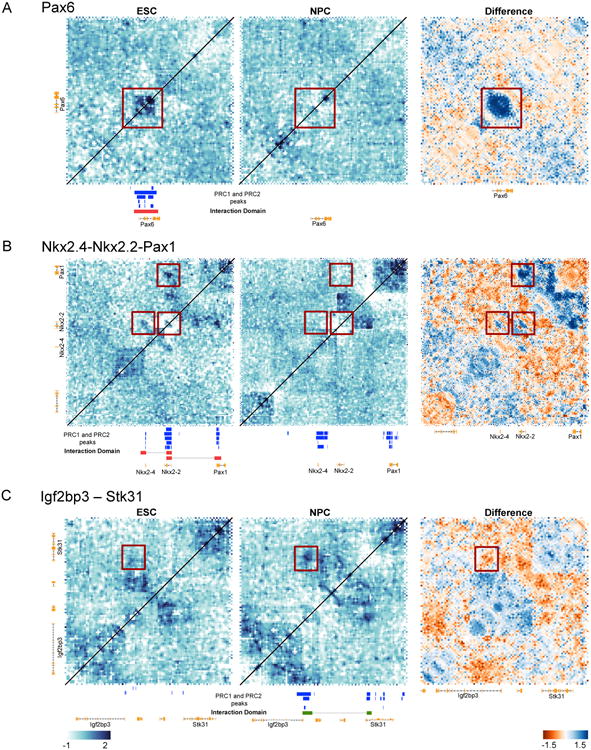
A-B, 5C interaction Z-score, and difference maps showing ESC and NPC at ∼500kb regions around Pax6 (A) and Nkx2.4-Nkx2.2-Pax1 (B) loci respectively. PRC1 associated domains (marked by red squares) are lost in NPC coinciding with gene expression and loss of PcG. C, chromatin interaction domains are formed at the Igf2bp3-Stk31 locus in NPC, which acquire PRC1 upon neural differentiation. See Figure 1 for details on Z-score and difference maps, S1 for gene expression (RNA-Seq), S3 for PcG occupancy profiles (ChIP-Seq), S12 and S13 for IF maps.
We interrogated a ∼600kb region that contained Nkx2.2 and two other PRC1 occupied genes in ESC – Nkx2.4, and Pax1. Only Nkx2.2 lost PcG occupancy and was expressed in NPC. 5C analysis revealed two sets of long-distance looping interactions in ESC – one between Nkx2.2 and Pax1 separated by 152kb, and the second between Nkx2.2 and Nkx2.4 (Figure 4B). These loops connected regions of PRC1 binding and there was no PRC1 binding in the intervening regions. Both looping interactions were lost in NPC. Thus PRC1 occupancy correlated with bridging of distant loci, and this bridging was lost as one of the loci lost PRC1 upon differentiation. PRC1 occupancy at the individual Nkx2.2, Pax1 and Nkx2.4 gene loci spanned distances that were too small to computationally determine whether they formed compaction domains (∼15kb, 8kb and 4kb respectively). We detected a small region of higher interactions over Nkx2.2 (∼15kb, near the confidence cut-off) only in WT ESC, where this gene is repressed (Figure 4B). This small domain appears to be lost in NPC and correlates with PcG loss.
We examined whether genes that acquired PRC1 upon neural differentiation became organized into Polycomb associated domains. The Igf2bp3 and Stk31 genes, which are expressed in ESC and gain PRC1 and PRC2 upon neural differentiation (Figure S3), interacted only in NPC. Similar to Nkx2.2, this repressive interaction was in the form of a loop between Igf2bp3 and Stk31, separated by ∼185kb (Figure 4C). As seen above, we detected no PRC1 binding in the regions inside the loop. Whether small domains occur over these genes could not be determined as the size of PRC1 binding was less than our domain size cut-off (∼13kb and 9kb). We conclude that local self-interacting domains can form when loci acquire PRC1 occupancy upon differentiation.
We tested whether domain interactions at these PRC1-bound genes were affected by Phc1-KO and found that the repressive domain around Pax6 was compromised, but not completely removed (Figure 5A). This domain is much smaller than the Hox domains (∼22 kb vs. 90-140 kb), and, intriguingly, less Phc1 is found bound in this region as measured using ChIP (Figure S3A). However, the conformations involving Nkx2.2 were lost upon loss of canonical PRC1 (Figure 5B) indicating that canonical PRC1 drives these interactions.
Figure 5. Deletion of Phc1 also affects PRC1-associated interactions of developmentally regulated gene loci.

A, Compaction domain over Pax6 gene is compromised but not entirely lost in Phc1-KO. B, Looping domains involving Nkx2.2 locus are lost upon loss of canonical PRC1. Z-score maps in WT ESC (left), Phc1-KO ESC (middle) and difference maps compared with WT ESC (right). Blue – stronger interaction in WT.
Variant PRC1 complexes are not necessary for domain formation
The data presented above indicate that variant PRC1 is not sufficient to generate compacted structures but do not address whether variant PRC1 complexes, or the H2A ubiquitylation modification catalyzed by them, is necessary for compaction at repressed PRC1 target loci. The H2AK119Ub modification is dispensable for looping of Hox cluster genes (Eskeland et al., 2010). We measured compaction in ESC expressing a catalytically inactive Ring1b (Ring1b I53A) (Illingworth et al., 2015) and compared those effects to those of Ring1b-KO ESC. The level of chromatin-bound Ring1b was somewhat reduced in the Ring1b 153A line (Figure 6D and (Illingworth et al., 2015)). Additionally, consistent with a hierarchical recruitment model in which variant PRC1 recruits PRC2 (Blackledge et al., 2014; Tavares et al., 2012), we found that PRC2 catalyzed H3K27me3, and canonical PRC1 components Cbx7 and Phc1 were reduced at PRC1 target loci (Figure 6D and data not shown). We detected negligible amounts of chromatin bound H2AK119Ub relative to WT ESC, despite H2AK119Ub still being present in these cells as evaluated by western blot (Figure S5). Kdm2b and Rybp levels were unchanged suggesting that variant PRC1 occupancy is not affected by loss of H2AK119Ub (Figures 6D, S5). A partly compromised canonical PRC1 complex might lead to partial loss of compaction domains. If so, this would be revealed as weakening of interaction frequencies as measured by 5C. 5C analysis of Ring1b I53A ESC revealed that chromatin interactions at large Hox clusters and individual PRC1 occupied loci were partly diminished (Figure 6A-C), but still significant compared with the Phc1-KO ESC (where H2AUb and variant PRC1 complexes are preserved) or Ring1b-KO ESC (Figure 6A-C), which lost all Polycomb repressed compaction domains. We conclude that chromatin compaction was still observed following loss of H2AK119Ub at repressed loci.
Figure 6. Variant PRC1 ubiquitylation is not necessary to form PRC1 associated compaction domains.

A-C, Comparison of 5C interactions in the HoxA, Pax6 and Nkx2.2-Pax1 loci between WT, Ring1b-I53A and Ring1b-KO ESC. Compaction and loop domains are reduced in strength but largely preserved in Ring1b-I53A, but lost in Ring1b-KO ESC. D, ChIP-PCR at select PRC1 target loci show partial reduction, but not loss, of canonical PRC1 components and Ring1b. Variant PRC1 component Kdm2b is unchanged. (GD – gene desert control; note that WT and mutant Phc1 ChIP experiments were performed with a different lot of commercial Phc1 antibody than used in Figure 1 that appears to have lower efficiency for Phc1 interaction.) Data represented as mean +/- SD. See also Figures S4 and S5.
To determine the role for H3K27 methylation in compaction, we examined the impact of deleting Ezh2, the catalytic component of PRC2 complex. Though H3K27me3 is only partially diminished at developmentally regulated PcG targets in the Ezh2-KO ESC (Shen et al., 2008), we found that enrichment of canonical PRC1 subunits was reduced. In contrast, occupancy of both the variant PRC1 components Kdm2b and Rybp increased (Figure S5), consistent with variant PRC1 binding either preceding or being independent of PRC2 function. 5C in Ezh2-KO ESC revealed that the Polycomb repressive domains were diminished compared to wild type, although were still detectable (Figure S4).
Polycomb associated domain boundaries are not dependent on architectural proteins
Based on studies of the above mutant ESC lines, we conclude that compaction of the self-interacting PRC1 domains was primarily driven by canonical PRC1. This was further supported by a close examination of the specific interactions measured by 5C. The boundaries of two genomic regions that engaged in 5C interactions correlated with ChIP-Seq enrichment for Ring1b and canonical PRC1 component Cbx7 (examples in Figure 7A). In contrast, we found no significant correlation of PRC1 domain boundaries with CTCF sites (Figure 7B), whereas CTCF correlates strongly with TAD boundaries. PRC1-domain boundaries also did not correlate with cohesin (based on Smc1a and Smc3 localization) or Mediator (Med12 and Med1), two complexes associated with TAD structure (Fig 7B, S6A) (Dixon et al., 2012; Hou et al., 2012; Kagey et al., 2010; Phillips-Cremins et al., 2013; Rao et al., 2014; Sofueva et al., 2013). We further determined that these domain boundaries did not correlate with several activation associated histone modifications, or RNA Polymerase II (Fig S6B), indicating that the boundaries are not determined by immediately neighboring active domains. We thus conclude that PRC1-associated domain boundaries do not correlate with CTCF and other architectural proteins. We analyzed all domains and saw strong correlation between binding by canonical PRC1 components and boundaries (Fig 7C).
Figure 7. Compaction domains correlate with PRC1 occupancy.

A, Primer interactions mapped at HoxA and Nkx2.4-Nkx2.2-Pax1 regions in WT ESC show that boundaries of interaction domains correlate well with PRC1 occupancy. ChIP-Seq enrichments for Ring1b, Cbx7, H3K27me3 and H2AK119Ub are shown. Grey lines – mapped primer interactions with Z-score above significance threshold. Light grey lines represent an interaction between the Nkx2.2 locus and a nearby CTCF binding site. This interaction is independent of PRC1 occupancy and also celltype invariant. Red bars – computationally identified interaction domains. Blue-red-green colored bar marks restriction fragments assigned to Forward, Reverse and Unused 5C primers respectively. B, Cumulative distribution function plots showing distance of ESC TAD boundaries (blue) compared with distance of PRC1 associated domain boundaries (red) from nearest CTCF (left) and Smc1a binding sites (right) in ESC. Indicated p-values (Wilcoxon Rank Sum test) show that the distributions are significantly different. Black line is the expected distribution of random genomic loci from the relevant protein. Source of publicly available data: ESC TAD – (Dixon et al., 2012); CTCF and Smc1a binding sites – (Kagey et al., 2010). Also see Figure S6. C, Distribution of PRC1 subunits Cbx7 and Ring1b and PcG associated histone modifications H3K27me3 and H2AK119Ub across PRC1 associated domains. Boundaries of all four marks correlate well with boundaries of PRC1 associated domains. D, Model to describe interpretation of presented data; see discussion for a description of the hypothesis presented. See also Figure S7 for our analysis of a high-resolution Hi-C dataset generated in GM12878 cells by (Rao et al., 2014), and discussion for a description.
Discussion
We show that PRC1 generates a class of chromatin domains with unique properties. These domains show uniform close-range interaction and change during differentiation. These PRC1 domains span sizes ranging from 140 kb (HoxA) to 20 kb (Pax6), which is at the lower level of detection allowed by the prevalent primer densities possible with 5C experiments. These domains are not only smaller than TADs which are several hundreds of Kb to 1-2Mb in size, in some cases (e.g., HoxA, HoxD) they overlap the boundaries of previously characterized TAD domains. Also, unlike TADs the boundaries of these domains correlate with PRC1 occupancy rather than CTCF, implying that PRC1 domain boundaries are defined by a distinct mechanism. PRC1 domains are found over repressed regions. We hypothesize, based upon the correlation between the formation of these domains and gene regulation during development, that these domains might play a central function during silencing of genes and perhaps also in the maintenance of the silenced state.
We propose the following model for formation of these domains based upon analysis of the genes contained in our 5C data set (Fig. 7D). Canonical PRC1, when bound to target genes, reorganizes the chromatin such that the bound loci become isolated from the surrounding non-PRC1 bound chromatin and interact primarily with other nearby bound loci. These self-interacting loci thus form domains of compacted chromatin that covers the entire target and hence encompass ten to over one hundred Kb. When neighboring PRC1 target genes are adjacent with little intervening non-PcG bound chromatin (e.g. the Hox clusters), the self-interacting loci appear to form a large domain with uniform interactions throughout. However, when neighboring PRC1 genes are separated by stretches of non-PRC1 bound chromatin, PRC1 bridges them to form a self-interacting domain by looping out the intervening non-PcG bound chromatin.
These studies extend several previous studies indicating a role for compaction on PcG targets in both mice and in flies. Several groups have demonstrated that the ends of PcG bound Hox loci can contact each other even though they are distant on the linear genome (Bantignies et al., 2011; Cheutin and Cavalli, 2014; Eskeland et al., 2010; Lonfat and Duboule, 2015; Schoenfelder et al., 2015). But the extent to which these contacts involve the whole domain, as we infer from our data, had not been examined. New insight came from the recent observation that large Polycomb-repressed regions in Drosophila form densely packed chromatin that is distinct from other inactive or active chromatin states (Boettiger et al., 2016). The structures we see are consistent with those structures, and require the Ph protein in mouse cells. The data presented here extend these types of structures beyond the Hox loci to several other types of loci regulated by PRC1. An important issue, not yet resolved, is whether these domains, which span tens of Kb, require the short range compaction that can be driven by PRC1 that occurs between adjacent nucleosomes (Francis et al., 2004; Grau et al., 2011).
These data, taken together, lead to the hypothesis that formation of these domains is a central function for the canonical PRC1 complex, and therefore that this function is broadly used on PcG targets that are differentially regulated during embryonic development. To examine whether this supposition has support, we analyzed a high resolution Hi-C dataset that was generated in GM12878 human cell lines by the Lieberman-Aiden lab (Rao et al., 2014). Using RING1B occupancy from the related K562 cell-line as a marker of PRC1, we asked whether interaction domain formation is a general feature of PRC1-bound loci genome-wide. Of the top 5000 Ring1b occupied regions, we queried the 4591 genes that were involved and found that 1897 (∼41%) of these engaged in domain or loop interactions (Figure S7). Noting that the Hi-C data has less coverage depth than our 5C dataset (1.2 million vs. 9.1 million per Mb), it is possible that small domains of interaction, underlying smaller PRC1 occupied regions, would not be identified here and we are thus underestimating the number of PRC1-associated interactions in the GM12878 cells. We suspect that the increase in coverage depth afforded by the 5C strategy allowed the detection of smaller domains of local interactions at the cost of a genome-wide view. We observed that 55 of the 67 PRC1 bound regions in the areas covered in our 5C data set showed domains of enriched interactions.
When pluripotent ES cells differentiate into lineage-committed cell types there are alterations in the long distance enhancer-promoter interactions required for activation (Noordermeer et al., 2011). These interactions occur within mapped TAD domains, and we observe an increase in these interactions when genes are activated and the PRC1 repressed domains dissipate. Thus it is possible that the formation of PRC1 domains limits the interactions that are required to form activating long-range interaction in TAD domains, and that this is one mechanism by which PRC1 generates repression.
Full formation of these domains requires the function of the canonical PRC1 family members. These complexes are characterized by having a mouse Polyhomeotic homolog, and deletion of that gene eliminates these domains over the Hox clusters. This deletion also eliminates interactions in the Nkx2-Pax1 cluster. Interestingly, we did not see a complete removal of the smaller domain that forms over Pax6 in the Phc1 mutation. However, we also saw a lower level of binding by Phc1 on this locus. This suggests that there is a variable requirement for Phc1 at distinct loci, perhaps related to the size of the loci as the Pax6 domain is small (20 kb) relative to Hox loci (∼100 kb.). Formation of the domain at the Pax6 locus was not impacted by removal of H2A119Ub, and was eliminated by removal of Ring1b, behaviors consistent with it requiring the canonical PRC1 complex. It is possible that the Cbx proteins, known to compact nucleosomes in vitro, have sufficient function to create a domain on Pax6 in the absence of Phc1.
STAR Methods
Contact For Reagent and Resource Sharing
Further information and requests for resources and reagents should be directed to and will be fulfilled by the corresponding author, Dr. Robert Kingston (kingston@molbio.mgh.harvard.edu)
Experimental Model and Subject Details
Wild type J1 (129S4/SvJae) and mutant ESC lines were maintained on mitomycin-C inactivated MEF feeder layers (EMD Millipore). Other ESC lines used in this study: Ring1b-/-, Ring1bI53A/I53A (Eskeland et al., 2010; Illingworth et al., 2015), Kdm2bT/T (Boulard et al., 2015), Ezh2-/- (Shen et al., 2008). These were generous gifts from Wendy Bickmore, Timothy Bestor and Stuart Orkin labs. ESC were depleted of feeder cells prior to use in experiments. Neural progenitors (NPC) were derived by in vitro differentiation from J1 ESC and maintained using previously described methods (Pollard et al., 2006). Phc1-KO ESC were derived by targeting exon 2 of the Phc1 gene locus (NM_007905) using a guide RNA cloned into the pX330 vector (Addgene) that expresses a CRISPR/Cas9 cassette. The targeting vector was introduced into J1 ESC by nucleofection (Lonza) along with a Puromycin marker for selection (Clontech).
Method Details
5C
5×10⁷ cells were crosslinked for 10 min in 1% formaldehyde. 3C and 5C templates were prepared as described (van Berkum and Dekker, 2009). 5C primers were designed using an alternating primer scheme for available HindIII restriction sites that passed threshold criteria, using my5Csuite primer design tools (Lajoie et al., 2009). 2845 primers were used to interrogate 16 genomic regions covering a combined 11.04 Mb. Average primer density was one primer per 3.88 Kb. 5C was performed on two or more biological replicates. Data shown are average of two biological replicates. Data analysis is described in next section.
Chomatin Immunoprecipitation (ChIP)
Cells were crosslinked for 10 min in 1% formaldehyde at room temperature and quenched with 125mM Glycine. ChIP was performed as previously described (Carey et al., 2009), with the following modifications: 3 million cells were used for each ChIP; Dynabeads® Protein A (Invitrogen) were used in place of Protein A-agarose beads. Antibodies used: Phc1 (Active Motif, 39723), Ring1b (Bethyl, A302-869A), Cbx7 (Abcam, ab1873), Cbx2 (Bethyl, A302-524A), Cbx8 (Bethyl, A300-882A), H2AK119Ub (Cell Signaling Technology, 8240), H3K27me3 (Millipore, 07-449), Ezh2 (Millipore, 07-689), Rybp (Abcam, ab3637), Kdm2b (Millipore, 09-864). ChIPs were performed on 4 biological replicates of ESC and NPC. Samples described in Table S3 were processed for high throughput sequencing. Sequencing libraries were prepared as described (Bowman et al., 2013). Sequencing was performed on Illumina HiSeq 2000, resulting in ∼30 million reads per sample.
RNA Analysis
Total RNA was isolated from two biological replicates of each cell type using TRIzol (Invitrogen) by following manufacturer's guidelines, and DNase treated. rRNA was depleted using Ribo-Zero Gold kit (Illumina). Second strand synthesis was done using TruSeq RNA library prep kit (Illumina). Sequencing libraries were prepared from the resulting cDNA as above.
DNA FISH
Alexa 647 labeled Oligopaint FISH probe library was prepared as described (Beliveau et al., 2012) with minor modifications. Cells were fixed in 4% PFA and permeabilized in PBS/0.5% Triton X-100 on ice. After washes in PBS, cellular RNA was removed by RNase A (Life Technology) for 90 min at 37°C. Cells were washed in PBS and dehydrated through a 70-100% ethanol series. Coverslip was placed over hybridization solution (50% formamide, 2X SSC, 10% dextran sulfate, 0.1 mg/mL mouse Cotl DNA, 0.25 pmol/μL of Alexa 647 labeled primary oligos and 0.25 pmol/μL of Cy3 labeled secondary oligos) on a slide and sealed with rubber cement. Denaturation was performed at 94°C for 10 min on a PCR block and slides were incubated at 37°C overnight in a humidified chamber. Cells were washed three times in 2× SSC and dehydrated through a 70-100%) ethanol series. Dried cells were stored in dark until imaging.
STORM imaging
STORM imaging was performed as described (Sunwoo et al., 2015). Briefly, cells were imaged on an N-STORM (Nikon) equipped with 100×/1.4 N.A. λ objective lens, ion X3 EM CCD camera (Andor), and 647 nm, 561 nm, and 405 nm lasers. Imaging buffer contained 147 mM βME and GluOX (Sigma). For 3D STORM imaging, cylindrical lens was inserted to the optical path to introduce astigmatism. 3D Z calibration was performed using 100 nm TetraSpeck beads (Life Technology). N-STORM module in Element software (Nikon) was used to control microscopes, acquire images, and perform 2D and 3D STORM localizations.
Western Blotting
Protein extracts were denatured at 95°C in 5× reducing loading buffer, separated by SDS-PAGE using a 4-12% NuPAGE Bis-Tris gel (Life Technologies), and transferred to nitrocellulose membrane (Bio-Rad). Membranes were blocked at room temperature for 1 hr with 5% milk in TBS+0.1% Tween20, incubated overnight at 4°C with antibodies and washed 3 times at room temperature with 1% milk in TBS+0.1% Tween20. Membranes were then incubated for 1 hr at room temperature with a secondary antibody based on the source of the primary antibody, and again washed 3 times at room temperature with 1% milk in TBS+0.1% Tween20. Membranes were imaged on a LI-COR Odyssey Imager.
Quantification and Statistical Analysis
5C analysis
A detailed version of the analysis with images can be found in DataS1.
I. Sequence Alignment
In total 2845 primers (1418 forward and 1427 reverse) were designed to simultaneously interrogate 2023486 potential interactions (Lajoie et al. 2009). Next generation sequencing of 5C libraries was performed on Illumina HiSeq 2500 instrument, resulting in ∼60 million pairs of 100-bp paired-end reads per sample. Each read was independently mapped to the reference set of 5C primers using BWA with default parameters. In approximately 87% read pairs, both reads could be uniquely mapped to two primers of opposite direction. Mapping statistics for individual samples are shown in Table S3.
II. Filtering abnormal primers and primer interactions
Primers were ranked by the number of aligned reads, and primers with extremely low and high numbers of aligned reads were analyzed for potential artifacts. We found that the fraction of cis reads among total reads mapped to a given primer sharply drops for top 5% primers. To reduce potential effects of PCR blowouts in inter-chromosomal interactions, we removed these top 5% primers from further analysis. We also found that the total number of mapped reads rapidly drops by at least an order of magnitude for the bottom 5% of primers. Removing these low-count primers yields more consistent eigenvalues and avoids artificial over-estimation in the next normalization steps.
We then removed pairs of immediately adjacent opposite primers from further analyses, as a conservative filter to exclude interactions with highest noise levels. Therefore, the shortest primer distances included in our analyses corresponded to the closest opposite non-adjacent primers. The median shortest non-adjacent primer pair distance is 6.5Kb.
III. Correction of individual primer biases
The matrix of observed interactions Mij reflects raw contact counts between primers i and j. These counts are affected by multiple biases including chromatin accessibility, nucleosome occupancy, cross-linking efficiency, primer annealing efficiency and PCR amplification etc. To address the biases introduced by experimental procedures and by intrinsic properties of genomic sites, we applied a procedure of one dimensional primer bias correction conceptually similar to the correction that has been previously used in Hi-C experiments (Imakaev et al., 2012; Rao et al., 2014). This procedure is based on the assumption that the true matrix of contact probability can be derived as Tij=BiMijBj, where the Bi is the unknown vector of bias factors for each individual locus. One can solve for this bias vector Bi by assuming that the total of all interactions for each locus is the same; say the sum of interactions in each row and column of Tij is equal to 1. Imakaev et al have shown that the resulting multiplicative one-dimensional bias factor is highly consistent with a more explicit multiplicative model (Yaffe and Tanay, 2011) that takes into account fragment mappability, fragment GC content, and fragment length in Hi-C experiments.
Our approach to bias correction is conceptually similar to (Imakaev et al., 2012; Rao et al., 2014) and is based on similar general assumptions, with one notable difference. The method by (Imakaev et al., 2012; Rao et al., 2014) is applied to whole-genome Hi-C data as the matrix of counts for interactions between genomic bins of fixed size. Given the local nature of genomic regions, higher primer density, and higher sequencing depth per interaction, we were able to achieve robust signal at higher spatial resolution by applying the bias correction approach to individual primers as opposed to genomic bins. Specifically, we applied iterative correction module Hic-lib (Imakaev et al., 2012) to the matrix of counts for individual primer pairs, solved for the bias vector Bi, resulting in the new matrix of primer-primer contact probability Tij. In addition to eliminating the count variance between primer pairs, the resulting corrected primer interaction matrix eliminates the bias in GC content.
Different from the known bias in the longer-range Hi-C experiments with larger variability of fragment sizes, in our 5C experiments variability of fragment length did not introduce a strong effect on primer interaction frequency based on raw read counts.
IV. Correction for distance dependency
Distance dependency is a key feature of background genomic interactions. Frequency of random interactions follows an approximate power-law dependency on the distance between primers. These background interactions are especially strong at short distances, which reduces signal-to-noise ratio around the diagonal of the interaction matrix. Correcting for this distance dependency is essential for the identification of self-interacting regions where short-distance interactions are characterized by high mean and variance of background frequency. Primer pair interactions were partitioned into equal-size bins of log-transformed distance, followed by the calculation of geometric mean counts for each bin. The resulting dependency of background counts on the primer distance was used in the identification of significant primer-primer interactions. Specifically, interaction frequencies were transformed into distance-specific Z-scores (Sanyal et al., 2012):
where Cij is the primer interaction frequency after bias correction, mean and s.d. are the background average and standard deviation estimated from the distance dependence model for a specific genomic distance between primers i and j. The resulting Z-score matrix accounts for the distance dependency of primer interactions and is further used in the detection of both self-interacting domains and longer-range looping interactions.
Individual primer interactions were visualized as Z-score heatmaps. In these heatmaps, we plotted the locations of both forward and reverse primers on both X and Y axes, resulting in a symmetric representation of interactions. For the purpose of smoother visualization, nonexistent interactions between two forward or two reverse primers were represented as imputed values equal to the average of adjacent existing interactions between primers of opposite directions. These average values were only used to prevent empty pixels in heatmap visualization and were not included in any quantitative analyses (bias correction, calling interaction etc). Genomic coordinates in gene tracks and ChIP-seq coverage tracks that accompany the heatmaps were rescaled according to local primer density to achieve the full correspondence with primer positions. Differences in interactions between conditions or cell types were visualized and analyzed as pairwise differences of corresponding Z-score matrices.
V. Detection of interaction domains
The resulting matrix of interaction Z-scores for individual primer pairs is further used to detect consistent interactions between groups of closely located primers (interaction domains). These domains of enriched interactions are identified by comparing a region of the matrix to local interaction background. Interaction between two different groups of primers (chromatin looping) is represented by a local off-diagonal region with Z-scores higher than those in the adjacent regions of the matrix. Interaction within the same group of primers (chromatin compaction) is represented by a local diagonal region of the matrix with high Z-scores. Specifically, for all off-diagonal rectangular regions of given dimensions (m × n primers, m ≥ 5, n ≥ 5), we calculated Wilcoxon rank-sum test statistics for Z-scores within this region D={i,j} (i=a,…, a+m; j=b,…, b+n) against Z-scores in the adjacent lower, upper, left, and right regions of the same dimensions: Lower={i,j} (i=a,…, a+m; j=b+n+1,…,b+2n), Upper={i,j} (i=a,…,a+m; j=b-n-1,…,b-1), Left={i,j} (i=a-m-1,…,a-1; j=b,…,b+n), and Right={i,j} (i=a+m+1,…,a+2m; j=b,…,b+n) (). The resulting Wilcoxon P-values were corrected for multiple testing across all regions of the matrix, resulting in four FDR values for the four adjacent regions. Interaction domains were identified as regions of significantly higher Z-scores (FDR < 0.001) compared to each of the four adjacent regions. Interaction domains corresponding to chromatin compaction were identified in a similar fashion, as square regions of a given dimension (m × m primers, m ≥ 5) on the matrix diagonal that have significantly higher Z-scores (FDR < 0.001) compared to upper and left adjacent regions of the same dimension (given the diagonal symmetry of the matrix, lower and right regions are the same as left and upper regions).
ChIP-sequencing analysis
Sequenced reads were aligned against the mm9 reference genome using BWA (Li and Durbin, 2009). Alignments were filtered for uniquely mapped reads and duplicates were removed. Input-normalized coverage tracks were generated using SPP (Kharchenko et al., 2008). Two replicates each of Phc1, Cbx7, and H2AK119Ub ChIP in ESC were sequenced.
To determine regions of ChIP-Seq tag enrichment, we analyzed tag counts in a 1 Kb window over the chromosome length with a 200 bp step. Statistical significance of ChIP enrichment was estimated using negative binomial distribution, with the estimate of the mean based on tag counts in input, and the size parameter (s) selected based on manual inspection of peak calls. Regions of significant enrichment were generated by merging adjacent significantly enriched windows separated by 1 Kb or less. PRC1 peaks in ESC were defined as those co-occupied by Ring1b, Cbx7, Phc1 and H2AK119Ub. PRC1 peaks in NPC were defined as those co-occupied by Ring1b, Cbx8 and Cbx2.
RNA-Seq Analysis
Sequence tags were aligned to the mouse genome (mm9) using TopHat (Trapnell et al., 2009). FPKM values and differential gene expression were calculated using Cufflinks (Trapnell et al., 2010) and Cuffdiff (Trapnell et al., 2013) packages respectively.
STORM image analysis
STORM image analysis was done using methods described in Beliveau et al. 2015, and MATLAB tools. HoxA – n = 11 (WT ESC), 16 (NPC), 17 (Phc1-KO), HoxB – n = 20 (WT ESC), 21 (NPC), 15 (Phc1-KO), HoxD – n = 29 (WT ESC), 20 (NPC), 32 (Phc1-KO), Control – region in Chr11 gene desert n = 30 (WT ESC), 40 (NPC), 38 (Phc1-KO). Statistical significance of differences examined by Student's t-test is indicated.
Data And Software Availability
All sequencing data have been deposited in GEO under the accession number GSE89949.
Supplementary Material
Highlights.
PRC1-repressed loci form isolated self-interacting domains of compacted chromatin.
Decompaction of developmentally regulated loci follows PRC1 loss upon differentiation.
Chromatin compaction requires canonical PRC1 but not variant PRC1 or H2AK119Ub.
PRC1 -associated domains are distinct from topologically associated domains.
Acknowledgments
We thank Wendy Bickmore for sharing Ring1b-/- and Ring1bI53A/I53A ESC, Timothy Bestor for Kdm2bT/T ESC and Stuart Orkin for Ezh2-/- ESC lines; Amartya Sanyal and Bryan Lajoie for advice on 5C; Alistair Boettiger for advice on STORM image analysis; and U. Kim and the MGH Next Generation Sequencing Core. We also thank Sharon Marr for critical reading of the manuscript, and members of the Kingston lab for helpful discussions. This work was supported by the National Institute of General Medical Sciences of the NIH (5R01GM043901-24) to R.E.K., R01-GM090278 to J.T.L., NIH P30 DK40561 to R.I.S., HG003143 and DK107980 to J.D. J.T.L. and J.D. are Investigators of the Howard Hughes Medical Institute.
Footnotes
Author contributions: S.K. and R.E.K. designed the project. H.S. performed DNA FISH and STORM imaging. S.K. conducted all other experiments. R.I.S. and F.J. devised and carried out bioinformatics analyses. G.J. and J.D. did 5C primer design and provided guidance on analysis. S.K. and R.E.K. wrote the manuscript.
Publisher's Disclaimer: This is a PDF file of an unedited manuscript that has been accepted for publication. As a service to our customers we are providing this early version of the manuscript. The manuscript will undergo copyediting, typesetting, and review of the resulting proof before it is published in its final citable form. Please note that during the production process errors may be discovered which could affect the content, and all legal disclaimers that apply to the journal pertain.
References
- Andrey G, Montavon T, Mascrez B, Gonzalez F, Noordermeer D, Leleu M, Trono D, Spitz F, Duboule D. A Switch Between Topological Domains Underlies HoxD Genes Collinearity in Mouse Limbs. Science. 2013:1234167–1234167. doi: 10.1126/science.1234167. [DOI] [PubMed] [Google Scholar]
- Bantignies F, Roure V, Comet I, Leblanc B, Schuettengruber B, Bonnet J, Tixier V, Mas A, Cavalli G. Polycomb-dependent regulatory contacts between distant Hox loci in Drosophila. Cell. 2011;144:214–226. doi: 10.1016/j.cell.2010.12.026. [DOI] [PubMed] [Google Scholar]
- Beliveau BJ, Boettiger AN, Avendano MS, Jungmann R, McCole RB, Joyce EF, Kim-Kiselak C, Bantignies F, Fonseka CY, Erceg J, et al. Single-molecule super-resolution imaging of chromosomes and in situ haplotype visualization using Oligopaint FISH probes. Nat Commun. 2015;6:7147. doi: 10.1038/ncomms8147. [DOI] [PMC free article] [PubMed] [Google Scholar]
- Beliveau BJ, Joyce EF, Apostolopoulos N, Yilmaz F, Fonseka CY, McCole RB, Chang Y, Li JB, Senaratne TN, Williams BR, et al. Versatile design and synthesis platform for visualizing genomes with Oligopaint FISH probes. Proc Natl Acad Sci U S A. 2012;109:21301–21306. doi: 10.1073/pnas.1213818110. [DOI] [PMC free article] [PubMed] [Google Scholar]
- Bernstein BE, Mikkelsen TS, Xie X, Kamal M, Huebert DJ, Cuff J, Fry B, Meissner A, Wernig M, Plath K, et al. A bivalent chromatin structure marks key developmental genes in embryonic stem cells. Cell. 2006;125:315–326. doi: 10.1016/j.cell.2006.02.041. [DOI] [PubMed] [Google Scholar]
- Blackledge NP, Farcas AM, Kondo T, King HW, McGouran JF, Hanssen LL, Ito S, Cooper S, Kondo K, Koseki Y, et al. Variant PRC1 complex-dependent H2A ubiquitylation drives PRC2 recruitment and polycomb domain formation. Cell. 2014;157:1445–1459. doi: 10.1016/j.cell.2014.05.004. [DOI] [PMC free article] [PubMed] [Google Scholar]
- Boettiger AN, Bintu B, Moffitt JR, Wang S, Beliveau BJ, Fudenberg G, Imakaev M, Mirny LA, Wu CT, Zhuang X. Super-resolution imaging reveals distinct chromatin folding for different epigenetic states. Nature. 2016;529:418–422. doi: 10.1038/nature16496. [DOI] [PMC free article] [PubMed] [Google Scholar]
- Boulard M, Edwards JR, Bestor TH. FBXL10 protects Polycomb-bound genes from hypermethylation. Nat Genet. 2015;47:479–485. doi: 10.1038/ng.3272. [DOI] [PubMed] [Google Scholar]
- Bowman SK, Deaton AM, Domingues H, Wang PI, Sadreyev RI, Kingston RE, Bender W. H3K27 modifications define segmental regulatory domains in the Drosophila bithorax complex. Elife. 2014;3:e02833. doi: 10.7554/eLife.02833. [DOI] [PMC free article] [PubMed] [Google Scholar]
- Bowman SK, Simon MD, Deaton AM, Tolstorukov M, Borowsky ML, Kingston RE. Multiplexed Illumina sequencing libraries from picogram quantities of DNA. BMC Genomics. 2013;14:466. doi: 10.1186/1471-2164-14-466. [DOI] [PMC free article] [PubMed] [Google Scholar]
- Briscoe J, Sussel L, Serup P, Hartigan-O'Connor D, Jessell TM, Rubenstein JL, Ericson J. Homeobox gene Nkx2.2 and specification of neuronal identity by graded Sonic hedgehog signalling. Nature. 1999;398:622–627. doi: 10.1038/19315. [DOI] [PubMed] [Google Scholar]
- Buchwald G, van der Stoop P, Weichenrieder O, Perrakis A, van Lohuizen M, Sixma TK. Structure and E3-ligase activity of the Ring-Ring complex of polycomb proteins Bmi1 and Ring1b. EMBO J. 2006;25:2465–2474. doi: 10.1038/sj.emboj.7601144. [DOI] [PMC free article] [PubMed] [Google Scholar]
- Campos EI, Stafford JM, Reinberg D. Epigenetic inheritance: histone bookmarks across generations. Trends Cell Biol. 2014;24:664–674. doi: 10.1016/j.tcb.2014.08.004. [DOI] [PMC free article] [PubMed] [Google Scholar]
- Cao R, Wang L, Wang H, Xia L, Erdjument-Bromage H, Tempst P, Jones RS, Zhang Y. Role of histone H3 lysine 27 methylation in Polycomb-group silencing. Science. 2002;298:1039–1043. doi: 10.1126/science.1076997. [DOI] [PubMed] [Google Scholar]
- Carey MF, Peterson CL, Smale ST. Chromatin immunoprecipitation (ChIP) Cold Spring Harbor protocols. 2009;2009 doi: 10.1101/pdb.prot5279. pdb prot5279. [DOI] [PubMed] [Google Scholar]
- Cheutin T, Cavalli G. Polycomb silencing: from linear chromatin domains to 3D chromosome folding. Curr Opin Genet Dev. 2014;25:30–37. doi: 10.1016/j.gde.2013.11.016. [DOI] [PubMed] [Google Scholar]
- Creppe C, Palau A, Malinverni R, Valero V, Buschbeck M. A Cbx8-containing polycomb complex facilitates the transition to gene activation during ES cell differentiation. PLoS Genet. 2014;10:e1004851. doi: 10.1371/journal.pgen.1004851. [DOI] [PMC free article] [PubMed] [Google Scholar]
- Czermin B, Melfi R, McCabe D, Seitz V, Imhof A, Pirrotta V. Drosophila enhancer of Zeste/ESC complexes have a histone H3 methyltransferase activity that marks chromosomal Polycomb sites. Cell. 2002;111:185–196. doi: 10.1016/s0092-8674(02)00975-3. [DOI] [PubMed] [Google Scholar]
- Darbellay F, Duboule D. Topological Domains, Metagenes, and the Emergence of Pleiotropic Regulations at Hox Loci. Curr Top Dev Biol. 2016;116:299–314. doi: 10.1016/bs.ctdb.2015.11.022. [DOI] [PubMed] [Google Scholar]
- Di Croce L, Helin K. Transcriptional regulation by Polycomb group proteins. Nat Struct Mol Biol. 2013;20:1147–1155. doi: 10.1038/nsmb.2669. [DOI] [PubMed] [Google Scholar]
- Dixon JR, Jung I, Selvaraj S, Shen Y, Antosiewicz-Bourget JE, Lee AY, Ye Z, Kim A, Rajagopal N, Xie W, et al. Chromatin architecture reorganization during stem cell differentiation. Nature. 2015;518:331–336. doi: 10.1038/nature14222. [DOI] [PMC free article] [PubMed] [Google Scholar]
- Dixon JR, Selvaraj S, Yue F, Kim A, Li Y, Shen Y, Hu M, Liu JS, Ren B. Topological domains in mammalian genomes identified by analysis of chromatin interactions. Nature. 2012;485:376–380. doi: 10.1038/nature11082. [DOI] [PMC free article] [PubMed] [Google Scholar]
- Dostie J, Richmond TA, Arnaout RA, Selzer RR, Lee WL, Honan TA, Rubio ED, Krumm A, Lamb J, Nusbaum C, et al. Chromosome Conformation Capture Carbon Copy (5C): a massively parallel solution for mapping interactions between genomic elements. Genome Res. 2006;16:1299–1309. doi: 10.1101/gr.5571506. [DOI] [PMC free article] [PubMed] [Google Scholar]
- Entrevan M, Schuettengruber B, Cavalli G. Regulation of Genome Architecture and Function by Polycomb Proteins. Trends Cell Biol. 2016 doi: 10.1016/j.tcb.2016.04.009. [DOI] [PubMed] [Google Scholar]
- Ericson J, Rashbass P, Schedl A, Brenner-Morton S, Kawakami A, van Heyningen V, Jessell TM, Briscoe J. Pax6 controls progenitor cell identity and neuronal fate in response to graded Shh signaling. Cell. 1997;90:169–180. doi: 10.1016/s0092-8674(00)80323-2. [DOI] [PubMed] [Google Scholar]
- Eskeland R, Leeb M, Grimes GR, Kress C, Boyle S, Sproul D, Gilbert N, Fan Y, Skoultchi AI, Wutz A, et al. Ring1B compacts chromatin structure and represses gene expression independent of histone ubiquitination. Mol Cell. 2010;38:452–464. doi: 10.1016/j.molcel.2010.02.032. [DOI] [PMC free article] [PubMed] [Google Scholar]
- Farcas AM, Blackledge NP, Sudbery I, Long HK, McGouran JF, Rose NR, Lee S, Sims D, Cerase A, Sheahan TW, et al. KDM2B links the Polycomb Repressive Complex 1 (PRC1) to recognition of CpG islands. Elife. 2012;1:e00205. doi: 10.7554/eLife.00205. [DOI] [PMC free article] [PubMed] [Google Scholar]
- Francis NJ, Kingston RE, Woodcock CL. Chromatin compaction by a polycomb group protein complex. Science. 2004;306:1574–1577. doi: 10.1126/science.1100576. [DOI] [PubMed] [Google Scholar]
- Gao Z, Zhang J, Bonasio R, Strino F, Sawai A, Parisi F, Kluger Y, Reinberg D. PCGF homologs, CBX proteins, and RYBP define functionally distinct PRC1 family complexes. Mol Cell. 2012;45:344–356. doi: 10.1016/j.molcel.2012.01.002. [DOI] [PMC free article] [PubMed] [Google Scholar]
- Grau DJ, Chapman BA, Garlick JD, Borowsky M, Francis NJ, Kingston RE. Compaction of chromatin by diverse Polycomb group proteins requires localized regions of high charge. Genes Dev. 2011;25:2210–2221. doi: 10.1101/gad.17288211. [DOI] [PMC free article] [PubMed] [Google Scholar]
- Hou C, Li L, Qin ZS, Corces VG. Gene density, transcription, and insulators contribute to the partition of the Drosophila genome into physical domains. Mol Cell. 2012;48:471–484. doi: 10.1016/j.molcel.2012.08.031. [DOI] [PMC free article] [PubMed] [Google Scholar]
- Illingworth RS, Moffat M, Mann AR, Read D, Hunter CJ, Pradeepa MM, Adams IR, Bickmore WA. The E3 ubiquitin ligase activity of RING1B is not essential for early mouse development. Genes Dev. 2015;29:1897–1902. doi: 10.1101/gad.268151.115. [DOI] [PMC free article] [PubMed] [Google Scholar]
- Imakaev M, Fudenberg G, McCord RP, Naumova N, Goloborodko A, Lajoie BR, Dekker J, Mirny LA. Iterative correction of Hi-C data reveals hallmarks of chromosome organization. Nat Methods. 2012;9:999–1003. doi: 10.1038/nmeth.2148. [DOI] [PMC free article] [PubMed] [Google Scholar]
- Isono K, Endo TA, Ku M, Yamada D, Suzuki R, Sharif J, Ishikura T, Toyoda T, Bernstein BE, Koseki H. SAM domain polymerization links subnuclear clustering of PRC1 to gene silencing. Dev Cell. 2013;26:565–577. doi: 10.1016/j.devcel.2013.08.016. [DOI] [PubMed] [Google Scholar]
- Kagey MH, Newman JJ, Bilodeau S, Zhan Y, Orlando DA, van Berkum NL, Ebmeier CC, Goossens J, Rahl PB, Levine SS, et al. Mediator and cohesin connect gene expression and chromatin architecture. Nature. 2010;467:430–435. doi: 10.1038/nature09380. [DOI] [PMC free article] [PubMed] [Google Scholar]
- Kharchenko PV, Tolstorukov MY, Park PJ. Design and analysis of ChIP-seq experiments for DNA-binding proteins. Nat Biotechnol. 2008;26:1351–1359. doi: 10.1038/nbt.1508. [DOI] [PMC free article] [PubMed] [Google Scholar]
- Kuzmichev A, Nishioka K, Erdjument-Bromage H, Tempst P, Reinberg D. Histone methyltransferase activity associated with a human multiprotein complex containing the Enhancer of Zeste protein. Genes Dev. 2002;16:2893–2905. doi: 10.1101/gad.1035902. [DOI] [PMC free article] [PubMed] [Google Scholar]
- Lajoie BR, van Berkum NL, Sanyal A, Dekker J. My5C: web tools for chromosome conformation capture studies. Nat Methods. 2009;6:690–691. doi: 10.1038/nmeth1009-690. [DOI] [PMC free article] [PubMed] [Google Scholar]
- Lewis PW, Muller MM, Koletsky MS, Cordero F, Lin S, Banaszynski LA, Garcia BA, Muir TW, Becher OJ, Allis CD. Inhibition of PRC2 activity by a gain-of-function H3 mutation found in pediatric glioblastoma. Science. 2013;340:857–861. doi: 10.1126/science.1232245. [DOI] [PMC free article] [PubMed] [Google Scholar]
- Li H, Durbin R. Fast and accurate short read alignment with Burrows-Wheeler transform. Bioinformatics. 2009;25:1754–1760. doi: 10.1093/bioinformatics/btp324. [DOI] [PMC free article] [PubMed] [Google Scholar]
- Lonfat N, Duboule D. Structure, function and evolution of topologically associating domains (TADs) at HOX loci. FEBS Lett. 2015;589:2869–2876. doi: 10.1016/j.febslet.2015.04.024. [DOI] [PubMed] [Google Scholar]
- Mazzoni EO, Mahony S, Peljto M, Patel T, Thornton SR, McCuine S, Reeder C, Boyer LA, Young RA, Gifford DK, et al. Saltatory remodeling of Hox chromatin in response to rostrocaudal patterning signals. Nat Neurosci. 2013;16:1191–1198. doi: 10.1038/nn.3490. [DOI] [PMC free article] [PubMed] [Google Scholar]
- Morey L, Aloia L, Cozzuto L, Benitah SA, Di Croce L. RYBP and Cbx7 define specific biological functions of polycomb complexes in mouse embryonic stem cells. Cell Rep. 2013;3:60–69. doi: 10.1016/j.celrep.2012.11.026. [DOI] [PubMed] [Google Scholar]
- Morey L, Pascual G, Cozzuto L, Roma G, Wutz A, Benitah SA, Di Croce L. Nonoverlapping functions of the Polycomb group Cbx family of proteins in embryonic stem cells. Cell Stem Cell. 2012;10:47–62. doi: 10.1016/j.stem.2011.12.006. [DOI] [PubMed] [Google Scholar]
- Muller J, Hart CM, Francis NJ, Vargas ML, Sengupta A, Wild B, Miller EL, O'Connor MB, Kingston RE, Simon JA. Histone methyltransferase activity of a Drosophila Polycomb group repressor complex. Cell. 2002;111:197–208. doi: 10.1016/s0092-8674(02)00976-5. [DOI] [PubMed] [Google Scholar]
- Narendra V, Rocha PP, An D, Raviram R, Skok JA, Mazzoni EO, Reinberg D. Transcription. CTCF establishes discrete functional chromatin domains at the Hox clusters during differentiation. Science. 2015;347:1017–1021. doi: 10.1126/science.1262088. [DOI] [PMC free article] [PubMed] [Google Scholar]
- Noordermeer D, Leleu M, Splinter E, Rougemont J, de Laat W, Duboule D. The Dynamic Architecture of Hox Gene Clusters. Science. 2011:222–225. doi: 10.1126/science.1207194. [DOI] [PubMed] [Google Scholar]
- O'Loghlen A, Munoz-Cabello AM, Gaspar-Maia A, Wu HA, Banito A, Kunowska N, Racek T, Pemberton HN, Beolchi P, Lavial F, et al. MicroRNA regulation of Cbx7 mediates a switch of Polycomb orthologs during ESC differentiation. Cell Stem Cell. 2012;10:33–46. doi: 10.1016/j.stem.2011.12.004. [DOI] [PMC free article] [PubMed] [Google Scholar]
- Pengelly AR, Copur O, Jackle H, Herzig A, Muller J. A histone mutant reproduces the phenotype caused by loss of histone-modifying factor Polycomb. Science. 2013;339:698–699. doi: 10.1126/science.1231382. [DOI] [PubMed] [Google Scholar]
- Phillips-Cremins JE, Sauria ME, Sanyal A, Gerasimova TI, Lajoie BR, Bell JS, Ong CT, Hookway TA, Guo C, Sun Y, et al. Architectural protein subclasses shape 3D organization of genomes during lineage commitment. Cell. 2013;153:1281–1295. doi: 10.1016/j.cell.2013.04.053. [DOI] [PMC free article] [PubMed] [Google Scholar]
- Pollard SM, Benchoua A, Lowell S. Neural stem cells, neurons, and glia. Methods Enzymol. 2006;418:151–169. doi: 10.1016/S0076-6879(06)18010-6. [DOI] [PubMed] [Google Scholar]
- Rao SS, Huntley MH, Durand NC, Stamenova EK, Bochkov ID, Robinson JT, Sanborn AL, Machol I, Omer AD, Lander ES, et al. A 3D map of the human genome at kilobase resolution reveals principles of chromatin looping. Cell. 2014;159:1665–1680. doi: 10.1016/j.cell.2014.11.021. [DOI] [PMC free article] [PubMed] [Google Scholar]
- Schoenfelder S, Sugar R, Dimond A, Javierre BM, Armstrong H, Mifsud B, Dimitrova E, Matheson L, Tavares-Cadete F, Furlan-Magaril M, et al. Polycomb repressive complex PRC1 spatially constrains the mouse embryonic stem cell genome. Nat Genet. 2015;47:1179–1186. doi: 10.1038/ng.3393. [DOI] [PMC free article] [PubMed] [Google Scholar]
- Schwartzentruber J, Korshunov A, Liu XY, Jones DT, Pfaff E, Jacob K, Sturm D, Fontebasso AM, Quang DA, Tonjes M, et al. Driver mutations in histone H3.3 and chromatin remodelling genes in paediatric glioblastoma. Nature. 2012;482:226–231. doi: 10.1038/nature10833. [DOI] [PubMed] [Google Scholar]
- Shen X, Liu Y, Hsu YJ, Fujiwara Y, Kim J, Mao X, Yuan GC, Orkin SH. EZH1 mediates methylation on histone H3 lysine 27 and complements EZH2 in maintaining stem cell identity and executing pluripotency. Mol Cell. 2008;32:491–502. doi: 10.1016/j.molcel.2008.10.016. [DOI] [PMC free article] [PubMed] [Google Scholar]
- Simon JA, Kingston RE. Occupying chromatin: Polycomb mechanisms for getting to genomic targets, stopping transcriptional traffic, and staying put. Mol Cell. 2013;49:808–824. doi: 10.1016/j.molcel.2013.02.013. [DOI] [PMC free article] [PubMed] [Google Scholar]
- Sofueva S, Yaffe E, Chan WC, Georgopoulou D, Vietri Rudan M, Mira-Bontenbal H, Pollard SM, Schroth GP, Tanay A, Hadjur S. Cohesin-mediated interactions organize chromosomal domain architecture. EMBO J. 2013;32:3119–3129. doi: 10.1038/emboj.2013.237. [DOI] [PMC free article] [PubMed] [Google Scholar]
- Soshnikova N, Duboule D. Epigenetic temporal control of mouse Hox genes in vivo. Science. 2009;324:1320–1323. doi: 10.1126/science.1171468. [DOI] [PubMed] [Google Scholar]
- Steffen PA, Ringrose L. What are memories made of? How Polycomb and Trithorax proteins mediate epigenetic memory. Nat Rev Mol Cell Biol. 2014;15:340–356. doi: 10.1038/nrm3789. [DOI] [PubMed] [Google Scholar]
- Sunwoo H, Wu JY, Lee JT. The Xist RNA-PRC2 complex at 20-nm resolution reveals a low Xist stoichiometry and suggests a hit-and-run mechanism in mouse cells. Proc Natl Acad Sci U S A. 2015;112:E4216–4225. doi: 10.1073/pnas.1503690112. [DOI] [PMC free article] [PubMed] [Google Scholar]
- Tavares L, Dimitrova E, Oxley D, Webster J, Poot R, Demmers J, Bezstarosti K, Taylor S, Ura H, Koide H, et al. RYBP-PRC1 complexes mediate H2A ubiquitylation at polycomb target sites independently of PRC2 and H3K27me3. Cell. 2012;148:664–678. doi: 10.1016/j.cell.2011.12.029. [DOI] [PMC free article] [PubMed] [Google Scholar]
- Trapnell C, Hendrickson DG, Sauvageau M, Goff L, Rinn JL, Pachter L. Differential analysis of gene regulation at transcript resolution with RNA-seq. Nat Biotechnol. 2013;31:46–53. doi: 10.1038/nbt.2450. [DOI] [PMC free article] [PubMed] [Google Scholar]
- Trapnell C, Pachter L, Salzberg SL. TopHat: discovering splice junctions with RNA-Seq. Bioinformatics. 2009;25:1105–1111. doi: 10.1093/bioinformatics/btp120. [DOI] [PMC free article] [PubMed] [Google Scholar]
- Trapnell C, Williams BA, Pertea G, Mortazavi A, Kwan G, van Baren MJ, Salzberg SL, Wold BJ, Pachter L. Transcript assembly and quantification by RNA-Seq reveals unannotated transcripts and isoform switching during cell differentiation. Nat Biotechnol. 2010;28:511–515. doi: 10.1038/nbt.1621. [DOI] [PMC free article] [PubMed] [Google Scholar]
- van Berkum NL, Dekker J. Determining spatial chromatin organization of large genomic regions using 5C technology. Methods Mol Biol. 2009;567:189–213. doi: 10.1007/978-1-60327-414-2_13. [DOI] [PMC free article] [PubMed] [Google Scholar]
- Voigt P, Reinberg D. Putting a halt on PRC2 in pediatric glioblastoma. Nat Genet. 2013;45:587–589. doi: 10.1038/ng.2647. [DOI] [PubMed] [Google Scholar]
- Wang H, Wang L, Erdjument-Bromage H, Vidal M, Tempst P, Jones RS, Zhang Y. Role of histone H2A ubiquitination in Polycomb silencing. Nature. 2004;431:873–878. doi: 10.1038/nature02985. [DOI] [PubMed] [Google Scholar]
- Wang KC, Yang YW, Liu B, Sanyal A, Corces-Zimmerman R, Chen Y, Lajoie BR, Protacio A, Flynn RA, Gupta RA, et al. A long noncoding RNA maintains active chromatin to coordinate homeotic gene expression. Nature. 2011;472:120–124. doi: 10.1038/nature09819. [DOI] [PMC free article] [PubMed] [Google Scholar]
- Wani AH, Boettiger AN, Schorderet P, Ergun A, Munger C, Sadreyev RI, Zhuang X, Kingston RE, Francis NJ. Chromatin topology is coupled to Polycomb group protein subnuclear organization. Nat Commun. 2016;7:10291. doi: 10.1038/ncomms10291. [DOI] [PMC free article] [PubMed] [Google Scholar]
- Wu G, Broniscer A, McEachron TA, Lu C, Paugh BS, Becksfort J, Qu C, Ding L, Huether R, Parker M, et al. Somatic histone H3 alterations in pediatric diffuse intrinsic pontine gliomas and non-brainstem glioblastomas. Nat Genet. 2012;44:251–253. doi: 10.1038/ng.1102. [DOI] [PMC free article] [PubMed] [Google Scholar]
- Yaffe E, Tanay A. Probabilistic modeling of Hi-C contact maps eliminates systematic biases to characterize global chromosomal architecture. Nat Genet. 2011;43:1059–1065. doi: 10.1038/ng.947. [DOI] [PubMed] [Google Scholar]
Associated Data
This section collects any data citations, data availability statements, or supplementary materials included in this article.