Abstract
Background:
The active ingredients and thus pharmacological efficacy of traditional Chinese medicine (TCM) at different degrees of parching process vary greatly.
Objective:
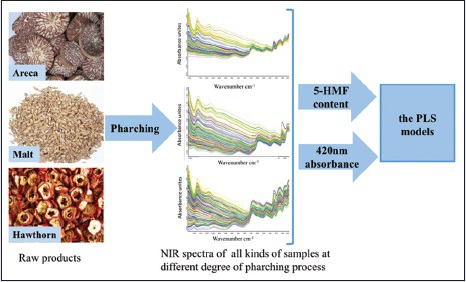
Near-infrared spectroscopy (NIR) was used to develop a new method for rapid online analysis of TCM parching process, using two kinds of chemical indicators (5-(hydroxymethyl) furfural [5-HMF] content and 420 nm absorbance) as reference values which were obviously observed and changed in most TCM parching process.
Materials and Methods:
Three representative TCMs, Areca (Areca catechu L.), Malt (Hordeum Vulgare L.), and Hawthorn (Crataegus pinnatifida Bge.), were used in this study. With partial least squares regression, calibration models of NIR were generated based on two kinds of reference values, i.e. 5-HMF contents measured by high-performance liquid chromatography (HPLC) and 420 nm absorbance measured by ultraviolet–visible spectroscopy (UV/Vis), respectively.
Results:
In the optimized models for 5-HMF, the root mean square errors of prediction (RMSEP) for Areca, Malt, and Hawthorn was 0.0192, 0.0301, and 0.2600 and correlation coefficients (Rcal) were 99.86%, 99.88%, and 99.88%, respectively. Moreover, in the optimized models using 420 nm absorbance as reference values, the RMSEP for Areca, Malt, and Hawthorn was 0.0229, 0.0096, and 0.0409 and Rcal were 99.69%, 99.81%, and 99.62%, respectively.
Conclusions:
NIR models with 5-HMF content and 420 nm absorbance as reference values can rapidly and effectively identify three kinds of TCM in different parching processes. This method has great promise to replace current subjective color judgment and time-consuming HPLC or UV/Vis methods and is suitable for rapid online analysis and quality control in TCM industrial manufacturing process.
SUMMARY
Near-infrared spectroscopy.(NIR) was used to develop a new method for online analysis of traditional Chinese medicine.(TCM) parching process
Calibration and validation models of Areca, Malt, and Hawthorn were generated by partial least squares regression using 5.(hydroxymethyl) furfural contents and 420.nm absorbance as reference values, respectively, which were main indicator components during parching process of most TCM
The established NIR models of three TCMs had low root mean square errors of prediction and high correlation coefficients
The NIR method has great promise for use in TCM industrial manufacturing processes for rapid online analysis and quality control.

Abbreviations used: NIR: Near-infrared Spectroscopy; TCM: Traditional Chinese medicine; Areca: Areca catechu L.; Hawthorn: Crataegus pinnatifida Bge.; Malt: Hordeum vulgare L.; 5-HMF: 5-(hydroxymethyl) furfural; PLS: Partial least squares; D: Dimension faction; SLS: Straight line subtraction, MSC: Multiplicative scatter correction; VN: Vector normalization; RMSECV: Root mean square errors of cross-validation; RMSEP: Root mean square errors of validation; Rcal: Correlation coefficients; RPD: Residual predictive deviation; PAT: Process analytical technology; FDA: Food and Drug Administration; ICH: International Conference on Harmonization of Technical Requirements for Registration of Pharmaceuticals for Human Use.
Keywords: 420 nm absorbance, 5-(hydroxymethyl) furfural content, near-infrared spectroscopy, partial least squares, process analytical technology tool, traditional Chinese medicine
INTRODUCTION
Parching, a process changes active ingredients and pharmacological efficacy greatly, plays an important therapeutic role in traditional Chinese medicine (TCM).[1,2,3] These changes are complex and difficult to measure. The current method to identify the degree of parching process is based on the color judgment, which is not only subjective but also unable to reflect the real variations accurately.[3] According to the International Conference on Harmonization of Technical Requirements for Registration of Pharmaceuticals for Human Use (ICH) Q8, the product performance can be gained by the application of process analytical technology (PAT).[4] Moreover, the US Food and Drug Administration (FDA) also advocated the use of PAT to improve the pharmaceutical manufacturing and quality assurance.[5] Thus, the online analysis and quality control should be studied to identify the critical sources of variability, to manage the process variability, and to improve the quality of industrial products effectively.[6,7,8,9,10,11]
Conventional high-performance liquid chromatography (HPLC) or ultraviolet–visible spectroscopy (UV/Vis) methods are not ideal for online analysis to control TCM parching process because they require tedious sample preparation and time-consuming sample analysis. Near-infrared spectroscopy (NIR) is a fast, precise, noninvasive, and nondestructive technique that requires little or no sample preparation. Recently, NIR has been routinely preferred and gradually becomes one of the most efficient online analytical tools for qualitative and quantitative analysis of herb materials, separation monitoring, and extraction process.[8,9,10,11,12,13,14,15,16,17,18] Therefore, to control the parching process and guarantee the stable quality of parched TCM, NIR spectroscopy in line with the FDAs PAT initiative and guidance was applied in online analysis of TCM parching process.[5]
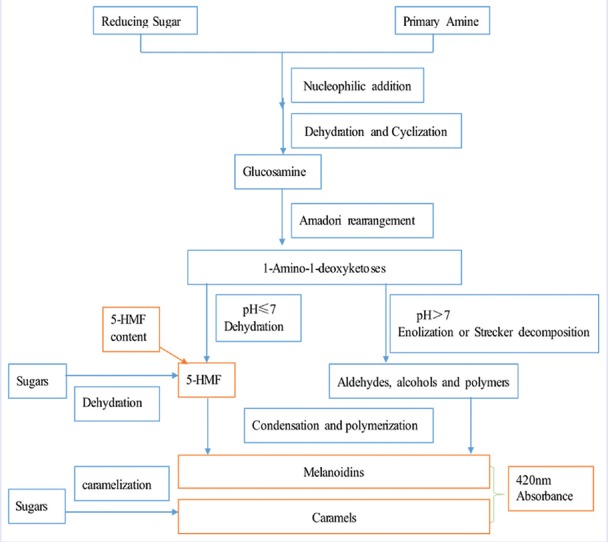
Areca, Malt, and Hawthorn have diverse pharmacological efficacy in different degrees of parching process as common TCM. Raw Areca is mainly used to expel parasite, whereas stir-charred Areca is used to disperse food stagnation.[3,9,19] Raw Malt's efficacy is strengthening the spleen and stomach function, stir-fried Malt is good for digestion and delectation, and stir-charred Malt is helpful in relieving dyspepsia.[3,20] Raw Hawthorn can eliminate blood stasis and alleviate pain, stir-fried Hawthorn can promote digestion, stir-charred Hawthorn is helpful in anti-diarrhea, and carbonized Hawthorn can stanch bleeding.[3,21] Hence, it is meaningful to control the parching process of these TCMs to guarantee product performance of these parched TCMs. During the parching process of most TCM, Maillard reaction (the reaction process includes nucleophilic addition, dehydration, cyclization, Amadori rearrangement, enolization, and Strecker decomposition) and caramelization reaction always occur.[22] As shown in Figure 1 and 5-(hydroxymethyl) furfural (5-HMF) is an important intermediate product, melanoidins and caramels are the main end products. The reaction degree of browning could be reflected indirectly by measuring the absorbance of nonenzymatic browning reaction products (melanoidins and caramels) at 420 nm.[22,23,24] Thus, both 5-HMF content and 420 nm absorbance change obviously in most TCM parching process and can be used as chemical indicators to reflect TCM parching process.
Figure 1.
The generation process of (5-(hydroxymethyl)furfural and other components which have high absorbance at 420 nm during parching process
In this study, we took Areca, Malt, and Hawthorn as TCM examples and used NIR to establish two kinds of models of 5-HMF contents and 420 nm absorbance for online analysis and quality control during the TCM parching process, respectively. The validation results showed that the models were robust, accurate, and repeatable for online analysis and quality control. On the above foundation, the product quality can be monitored online by NIR efficiently to get the parched products of best quality.
MATERIALS AND METHODS
Samples and reagents
Areca pieces (Yunnan, China), Hawthorn pieces (Shandong, China), and Malt (Sichuan, China) were all collected from TCM markets (Sichuan, China). Each kind of TCM weighed 18 kg was divided into 18 parts equally. Each part was stir-frying parched; the temperature of the herbal medicine during parching process was controlled by infrared thermometer (GM320, BENETECH). Parched samples were collected at 25°C, 110°C, 130°C, 150°C, 160°C, 170°C, 180°C, 190°C, 200°C, and 210°C, respectively. Hence, 18 batches of parched samples of each herbal medicine were obtained from this process, and each batch contained ten kinds of TCM of different degrees of parching process. To ensure that moisture was not an interfering factor, all samples were dried in a silica gel desiccator for at least 7 h at room temperature until the weight loss was <0.0003 g.
5-HMF was obtained from the Sigma (Sigma-Aldrich Inc., St. Louis, MO, USA). HPLC-grade methanol was obtained from Tianjin Kermel Chemical Reagent Company (Tianjin, PR China). Water was purified by an ultrapure water instrument. All other reagents were of analytical grade.
Near-infrared spectroscopy data collection
The NIR spectra of each parched sample were recorded by QuasIR 3000 spectrometer (Vspec, USA) equipped with a PbS detector, sample cup, and rotary tables. The system was operated by Essential FT-IR spectral acquisition and processing software (Operant LLC Licensed to MTG, USA). The spectra were obtained at a resolution of 8 cm−1 over a wavelength range of 12,000–4000 cm−1 with 32 scans per spectrum, and air absorbance was recorded as the reference standard. Each sample measurement was repeated two times. The average NIR spectra were shown in Figure 2.
Figure 2.
Near-infrared spectroscopy spectra of (a) Areca samples, (b) Malt samples, and (c) Hawthorn samples
Reference values collection
All parched samples were first milled into powder and then passed through 60 mesh sieves, respectively. About 1.0 g sample powder was ultrasonic extracted by 25 mL 60% methanol for 45 min and then filtrated by 0.45 μm filters to get the sample solution. A 1100 HPLC system (Agilent Technologies Inc., USA) consisting of UV/VIS detector was used for the quantitative determination of 5-HMF at a wavelength of 280 nm. A Kromasil C18 (4.6 mm × 250 mm, 5 μm) was employed in 30°C column temperature to separate and analyze 10 μL sample injections. The elution system was composed of methanol–water with 0.5% acetic acid (10:90) at a flow rate of 1.0 mL/min. The 5-HMF content was calculated by daily linear regression equation to ensure the accuracy. Each sample solution was diluted by 10 times with 60% methanol, then tested in 420 nm with UV-6300PC spectrophotometer (MAPADA, Shanghai) to get the absorbance, and the 60% methanol absorbance was recorded as the reference standard.
Data processing by partial least square
The intensity of the measurements at different wavenumbers of NIR spectra can be correlated to the concentrations of the 5-HMF and 420 nm absorbance in the sample through partial least square (PLS) with the OPUS 6.5 software (Bruker Optik, Ettlingen, Germany), respectively.
RESULTS AND DISCUSSION
Sample set selection
To ensure the representativeness of the calibration set and validation set, cluster analysis of NIR spectrum was used first to classify the samples (pretreatment method: vector normalization (VN); Spectral segment: 12,000–4000 cm−1). Each kind of TCM was divided into four categories roughly (raw, stir-fried, stir-charred, and carbonized product, shown in Figure 3). Among the 180 samples, 44 samples were selected randomly from each cluster (11 samples in one cluster) as a validation set to validate the PLS model, and the remaining 136 samples were divided into calibration set to establish the calibration model. Moreover, the calibration set contains full potential variations.
Figure 3.
Cluster analysis of (a) Areca samples, (b) Malt samples, and (c) Hawthorn samples near-infrared spectroscopy spectrum
Spectral pretreatment methods
There are ten kinds of important spectral pretreatment methods including constant offset elimination (COE), straight line subtraction (SLS), VN, min/max normalization, multiplicative scatter correction (MSC), first derivative, second derivative, first derivative + SLS, first derivative + VN, and first derivative + MSC. Each pretreatment method was utilized in each NIR spectrum to eliminate noise, baseline shift, enhance the spectral features, and matrix background interference to extract the relevant information before PLS modeling.
Development of calibration models
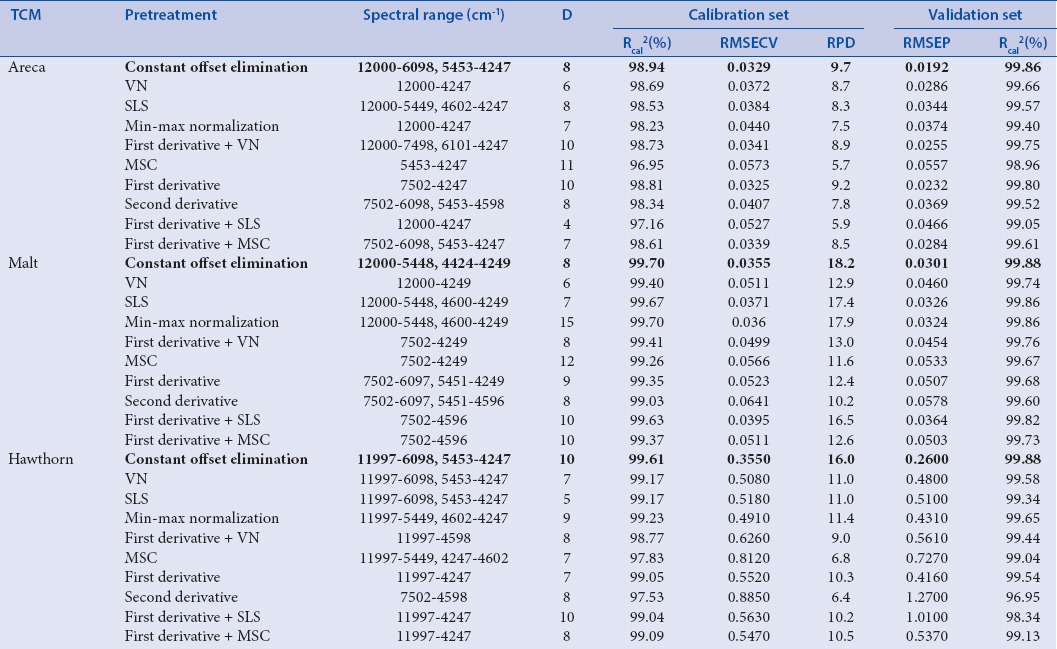
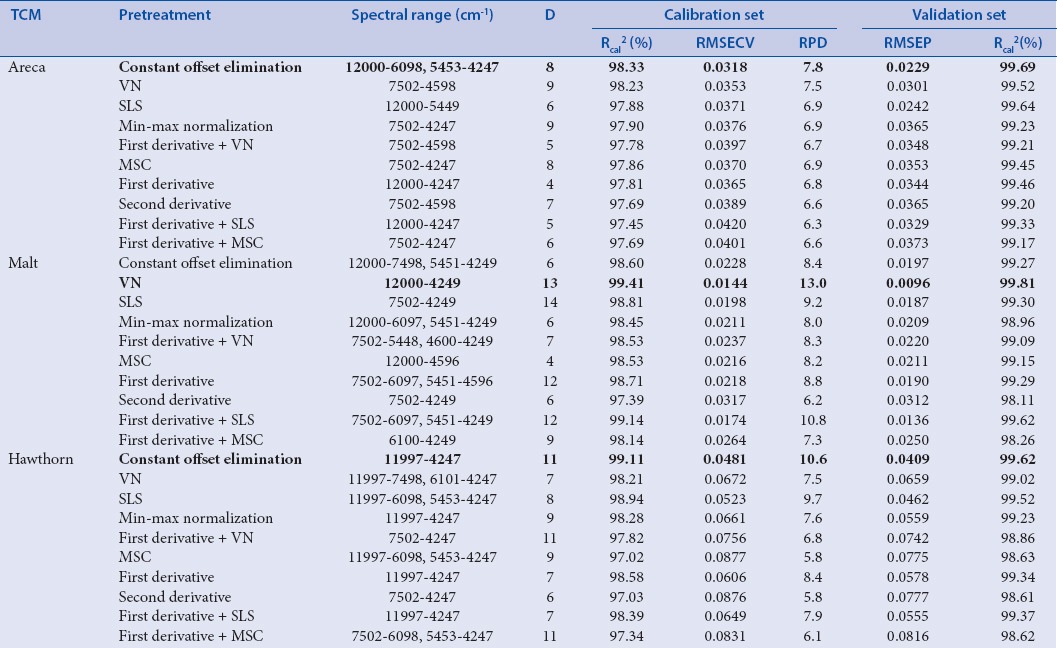
The spectral pretreatment methods, spectral range, and the dimension factor (D) are critical parameters for the optimum model in PLS. The best parameter was evaluated based on the correlation coefficients of the calibration set (Rcal%), the root mean square errors of cross-validation (RMSECV), and the residual predictive deviation (RPD). The best calibration model was selected by highest Rcal (%) and RPD as well as lowest RMSECV.
As shown in Table 1a and 1b, calibration equations were modeled with ten spectral pretreatments and optimized not only by spectral range but also by dimension factor (D).
Table 1a.
The information of partial least squares models using 5-(hydroxymethyl) furfural content as reference value

Table 1b.
The information of partial least squares models using 420 nm absorbance as reference value

The evaluation on the predicted result of the validation set
The above-optimized models were used to predict 5-HMF content and 420 nm absorbance of the samples in the validation set individually. The validation set can test the predictive ability of the optimized PLS calibration model. The optimum models were evaluated by highest Rcal (%) and lowest root mean square errors of prediction (RMSEP). The results were shown in Table 1a and 1b.
The optimized near-infrared spectroscopy model
The optimized NIR models with highest Rcal (%) and RPD, lowest RMSECV and RMSEP were selected by comparing the parameters of these models. As shown in Table 2a and 2b, calibration equations which used 5-HMF content as reference values were modeled with COE for three kinds of TCM, and calibration equations which used 420 nm absorbance as reference values were modeled with COE for Area and Hawthorn and NV for Malt. The results indicated that the established models were robust, accurate, and repeatable for online analysis and quality control.
Table 2a.
Parameters of optimal models using 5-(hydroxymethyl) furfural content as reference values

Table 2b.
Parameters of optimal models using 420 nm absorbance as reference values

CONCLUSIONS
This research indicated that NIR combined with PLS as well as using 5-HMF content and 420 nm absorbance as reference values, could provide accurate and rapid online analysis of three kinds of TCM (Areca, Malt, and Hawthorn) during parching process. The results showed that the established NIR models had low RMSEP and high correlation coefficients. Compared with the conventional analytical procedures, this method is more comprehensive, more intuitive, and more convenient, and it can be widely applied in TCM parching process because the used reference values (5-HMF content and 420 nm absorbance) in the models are chemical indicators during parching process of most TCM. Therefore, this method is promising for monitoring most kinds of TCM industrial manufacturing processes to achieve rapid online analysis and quality control ensuring stability and desired product quality.
Financial support and sponsorship
Nil.
Conflicts of interest
There are no conflicts of interest.
REFERENCES
- 1.Zhou R, Gao YG, Zang P, Jiang CL, Zhang LX. Effect of processing on active components and efficacy of traditional Chinese medicine. Chin J Exp Tradit Med Formulae. 2015;40:1425–32. [Google Scholar]
- 2.Lu YU, Sun SQ, Zhou Q. Research on parching procedure of white mustard seed with fourier transform infrared spectroscopy and two-dimensional IR correlation spectroscopy. Spectrosc Spect Anal. 2006;26:2181–5. [PubMed] [Google Scholar]
- 3.National Pharmacopoeia Committee; China Food and Drug Administration. Pharmacopoeia of the People's Republic of China. Beijing, China: Chinese Medical Science and Technology; 2015. [Google Scholar]
- 4.ICH Q8 (R2), Pharmaceutical Development: Part I: Pharmaceutical Development, Part II: Annex to Pharmaceutical Development. [Last updated on 2009 Aug 20]. Available from: http://www.ich.org/fileadmin/Public_Web_Site/ICH_Products/Guidelines/Quality/Q8_R1/Step4/Q8_R2_Guideline.pdf .
- 5.US. Food and Drug Administration. Guidance for Industry, PAT A Framework for Innovative Pharmaceutical Development, Manufacturing and Quality Assurance. [Last updated on 2004 Sep 05]. Available from: https://www.fda.gov/downloads/drugs/guidancecomplianceregulatoryinformation/guidances/ucm070305.pdf .
- 6.Knop K, Kleinebudde P. PAT-tools for process control in pharmaceutical film coating applications. Int J Pharm. 2013;457:527–36. doi: 10.1016/j.ijpharm.2013.01.062. [DOI] [PubMed] [Google Scholar]
- 7.Krier F, Mantanus J, Sacré PY, Chavez PF, Thiry J, Pestieau A, et al. PAT tools for the control of co-extrusion implants manufacturing process. Int J Pharm. 2013;458:15–24. doi: 10.1016/j.ijpharm.2013.09.040. [DOI] [PubMed] [Google Scholar]
- 8.Jiang Y, David B, Tu P, Barbin Y. Recent analytical approaches in quality control of traditional Chinese medicines – A review. Anal Chim Acta. 2010;657:9–18. doi: 10.1016/j.aca.2009.10.024. [DOI] [PubMed] [Google Scholar]
- 9.Xue J, Wu C, Wang L, Jiang S, Huang G, Zhang J, et al. Dynamic prediction models for alkaloid content using NIR technology for the study and online analysis of parching in areca seed. Food Chem. 2011;126:725–30. [Google Scholar]
- 10.De Beer T, Burggraeve A, Fonteyne M, Saerens L, Remon JP, Vervaet C. Near infrared and Raman spectroscopy for the in-process monitoring of pharmaceutical production processes. Int J Pharm. 2011;417:32–47. doi: 10.1016/j.ijpharm.2010.12.012. [DOI] [PubMed] [Google Scholar]
- 11.Märk J, Andre M, Karner M, Huck CW. Prospects for multivariate classification of a pharmaceutical intermediate with near-infrared spectroscopy as a process analytical technology (PAT) production control supplement. Eur J Pharm Biopharm. 2010;76:320–7. doi: 10.1016/j.ejpb.2010.06.015. [DOI] [PubMed] [Google Scholar]
- 12.Wu YW, Sun SQ, Zhou Q, Leung HW. Fourier transform mid-infrared (MIR) and near-infrared (NIR) spectroscopy for rapid quality assessment of Chinese medicine preparation honghua oil. J Pharm Biomed. 2008;46:498–504. doi: 10.1016/j.jpba.2007.11.021. [DOI] [PubMed] [Google Scholar]
- 13.Li W, Cheng Z, Wang Y, Qu H. Quality control of Lonicerae japonicae flos using near infrared spectroscopy and chemometrics. J Pharm Biomed Anal. 2013;72:33–9. doi: 10.1016/j.jpba.2012.09.012. [DOI] [PubMed] [Google Scholar]
- 14.Li WL, Han HF, Zhang L, Zhang Y, Qu HB. Manufacturer identification and storage time determination of “Dong’e Ejiao” using near infrared spectroscopy and chemometrics. J Zhejiang Univ Sci B. 2016;17:382–90. doi: 10.1631/jzus.B1500186. [DOI] [PMC free article] [PubMed] [Google Scholar]
- 15.Andersson M, Folestad S, Gottfries J, Johansson MO, Josefson M, Wahlund KG. Quantitative analysis of film coating in a fluidized bed process by in-line NIR spectrometry and multivariate batch calibration. Anal Chem. 2000;72:2099–108. doi: 10.1021/ac990256r. [DOI] [PubMed] [Google Scholar]
- 16.Li T, He X. Quantitative analysis of salidroside and p-tyrosol in the traditional tibetan medicine Rhodiola crenulata by fourier transform near-infrared spectroscopy. Chem Pharm Bull (Tokyo) 2016;64:289–96. doi: 10.1248/cpb.c15-00558. [DOI] [PubMed] [Google Scholar]
- 17.Li Y, Liu B, Geng S, Kim S, Jin Y, Liu X, et al. An approach combining real-time release testing with near-infrared spectroscopy to improve quality control efficiency of rhizoma paridis. Spectrochim Acta A Mol Biomol Spectrosc. 2016;157:186–91. doi: 10.1016/j.saa.2016.01.001. [DOI] [PubMed] [Google Scholar]
- 18.Li W, Han H, Cheng Z, Zhang Y, Liu S, Qu H. A feasibility research on the monitoring of traditional Chinese medicine production process using NIR-based multivariate process trajectories. Sens Actuators B Chem. 2016;231:313–23. [Google Scholar]
- 19.Peng W, Liu YJ, Zhao CB, Wu CJ. In silico assessment of drug-like properties of alkaloids from Areca catechu L Nut. Trop J Pharm Res. 2015;14:635–9. [Google Scholar]
- 20.Hanai H, Kanauchi O, Mitsuyama K, Andoh A, Takeuchi K, Takayuki I, et al. Germinated barley foodstuff prolongs remission in patients with ulcerative colitis. Int J Mol Med. 2004;13:643–7. [PubMed] [Google Scholar]
- 21.Cheng S, Qiu F, Huang J, He J. Simultaneous determination of vitexin-2”-O-glucoside, vitexin-2”-O-rhamnoside, rutin, and hyperoside in the extract of hawthorn (Crataegus pinnatifida Bge.) leaves by RP-HPLC with ultraviolet photodiode array detection. J Sep Sci. 2007;30:717–21. doi: 10.1002/jssc.200600353. [DOI] [PubMed] [Google Scholar]
- 22.Martins SI, Jongen WM, Boekel MA. A review of Maillard reaction in food and implications to kinetic modelling. Trends Food Sci Technol. 2000;11:364–73. [Google Scholar]
- 23.Liu SC, Yang DJ, Jin SY, Hsu CH, Chen SL. Kinetics of color development, pH decreasing, and anti-oxidative activity reduction of Maillard reaction in galactose/glycine model systems. Food Chem. 2008;108:533–41. doi: 10.1016/j.foodchem.2007.11.006. [DOI] [PubMed] [Google Scholar]
- 24.Ameur LA, Rega B, Giampaoli P, Trystram G, Birlouez-Aragon I. The fate of furfurals and other volatile markers during the baking process of a model cookie. Food Chem. 2008;111:758–63. [Google Scholar]


