Abstract
Heparan sulfate (HS) is a linear polysaccharide found in the extracellular matrix (ECM) and on the cell membrane. It plays numerous roles in cellular events, including cell growth, migration and differentiation through binding to various growth factors, cytokines and other ECM proteins. Heparanase (HPSE) is an endoglycosidase that cleaves HS in the ECM and cell membrane. By degrading HS, HPSE not only alters the integrity of the ECM but also releases growth factors and angiogenic factors bound to HS chains, therefore, changes various cellular activities, including cell mobility that is critical for cancer metastasis. Accordingly, HPSE is an ideal drug target for cancer therapeutics. Here, we describe a method for non-reducing end labeling of HS via click chemistry (CC), and further use it in a novel HPSE assay. HS chains on a recombinant human syndecan-4 are first labeled at their non-reducing ends with GlcNAz using dimeric HS polymerase EXT1/EXT2. The labeled sample is then biotinylated through CC, immobilized on a multi-well plate and detected with ELISA. HPSE digestion of the biotinylated sample removes the label and, therefore, reduces the signal in ELISA assay. Non-reducing end labeling avoids the interference in an HPSE reaction caused by any internal labeling of HS. The assay is very sensitive with only 2.5 ng of labeled syndecan-4 needed in each reaction. The assay is also highly reproducible with a Z’ > 0.6. Overall, this new method is suitable for high-throughput drug screening on HPSE.
Keywords: carbohydrate ELISA, click chemistry, heparan sulfate, heparin, HPSE
Introduction
Heparan sulfate (HS) glycosaminoglycans are unbranched polysaccharides found in intracellular granules, on cell surfaces and in extracellular matrices (ECMs) and are covalently linked to proteoglycan core proteins (Esko and Lindahl 2001). HS chains are composed of disaccharide repeating units of uronic acid and N-acetyl-glucosamine residues that are synthesized by the EXT family of dual glycosyltransferases, enzymes that have both glucuronyltransferase and N-acetylglucosaminyltransferase activities (Busse and Kusche-Gullberg 2003; Breton et al. 2006). HS chains also contain sulfation domains that are sulfated in certain positions by various sulfotransferases (Xu and Esko 2014). HS sequesters growth factors, chemokines and morphogens via its sulfation domains, creating a low-affinity storage depot that can modulate extracellular growth factor movement and distribution (Bernfield et al. 1999; Dowd et al. 1999). In addition, interactions with HS fragments modulate the activities of various growth factors and enzymes (Bernfield et al. 1999).
Most HS chains are capped with a GlcA residue at their non-reducing ends (Wu and Lech 2005; Staples et al. 2010). Previously, it has been shown that the non-reducing ends of the HS chains on recombinant glypican-1 can be extended by EXT1/EXT2 heterodimer (EXT1/2) (Kim et al. 2003).
Syndecans are a family of HS proteoglycans that are found on cell membranes and in ECM. In particular, syndecan-4 is a selectively enriched and widespread focal adhesion component (Woods and Couchman 1994) and has three HS chains (Gopal et al. 2010).
HS is degraded by heparanase (HPSE), an endo-β-d-glucuronidase that specifically hydrolyzes HS at its sulfation domains (Goldshmidt et al. 2002; Zetser et al. 2004; Mao et al. 2014). Moreover, HPSE is released into ECM, where it contributes to the remodeling of HS-containing ECM and basement membranes (Nakajima et al. 1984; Hulett et al. 1999; Vlodavsky et al. 1999). As ECM provides physical barriers between cells and tissues, HPSE digestion on HS facilitates cell invasion and cancer metastasis (Nakajima et al. 1983; Vlodavsky and Friedmann 2001; Vlodavsky et al. 2008). In addition, the degradation of HS chains by HPSE at sulfation domains releases HS-bound angiogenic growth factors, such as FGF-2 and VEGF, therefore promotes an angiogenic response (Nadir et al. 2008; Ramani et al. 2013). Due to the likely contribution of HPSE activity to metastasis, inhibitors of HPSE are of particular interest in anti-cancer therapies (Pala et al. 2016).
For the purpose drug discovery, various methods have been designed for HPSE assay. For examples, radioisotope assay (Freeman and Parish 1997; Tsuchida et al. 2004; Ethen et al. 2011), colorimetric assay (Ahn et al. 2006; Hammond et al. 2010), fluorescent assay (Schoenfeld et al. 2014) and enzyme-linked immunosorbent assay (ELISA) (Behzad and Brenchley 2003) have been reported for HPSE assay. However, these methods either lack sensitivity or are not high-throughput compatible, making drug discovery on HPSE still a big challenge.
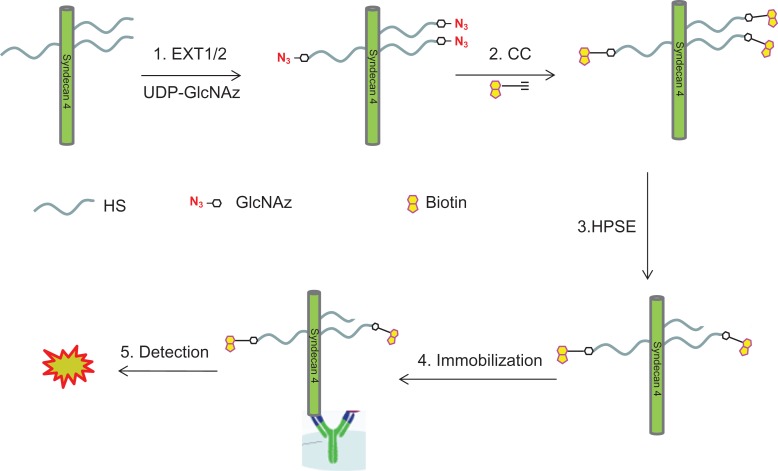
Here, we describe a method for non-reducing end labeling of HS and further use it in an HPSE assay. In brief, the HS chains on a recombinant syndecan-4 (rhSynd4) is first labeled with GlcNAz, a clickable analog of GlcNAc, using EXT enzymes and then conjugated to a biotin molecule. The biotinylated rhSynd4 is then used as a substrate for HPSE digestion and the remaining biotinylation on rhSynd4 is detected with ELISA on an anti-syndecan-4 coated plate (Figure 1).
Fig. 1.
Scheme for using HS non-reducing end-labeled proteoglycan for HPSE assay. There are four steps involved. 1. Non-reducing end labeling of HS chains on rhSynd4 with GlcNAz using EXT1/2 heterodimer. 2. Biotinylation through CC reaction. 3. Digestion of the labeled proteoglycan with HPSE. 4. Immobilization of the digest to an antibody-coated plate. 5. Detection of the biotin through streptavidin-HRP. This figure is available in black and white in print and in color at Glycobiology online.
Results
Non-reducing end labeling of HS on rhSynd4 for blotting assay
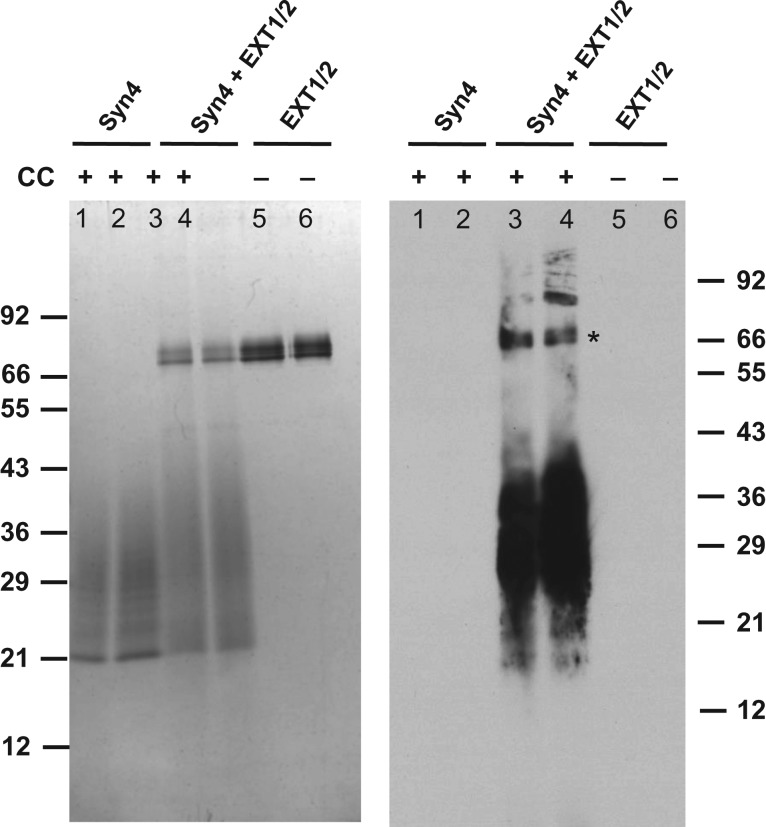
Previously, the presence of HS on recombinant rhSynd4 was demonstrated using a radioisotope HPSE assay (Ethen et al. 2011), where 35S was incorporated to rhSynd4 using an HS-specific sulfotransferase (Supplementary data, Figure 1). The presence of HS on rhSynd4 was also confirmed with mass spectrometry analysis (Mao et al. 2014). Since HS chains on recombinant glypican-1 can be extended by EXT1/EXT2 heterodimer (EXT1/2) (Kim et al. 2003), it might be possible to add GlcNAz residues to the non-reducing ends of HS chains on rhSynd4 as well. As such, a sample of rhSynd4 was then incubated with recombinant EXT1/2 in the presence of UDP-GlcNAz and UDP-GlcA, and biotinylated via click chemistry (CC) (Kolb et al. 2001). The biotinylated sample was then separated on SDS-PAGE, blotted to a membrane and visualized with streptavidin-HRP as described previously (Wu et al. 2015b). Indeed, biotinylation was detected in the labeled rhSynd4 (Figure 2). The biotinylation was then quantitated by the HABA assay (Green 1965), and it was found that there were 7.7 ± 0.5 biotin molecules on each labeled rhSynd4 molecule. Since syndecan-4 has three HS chains (Gopal et al. 2010), there must be more than two GlcNAz residues incorporated into each HS chain in average.
Fig. 2.
Labeling rhSynd4 with GlcNAz using EXT1/EXT2. rhSynd4 was first labeled at the non-reducing ends of its HS chains with UDP-GlcNAz and UDP-GlcA by EXT1/2 followed by biotinylation through CC. Left panel: 250 ng of unlabeled (lanes 1 and 2) and labeled (lanes 3 and 4) rhSynd4 and 60 ng of EXT1/2 (lanes 5 and 6) were separated in SDS-PAGE and visualized by silver staining. Right panel, a duplicate was blotted into a nitrocellulose membrane, and probed with streptavidin-HRP. *Non-specific labeling on EXT1/2.
Non-reducing end labeling of HS on rhSynd4 for ELISA
The non-reducing ends of HS chains from various samples are found to be terminated with an unsulfated glucuronic acid residue (Shi and Zaia 2009; Staples et al. 2010; Wu and Lech 2005). If this is true to the HS chains on rhSynd4, we might be able to add a single GlcNAz residue to these HS chains, which will result in much more uniformed labeling. To this end, rhSynd4 was incubated with EXT1/2 in the presence of only UDP-GlcNAz and further conjugated to biotin via CC. When the biotinylation of the sample was quantitated by the HABA assay, 2.8 ± 0.5 biotin molecules were found on each rhSynd4 molecule, which is consistent to the notion that there are three HS chains per syndecan-4 molecule.
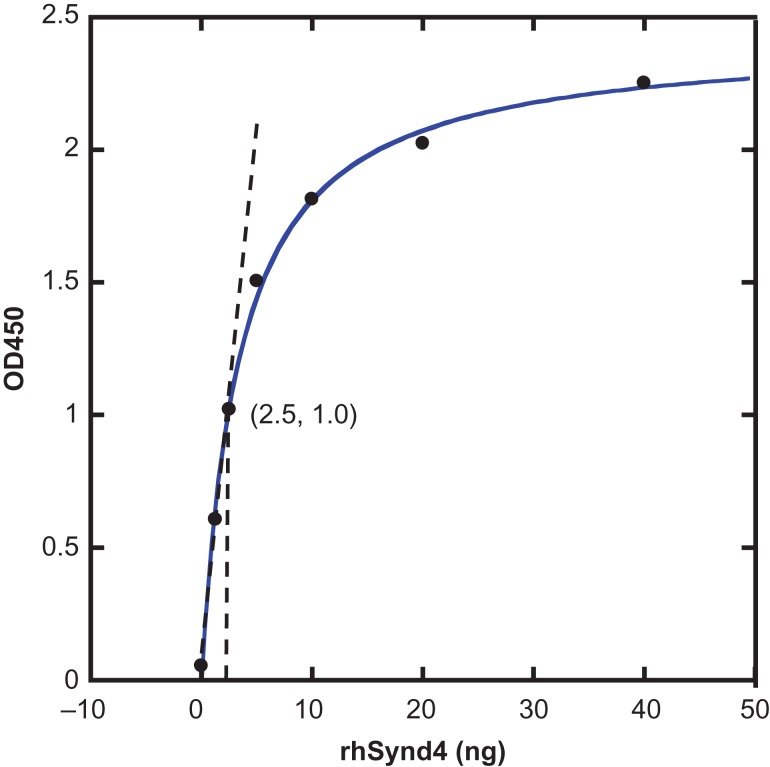
This labeled rhSynd4 was then tested in an ELISA assay. To do that, it was first immobilized to an anti-syndecan-4-coated 96-well plate, and then detected with streptavidin-HRP. The absorbance at 450 nm was read in a plate reader following the protocol of the Syndecan-4 DuoSet kit. When the absorbance was plotted versus the amount of the labeled rhSynd4 (Figure 3), a binding curve was obtained with a good linear response region observed under 2.5 ng of rhSynd4.
Fig. 3.
Labeled rhSynd4 detected by ELISA. Increasing labeled rhSynd4 was immobilized to a 96-well plate coated with 80 ng/well of goat anti-human syndecan-4 capture antibody (DuoSet ELISA kit of Human Syndecan-4, Catalog DY2918) and then detected according to the ELISA procedure of the kit. The OD450 was plotted versus the amount of rhSynd4. Linear relationship was observed below 2.5 ng of rhSynd4. This figure is available in black and white in print and in color at Glycobiology online.
HPSE assay with the labeled rhSynd4
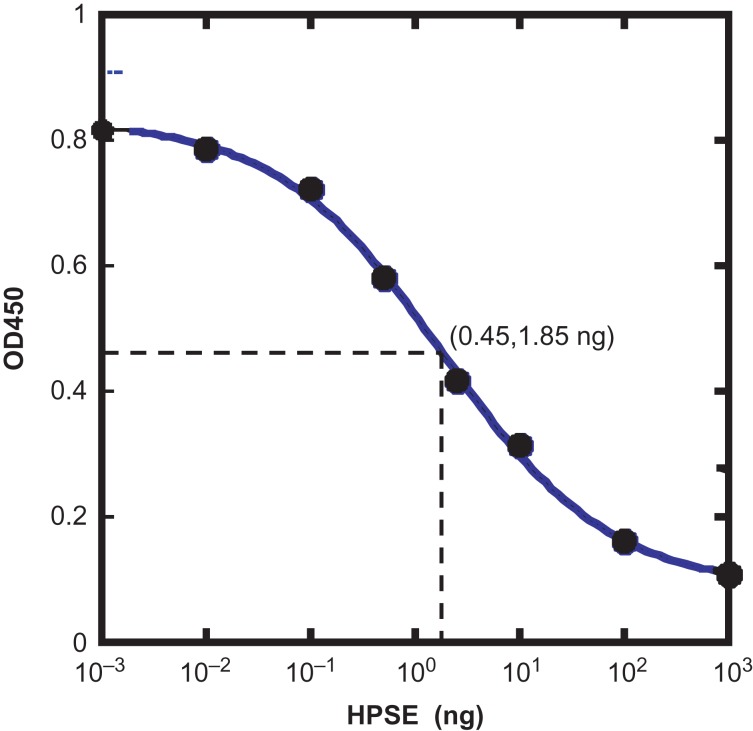
Since HPSE is an HS-specific endoglycosidase, its action will release the labeled non-reducing ends of HS chains and decrease the signals in the above ELISA assay. Based on this assumption, single GlcNAz-labeled rhSynd4 was then used as a substrate for HPSE assay. In this experiment, 2.5 ng of the labeled rhSynd4 was first digested with an increasing amount of HPSE at 37°C for 20 min, and the undigested rhSynd4 was then detected with ELISA. When the absorbance was plotted versus the amount of HPSE, an enzyme dose curve was obtained (Figure 4). From the graph, it is noticed that 0.01 ng of HPSE downshifted the OD450 slightly. It is also noticed that 10 ng and 100 ng HPSE digested most of the substrate with 1.85 ng of HPSE at the flexion point of the curve.
Fig. 4.
HPSE dose curve on the labeled rhSynd4. Labeled rhSynd4 (5 ng) was first digested with variable amount of HPSE in 20 µL acetate buffer at pH 4.0 for 20 min and then diluted with 180 μL of 1% BSA in PBS and immobilized to a goat anti-human syndecan-4-coated 96-well plate in duplicate (100 μL/well) and detected with ELISA. The average OD450 was then plotted versus HPSE. The 50% cleavage point was determined to be at 1.85 ng of HPSE. This figure is available in black and white in print and in color at Glycobiology online.
HPSE enzyme kinetic study on the labeled rhSynd4
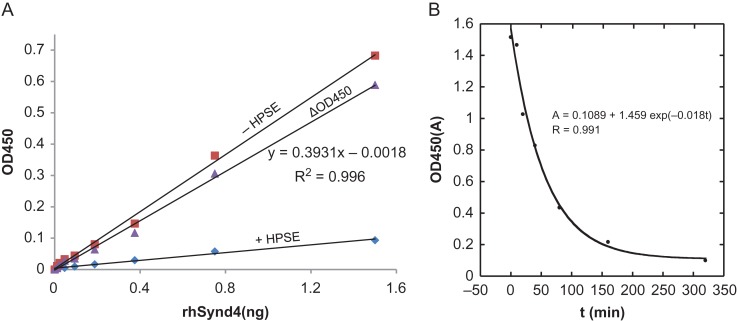
To understand the kinetic mechanism of HPSE, a substrate dose curve was first performed with limiting concentration of the substrate rhSynd4. According to Michaelis–Menten reaction, enzyme reaction velocity is only linear to substrate concentration when substrate is limiting (Supplementary data, Figure 2). Indeed, a good linear relationship was observed between the ΔOD450 (difference of OD450 between the controls and HPSE digested samples) and the substrate when rhSynd4 was below 1.6 ng (Figure 5A), suggesting that HPSE digestion follows Michaelis–Menton reaction. This conclusion is further strengthened in a time course study, in which a reaction was followed for over 6 h. In this study, a master reaction was initiated and small aliquots were taken out at different time points to detect the remaining biotinylation, which clearly followed an exponential decay equation (Figure 5B). Michaelis–Menten reaction predicts that a substrate concentration follows an exponential decay equation when the substrate is limiting (Walsh et al. 2010).
Fig. 5.
Kinetic characterization of HPSE. (A) Substrate dose curve for HPSE digestion. Decreasing amount of rhSynd4 was digested with 100 ng of HPSE (+HPSE) at 37°C for 20 min and the remaining biotinylation was detected with ELISA (diamond). A control set of samples without HPSE digestion were otherwise treated the same way (square). The difference between the controls and the HPSE digested samples (ΔOD450) is due to the removal of labeled ends of HS chains by HPSE (triangle). ΔOD450 exhibits a good linear relationship (R2 = 0.996) with the amount of the substrate, which is a clear indication of Michaelis–Menten reaction when substrate is limiting. (B) Time course of HPSE digestion on labeled rhSynd4. Labeled rhSynd4 (50 ng) was digested with 10 ng HPSE and aliquots of 5 ng of rhSynd4 were taken out at different time points. The aliquots were detected for biotinylation by ELSA in duplicate. The average OD450 was plotted versus time. The data was then fit into the exponential decay equation, using KaleidaGraph. A good fit of the equation (R = 0.991) suggests a first-order reaction, which is implicated by Michaelis–Menten reaction when substrate is limiting. This figure is available in black and white in print and in color at Glycobiology online.
Z’ factor determination for the HPSE assay
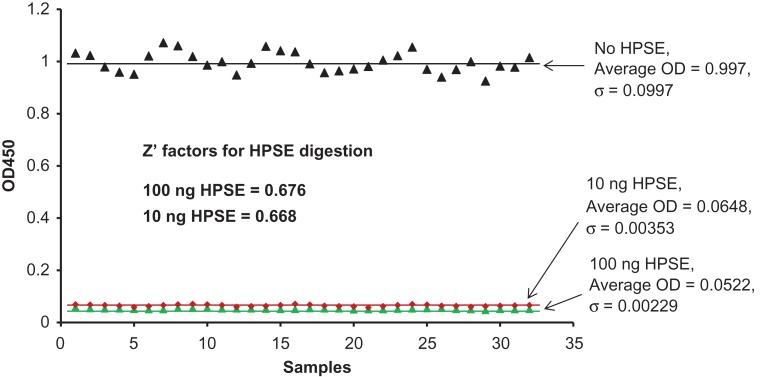
For enzyme inhibitor screening, consistency of an enzymatic assay, which is commonly evaluated by Z′ factor, is a critical parameter. Here, the Z′ factor was determined by comparing the ELISA signals of 10 ng or 100 ng HPSE treated samples to those of no HPSE treated samples. To achieve better separation between the signals for HPSE treated and non-treated samples, HPSE digestion on rhSynd4 proceeded for 2 h. Each digestion was repeated for 32 times, and the OD readouts were then plotted out (Figure 6). The Z′ factor was determined to be 0.668 or 0.676, for 10 ng or 100 ng of HPSE-treated samples, respectively. Since 100 ng HPSE did not have significant improvement on the Z′ factor under the reaction conditions, only 10 ng of HPSE was chosen for the following inhibition assays.
Fig. 6.
Determine Z’ factor for the HPSE assay. Labeled rhSynd4 (2.5 ng) was digested with either 10 ng or 100 ng of HPSE in 100 µL acetate buffer at pH 4.0 for 2 h and then immobilized to a goat anti-human syndecan-4-coated 96-well plate and detected with ELISA. Samples without HPSE digestion were also performed as controls. For statistic purpose, every reaction was repeated for 32 times. The Z’ factors were determined between the HPSE-digested samples and the controls. This figure is available in black and white in print and in color at Glycobiology online.
Inhibition assay for HPSE
To demonstrate its suitability for inhibitor screening, HPSE assay was performed in the presence of suramin, a known inhibitor for HPSE (Nakajima et al. 1991), as well as chondroitin sulfate and heparin that are structurally related to HS (Figure 7). The EC50 for suramin was determined to be 0.10 µM, which is significantly lower than the 46 µM reported previously (Nakajima et al. 1991). The reason for this difference is likely due to different assay conditions. While 2.5 ng of rhSynd4 was used in the current assay, 5 mg of HS was used by Nakajima et al. The EC50 for heparin and chondroitin sulfate was determined to be 0.20 µg/mL and 0.63 µg/mL, respectively, which correlates well with the factor that heparin is structurally more closely related to HS than chondroitin sulfate.
Fig. 7.
Determine the half maximal effective concentration (EC50) values for three HPSE inhibitors. Labeled rhSynd4 (2.5 ng) was digested with 10 ng of HPSE in 100 µL acetate buffer at pH 4.0 in the presence of different amounts of inhibitors at 37°C for 2 h. The samples were then immobilized to a goat anti-human syndecan-4-coated 96-well plate and detected with ELISA. Each data point was done in duplicate. The average OD450 was plotted vs. the concentration of the inhibitors and the EC50 was determined with a 4-parameter logistic non-linear regression equation, . (A) Inhibition curve of suramin. (B) Inhibition curve of heparin. (C) Inhibition curve of chondroitin sulfate.
Discussion
We have described a new method for non-reducing end labeling of HS, and subsequently applied this method in an HPSE assay. By using non-reducing end-labeled HS as a substrate, this assay avoids any interference on the enzymatic activity of HPSE seen previously with internal labeling strategy. This assay is highly sensitive, as it can detect as little as 0.01 ng of HPSE and uses 2.5 ng of the substrate rhSynd4 in each reaction. This assay is in the format of ELISA and therefore is high throughput compatible. A Z′ factor above 0.6 is also achieved, suggesting that the assay is suitable for drug screening (Zhang et al. 1999). This assay may also be used for detecting HPSE activity in biological samples, such as cell extracts or serum (Supplementaary data, Figure 3). The principle of this assay can be applied to other glycosaminoglycans and their respective endoglycosidases, such as keratan sulfate and its specific enzyme F. keratolyticus endo-β-galactosidase (Supplementary data, Figure 4). More importantly, this method represents a carbohydrate-based ELISA, which allows more quantitative measurement and detection of interested carbohydrates on biological samples.
By incorporating GlcNAz alone to HS by EXT1/2, we confirmed that the non-reducing ends of these HS chains on rhSynd4 contain GlcA residues at their non-reducing ends. A remaining question is how cells can selectively terminate HS synthesis on GlcA residues.
Another question is whether there are multiple HPSE sites on the HS chains of rhSynd4. Throughout this study, it is found that more than 90% of the labeled HS ends on rhSynd4 can be removed by HPSE (Figures 5, 6 and 7), suggesting that these HS chains contain at least one HPSE site. As we only detect the removal of the labeled ends of HS chains by HPSE digestion, it is impossible to tell whether there are multiple HPSE sites on each HS chain. On the other hand, from a disaccharide analysis by mass spectrometry, we know that the sulfation level of rhSynd4 is only half of that of HS from bovine kidney (Mao et al. 2014), suggesting that the frequency of HPSE sits on rhSynd4 may be half of that of the HS from bovine kidney as well.
Material and methods
Recombinant human EXT1/2 (an EXT1 and EXT2 heterodimer), rhSynd4, lumican, B3GNT2, UDP-GlcNAz (also known as UDP-azido-GlcNAc), Syndecan-4 DuoSet kit, suramin, biotinylated alkyne, streptavidin-HRP and 96-well clear plate were from R&D Systems/Bio-techne Minneapolis, MN. Biotin DIBO alkyne was from Life-Technology Grand Island, NY. Chondroitin sulfate, heparin, bovine serum albumin (BSA), ascorbic acid, CuCl2, 2-(4′-hydroxyazobenzene) benzoic acid (HABA) and dimethyl sulfoxide were from Sigma Aldrich St Louis, MO. ECL western blotting substrate and avidin were from ThermoFisher Scientific Grand Island, NY.
Non-reducing end labeling HS on rhSynd4
For blotting assay, rhSynd4 was labeled by mixing 5 µg of rhSynd4, 1 nmol of UDP-GlcNAz, 2 nmol of UDP-GlcA, 1 µg EXT1/2 in 25 µL of 25 mM Tris pH 7.5, 150 mM NaCl and 10 mM MnCl2 at 37°C for 1 h. The incorporated GlcNAz residue was further conjugated to biotin through CC reaction by addition of 5 nmol CuCl2, 100 nmol ascorbic acid, 2 nmol biotinylated alkyne to the above reaction in a final volume of 40 µL and further incubation at room temperature for 30 min. Half of the final reaction was subjected to SDS-PAGE according to a method previously described for blotting assay (Wu et al. 2015a). The other half of the final reaction was run separately and visualized by a silver staining method (Wray et al. 1981).
For ELISA assay, rhSynd4 was labeled by mixing 20 µg of rhSynd4, 5 nmol of UDP-GlcNAz, 4 µg EXT1/2 in 100 µL of 25 mM Tris pH 7.5, 150 mM NaCl, 10 mM Mn2+ at 37°C for 1 h. The incorporated GlcNAz residue was further conjugated to biotin through CC reaction by addition of 10 µL of 1 mM biotin DIBO alkyne in dimethyl sulfoxide to the above reaction and further incubation at room temperature overnight. Biotin DIBO alkyne was used here to avoid the toxicity of copper to HPSE assay.
For the following HABA assay, another set of biotinylated rhSynd4 samples were prepared and dialyzed into the buffer of 25 mM Tris at pH 7.5 using a dialysis membrane from Spectrumlabs.com with a molecular weight cutoff of 3.5 kDa. The dialysis lasted for 5–16 h with two times of buffer change.
Quantitative measurement of biotinylation of labeled rhSynd4 with HABA assay
The biotinylation of the above dialyzed samples were estimated using the HABA assay (Green 1965). HABA solution was prepared at 10 mM in 10 mM NaOH and then diluted to working concentration of 0.3 mM with phosphate-buffered saline (PBS) at pH 7.2. Avidin–HABA reagent was prepared by adding avidin to the 0.3 mM HABA solution to a final concentration of 0.5 mg/mL. To perform the HABA assay, the absorbance at 500 nm (OD) of 0.45 mL avidin–HABA reagent was measured before and after the addition of 0.050 mL labeled rhSynd4 (OD1 and OD2 respectively) in a 0.5 mL cuvette using a spectrophotometer. The number of biotin per labeled rhSynd4 was calculated as the following:
Note: Extinction coefficient of avidin–HABA, Ɛ, is 34,000 M−1cm−1, light path = 1 cm, dilution factor is 10, M1 is the biotin molar concentration, and M2 is the protein molar concentration. Molecular weight of rhSynd4 is 14.5 kDa.
ELISA detection of labeled rhSynd4
For ELISA assay, a 96-well plate was first coated with goat anti-human syndecan-4 according to the Syndecan-4 DuoSet kit (Catalog DY2918, R&D Systems). The plate was washed thoroughly in the buffer of 25 mM Tris (pH 7.6), 137 mM NaCl and 0.01% Tween (TBST) according to the manufacturer's instructions before each subsequent step. To detect the labeled rhSynd4, a sample was diluted with 1% BSA in PBS and 100 µL of the dilution was loaded into the coated plate per well. The plate was then incubated at room temperature for 2 h. Subsequent steps for detection follow the instruction of the kit and the plate was finally read in a SpectraMax M5 (Molecular Device) plate reader at 450 nm.
HPSE enzyme dose curve on rhSynd4
HPSE was diluted into a series of concentrations in 50 mM NaAc at pH 4.0. Ten microliter of diluted HPSE was mixed with 10 µL of the labeled rhSynd4 (5 ng) and incubated at 37°C for 20 min, followed by heat inactivation at 95°C and dilution with 180 μL of 1% BSA in PBS. To be consistent with literature (Toyoshima and Nakajima 1999), pH 4.0 was chosen for HPSE digestion. The remaining biotinylation of the samples was detected with ELISA in duplicate (load 100 μL of the final reaction/well).
Substrate dose curve and time course of HPSE digestion on rhSynd4
For a substrate dose curve, variable amount of labeled rhSynd4 was digested with 100 ng of HPSE in 20 μL of 50 mM NaAc at pH 4.0 for 20 min at 37°C and then heat inactivated and diluted with 180 μL of 1% BSA in PBS. The remaining biotinylation of the samples was detected by ELISA. For a time course study, 50 ng of labeled rhSynd4 was digested with 10 ng of HPSE in 200 μL buffer of 50 mM NaAc at pH 4.0 and aliquots corresponding to 5 ng of rhSynd4 were taken out at different time points and heat inactivated at 95°C. The biotinylation of the aliquots was then detected by ELISA. The OD450 was plotted versus time and fit into the exponential decay equation (Walsh et al. 2010) using KaleidaGraph.
Inhibition of HPSE digestion on labeled rhSynd4
For inhibition study, a variable amount of an inhibitor was first mixed with 10 ng HPSE in 10 µL, and then mixed with 2.5 ng of labeled Synd4 in a final volume of 20 µL in the buffer of 50 mM NaAc at pH 4.0. The mixture was then incubated at 37°C for 2 h followed by heat inactivation. The remaining biotinylation of the samples was detected with ELISA. The data were fit into 4-parameter logistic non-linear regression equation to obtain half maximal effective concentration (EC50).
Z’ factor determination
Z′ factor was determined based on the definition of Zhang et al. (1999) using the following equation:
where σc+ and σc−are standard deviations of positive and negative controls, respectively; µc+ and µc− are the means of the positive and negative controls, respectively. For each positive control, 2.5 ng of labeled rhSynd4 was digested with 10 ng or 100 ng of HPSE for 2 h at 37°C. For negative control, 2.5 ng of labeled rhSynd4 was not digested with HPSE. All samples were then detected for biotinylation by ELISA.
Supplementary Material
Acknowledgements
We would like to thank Robert Felix and Andrew Burton of Tocris, Bio-techne for suggestions on HPSE inhibitor assays. We would also like to thank many of our co-workers in Bio-techne who made contribution through enzyme product development.
Funding
This work was partially supported by the National Institutes of Health (grant P4 1GM 104603 to J.Z.).
Conflict of interest statement
None declared.
Abbreviation
EC50, half maximal effective concentration; ELISA, Enzyme-linked immunosorbent assay; EXT, exostoses; HABA, 2-(4′-hydroxyazobenzene) benzoic acid; HRP, horse radish peroxidase; HPSE, heparanase; HS, heparan sulfate; PBS, phosphate-buffered saline
References
- Ahn SC, Kim BY, Oh WK, Park YM, Kim HM, Ahn JS. 2006. Colorimetric heparinase assay for alternative anti-metastatic activity. Life Sci. 79:1661–1665. [DOI] [PubMed] [Google Scholar]
- Behzad F, Brenchley PE. 2003. A multiwell format assay for heparanase. Anal. Biochem. 320:207–213. [DOI] [PubMed] [Google Scholar]
- Bernfield M, Gotte M, Park PW, Reizes O, Fitzgerald ML, Lincecum J, Zako M. 1999. Functions of cell surface heparan sulfate proteoglycans. Annu. Rev. Biochem. 68:729–777. [DOI] [PubMed] [Google Scholar]
- Breton C, Snajdrova L, Jeanneau C, Koca J, Imberty A. 2006. Structures and mechanisms of glycosyltransferases. Glycobiology. 16:29R–37R. [DOI] [PubMed] [Google Scholar]
- Busse M, Kusche-Gullberg M. 2003. In vitro polymerization of heparan sulfate backbone by the EXT proteins. J. Biol. Chem. 278:41333–41337. [DOI] [PubMed] [Google Scholar]
- Dowd CJ, Cooney CL, Nugent MA. 1999. Heparan sulfate mediates bFGF transport through basement membrane by diffusion with rapid reversible binding. J. Biol. Chem. 274:5236–5244. [DOI] [PubMed] [Google Scholar]
- Esko JD, Lindahl U. 2001. Molecular diversity of heparan sulfate. J. Clin. Invest. 108:169–173. [DOI] [PMC free article] [PubMed] [Google Scholar]
- Ethen CM, Machacek M, Prather B, Wu ZL. 2011. GAG-specific endoglycosidase assay using S-35-labeled proteoglycans. Glycobiology. 21:1489. [Google Scholar]
- Freeman C, Parish CR. 1997. A rapid quantitative assay for the detection of mammalian heparanase activity. Biochem. J. 325(Pt 1):229–237. [DOI] [PMC free article] [PubMed] [Google Scholar]
- Goldshmidt O, Nadav L, Aingorn H, Irit C, Feinstein N, Ilan N, Zamir E, Geiger B, Vlodavsky I, Katz BZ. 2002. Human heparanase is localized within lysosomes in a stable form. Exp. Cell Res. 281:50–62. [DOI] [PubMed] [Google Scholar]
- Gopal S, Bober A, Whiteford JR, Multhaupt HA, Yoneda A, Couchman JR. 2010. Heparan sulfate chain valency controls syndecan-4 function in cell adhesion. J. Biol. Chem. 285:14247–14258. [DOI] [PMC free article] [PubMed] [Google Scholar]
- Green NM. 1965. A spectrophotometric assay for avidin and biotin based on binding of dyes by avidin. Biochem. J. 94:23C–24C. [DOI] [PubMed] [Google Scholar]
- Hammond E, Li CP, Ferro V. 2010. Development of a colorimetric assay for heparanase activity suitable for kinetic analysis and inhibitor screening. Anal. Biochem. 396:112–116. [DOI] [PubMed] [Google Scholar]
- Hulett MD, Freeman C, Hamdorf BJ, Baker RT, Harris MJ, Parish CR. 1999. Cloning of mammalian heparanase, an important enzyme in tumor invasion and metastasis. Nat. Med. 5:803–809. [DOI] [PubMed] [Google Scholar]
- Kim BT, Kitagawa H, Tanaka J, Tamura J, Sugahara K. 2003. In vitro heparan sulfate polymerization: crucial roles of core protein moieties of primer substrates in addition to the EXT1–EXT2 interaction. J. Biol. Chem. 278:41618–41623. [DOI] [PubMed] [Google Scholar]
- Kolb HC, Finn MG, Sharpless KB. 2001. Click chemistry: Diverse chemical function from a few good reactions. Angew. Chem. Int. Ed. Engl. 40:2004–2021. [DOI] [PubMed] [Google Scholar]
- Mao Y, Huang Y, Buczek-Thomas JA, Ethen CM, Nugent MA, Wu ZL, Zaia J. 2014. A liquid chromatography-mass spectrometry-based approach to characterize the substrate specificity of mammalian heparanase. J. Biol. Chem. 289:34141–34151. [DOI] [PMC free article] [PubMed] [Google Scholar]
- Nadir Y, Vlodavsky I, Brenner B. 2008. Heparanase, tissue factor, and cancer. Semin Thromb. Hemost. 34:187–194. [DOI] [PubMed] [Google Scholar]
- Nakajima M, DeChavigny A, Johnson CE, Hamada J, Stein CA, Nicolson GL. 1991. Suramin. A potent inhibitor of melanoma heparanase and invasion. J. Biol. Chem. 266:9661–9666. [PubMed] [Google Scholar]
- Nakajima M, Irimura T, Di Ferrante D, Di Ferrante N, Nicolson GL. 1983. Heparan sulfate degradation: relation to tumor invasive and metastatic properties of mouse B16 melanoma sublines. Science. 220:611–613. [DOI] [PubMed] [Google Scholar]
- Nakajima M, Irimura T, Di Ferrante N, Nicolson GL. 1984. Metastatic melanoma cell heparanase. Characterization of heparan sulfate degradation fragments produced by B16 melanoma endoglucuronidase. J. Biol. Chem. 259:2283–2290. [PubMed] [Google Scholar]
- Pala D, Rivara S, Mor M, Milazzo FM, Roscilli G, Pavoni E, Giannini G. 2016. Kinetic analysis and molecular modeling of the inhibition mechanism of roneparstat (SST0001) on human heparanase. Glycobiology. 26:640–654. [DOI] [PMC free article] [PubMed] [Google Scholar]
- Ramani VC, Purushothaman A, Stewart MD, Thompson CA, Vlodavsky I, Au JL, Sanderson RD. 2013. The heparanase/syndecan-1 axis in cancer: Mechanisms and therapies. FEBS J. 280:2294–2306. [DOI] [PMC free article] [PubMed] [Google Scholar]
- Schoenfeld AK, Vierfuss S, Luhn S, Alban S. 2014. Testing of potential glycan-based heparanase inhibitors in a fluorescence activity assay using either bacterial heparinase II or human heparanase. J. Pharm. Biomed. Anal. 95:130–138. [DOI] [PubMed] [Google Scholar]
- Shi X, Zaia J. 2009. Organ-specific heparan sulfate structural phenotypes. J. Biol. Chem. 284:11806–11814. [DOI] [PMC free article] [PubMed] [Google Scholar]
- Staples GO, Shi X, Zaia J. 2010. Extended N-sulfated domains reside at the nonreducing end of heparan sulfate chains. J. Biol. Chem. 285:18336–18343. [DOI] [PMC free article] [PubMed] [Google Scholar]
- Toyoshima M, Nakajima M. 1999. Human heparanase. Purification, characterization, cloning, and expression. J. Biol. Chem. 274:24153–24160. [DOI] [PubMed] [Google Scholar]
- Tsuchida S, Podyma-Inoue KA, Yanagishita M. 2004. Ultrafiltration-based assay for heparanase activity. Anal. Biochem. 331:147–152. [DOI] [PubMed] [Google Scholar]
- Vlodavsky I, Elkin M, Abboud-Jarrous G, Levi-Adam F, Fuks L, Shafat I, Ilan N. 2008. Heparanase: One molecule with multiple functions in cancer progression. Connect. Tissue Res. 49:207–210. [DOI] [PubMed] [Google Scholar]
- Vlodavsky I, Friedmann Y. 2001. Molecular properties and involvement of heparanase in cancer metastasis and angiogenesis. J. Clin. Invest. 108:341–347. [DOI] [PMC free article] [PubMed] [Google Scholar]
- Vlodavsky I, Friedmann Y, Elkin M, Aingorn H, Atzmon R, Ishai-Michaeli R, Bitan M, Pappo O, Peretz T, Michal I et al. 1999. Mammalian heparanase: Gene cloning, expression and function in tumor progression and metastasis. Nat. Med. 5:793–802. [DOI] [PubMed] [Google Scholar]
- Walsh R, Martin E, Darvesh S. 2010. A method to describe enzyme-catalyzed reactions by combining steady state and time course enzyme kinetic parameters. Biochim. Biophys. Acta. 1800:1–5. [DOI] [PubMed] [Google Scholar]
- Woods A, Couchman JR. 1994. Syndecan 4 heparan sulfate proteoglycan is a selectively enriched and widespread focal adhesion component. Mol. Biol. Cell. 5:183–192. [DOI] [PMC free article] [PubMed] [Google Scholar]
- Wray W, Boulikas T, Wray VP, Hancock R. 1981. Silver staining of proteins in polyacrylamide gels. Anal. Biochem. 118:197–203. [DOI] [PubMed] [Google Scholar]
- Wu ZL, Huang X, Burton AJ, Swift KA. 2015. a. Glycoprotein labeling with click chemistry (GLCC) and carbohydrate detection. Carbohydr. Res. 412:1–6. [DOI] [PubMed] [Google Scholar]
- Wu ZL, Huang X, Burton AJ, Swift KA. 2015. b. Probing sialoglycans on fetal bovine fetuin with azido-sugars using glycosyltransferases. Glycobiology. 26:329–334. [DOI] [PubMed] [Google Scholar]
- Wu ZL, Lech M. 2005. Characterizing the non-reducing end structure of heparan sulfate. J. Biol. Chem 280:33749–33755. [DOI] [PubMed] [Google Scholar]
- Xu D, Esko JD. 2014. Demystifying heparan sulfate–protein interactions. Annu. Rev. Biochem. 83:129–157. [DOI] [PMC free article] [PubMed] [Google Scholar]
- Zetser A, Levy-Adam F, Kaplan V, Gingis-Velitski S, Bashenko Y, Schubert S, Flugelman MY, Vlodavsky I, Ilan N. 2004. Processing and activation of latent heparanase occurs in lysosomes. J. Cell Sci. 117:2249–2258. [DOI] [PubMed] [Google Scholar]
- Zhang JH, Chung TD, Oldenburg KR. 1999. A simple statistical parameter for use in evaluation and validation of high throughput screening assays. J. Biomol. Screen. 4:67–73. [DOI] [PubMed] [Google Scholar]
Associated Data
This section collects any data citations, data availability statements, or supplementary materials included in this article.


