Abstract
Reliable real-time low-latency spike sorting with large data throughput is essential for studies of neural network dynamics and for brain-machine interfaces (BMIs), in which the stimulation of neural networks is based on the networks' most recent activity. However, the majority of existing multi-electrode spike-sorting algorithms are unsuited for processing high quantities of simultaneously recorded data. Recording from large neuronal networks using large high-density electrode sets (thousands of electrodes) imposes high demands on the data-processing hardware regarding computational complexity and data transmission bandwidth; this, in turn, entails demanding requirements in terms of chip area, memory resources and processing latency.
This paper presents computational complexity optimization techniques, which facilitate the use of spike-sorting algorithms in large multi-electrode-based recording systems. The techniques are then applied to a previously published algorithm, on its own, unsuited for large electrode set recordings. Further, a real-time low-latency high-performance VLSI hardware architecture of the modified algorithm is presented, featuring a folded structure capable of processing the activity of hundreds of neurons simultaneously. The hardware is reconfigurable “on-the-fly” and adaptable to the nonstationarities of neuronal recordings. By transmitting exclusively spike time stamps and/or spike waveforms, its real-time processing offers the possibility of data bandwidth and data storage reduction.
Index Terms: FPGA, high throughput, low latency, multi-electrode, real-time, spike sorting
I. Introduction
Signals in neuronal networks propagate as short fluctuations of the cell membrane potential—action potentials, which can be recorded extracellularly in the form of voltage spikes. The extraction of single-neuron activity from the recordings (“spike sorting”) consists of a number of nontrivial and error-prone processing steps, including spike detection, spike alignment, feature extraction and clustering [1].
It has been shown that recording the electrical activity of a single neuron on multiple electrodes strongly increases spike-sorting performance [2]. In recent years, the advances in CMOS technology have led to the development of high-density multi-electrode arrays (HDMEAs) consisting of thousands of electrodes [3]–[6]. Applications of devices capable of recording single neuron activity on multiple electrodes range from in vivo studies of brain structure and clinical treatments to in vitro investigations of neural network dynamics, [7]–[9].
High-density multi-electrode (HDME) neuronal recording systems typically consist of recording electrodes and a host machine (e.g., PC) used for signal processing and data storage. The amount of data in large HDME recording systems renders data-processing units highly complex, imposes stringent demands on data transmission bandwidth between the recording electrodes and the host, and introduces a high demand on the data storage resources on the host side. Moreover, processing the data on the host side, due to the data-handling complexity, leads to high latencies that are unsuitable for, e.g., closed-loop experiments. For such experiments, the stimulation of individual cells is based on the recorded activity of a neural network and needs to be performed within just a few milliseconds following detected activity in the network [10].
Spike sorting performed in real time, on a dedicated hardware device located in the proximity of the recording electrodes, enables the transmission of only the relevant information—spike times and/or spike waveforms to the host, which reduces data-transmission bandwidth and storage requirements on the host. It also leads to a reduction in data-handling complexity, which, in turn, shortens the data-processing execution latency.
A comparative theoretical study of commonly used processing steps in spike sorting, from the real-time hardware implementation perspective, is given in [11]. Most of the presently available devices that feature real-time performance are based on simple decision rules of different threshold crossings [12], [13], which provide a low-complexity and low-latency implementation, but cannot, however, guarantee a high spike-sorting performance. One of the spike-sorting methods, commonly used as a benchmark method, principal component analysis (PCA), has been optimized for real-time implementation in the devices presented in [14]–[16]. However, all of these methods target single-electrode-based devices (i.e., devices in which single neurons are sensed by single electrodes). Only a few spike-sorting methods have been developed to specifically target the HDME type of recording [18]–[22]. This is in part due to the fact that HDME recording is a relatively novel method for neuronal recording and in part due to the challenges to perform spike sorting for this type of recording, as discussed in [17]. None of the above methods has been evaluated with respect to a real-time, low-latency hardware implementation. Furthermore, the existing algorithms developed for recording devices that feature small electrode sets (e.g., tetrodes) are not suitable for dealing with large data throughputs.
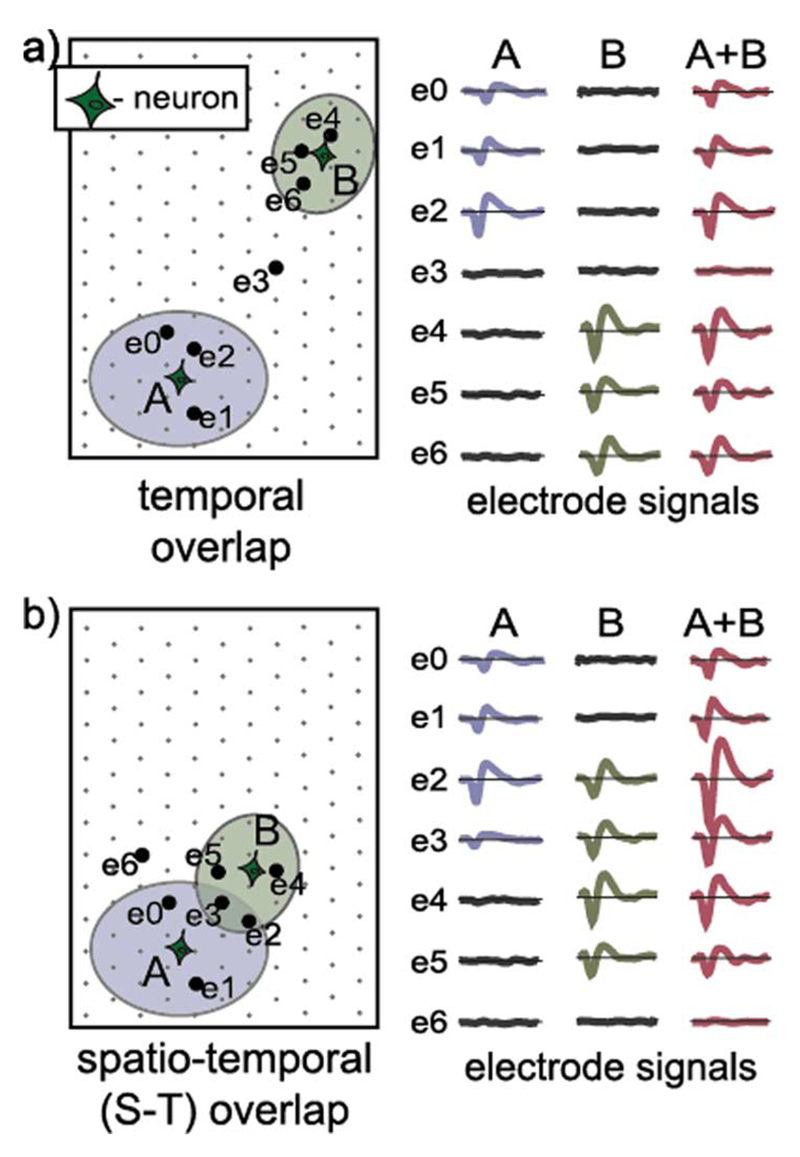
HDMEA devices face the challenge of correctly processing independent simultaneous spiking activities of multiple neurons (“spike overlaps”). If the simultaneous activity occurs in multiple neurons that are distant enough not to be sensed by the same electrodes, as illustrated in Fig. 1(a), we refer to this type of overlap as a “temporal overlap”. In [20], a straightforward segmentation of the electrode array is performed to deal with this type of overlap, whereas [21] shows the benefits of using ICA for this purpose. If neurons are close to each other, the individual groups of electrodes sensing their activities spatially overlap [Fig. 1(b)], hence, we refer to this type of overlap as “spatio-temporal (S-T) overlap” [19], [28].
Fig. 1.
Illustration of (a) temporal and (b) spatio-temporal (S-T) spike overlaps. Electrodes able to record spikes from individual neurons are encompassed by ellipsoids. Electrode signals recorded during the individual spiking of neurons A and B are depicted on the right. Electrode signals resulting from simultaneous spiking of two neurons (A + B) represent the sum of the signals recorded during the independent spiking of the neurons. Waveforms used in the plots are simulated spike waveforms, without noise.
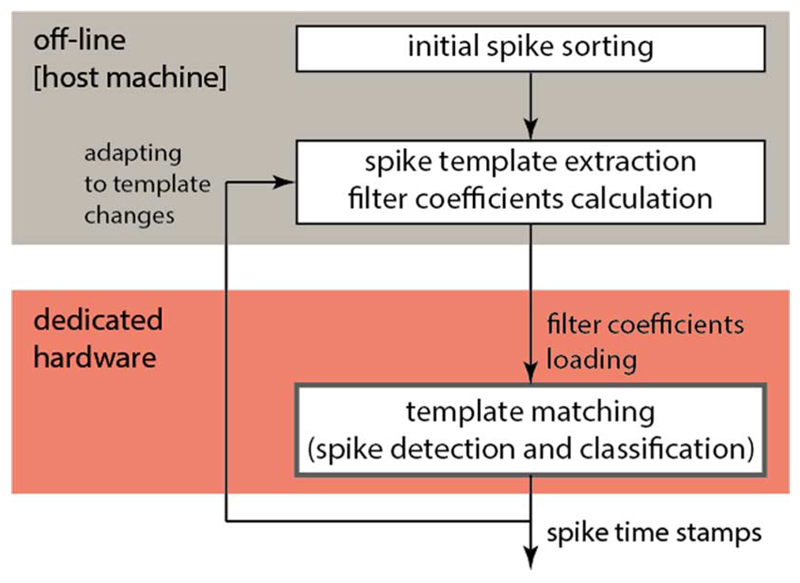
In this paper we introduce “divide-and-conquer”-inspired optimization techniques for spike-sorting algorithms that target HDME recordings. Further, we apply the techniques on a template-matching algorithm, previously published in [23] and [24]. Spike templates are prototypical spike waveforms that are calculated by averaging all spike waveforms belonging to a certain neuron found by an initial spike sorting. Template-matching has the advantage that it can be applied to novel data, which were not yet sorted, more efficiently than a clustering-based spike sorting. The initial spike sorting is performed in a pre-processing step, off-line, on a host machine, where spike templates and the template-matching filter coefficients are also calculated. The complete spike-sorting setup is illustrated in Fig. 2. The algorithm optimization addresses the high redundancy in the data and the issue of temporal spike overlaps.
Fig. 2.
Flow diagram of the spike-sorting setup, with the components that are in the focus of this work highlighted in red.
We present the implementation of the optimized template matching algorithm in a real-time, low-latency, folding structure-based VLSI hardware architecture. Further, we analyze the hardware's spike-sorting performance and resource utilization, and we examine the impact of a reduction of the assigned number of electrodes per neuron on these two parameters. We conclude that on a medium-size Virtex 6 device we can simultaneously process 650 neurons, using five electrodes per neuron, with a latency of 2.65 ms, achieving a spike-sorting error of 0.04 (4%) for spikes not involved in spatio-temporal overlaps.
This paper is organized as follows. Section II introduces the complexity optimization techniques for HDME spike-sorting algorithms. In Section III we apply these techniques to a template-matching based spike-sorting algorithm [23], [24]. The low-latency high-throughput folded hardware architecture resulting from this optimization is introduced in Section IV. The final section of the paper investigates the performance of the optimization techniques and the implemented hardware architecture.
Algorithm Optimization
The complexity optimization targets three major challenges of efficient implementation of HDME data processing algorithms: 1) temporal spike overlaps; 2) the large volume of redundant data; and 3) the large number of recorded neurons.
-
1)
We decompose temporal spike overlaps by dividing the overall electrode area into independent regions of activity (“spike regions”) and processing them separately. In the center of each region is a spiking neuron. We define a maximal radius R of spatial spreading of a spike waveform. This value corresponds to the area around a spiking neuron where its template waveform has significant amplitude (greater than noise level). Two spiking neurons are placed in separate regions in case their mutual distance exceeds R. The neurons are, in this case, considered to be distant. The value of R depends on the nature of the recording (usually few tens of μm).
Each region is defined by the position of the spiking neuron in its center. This neuronal position is approximated by the position of the electrode on which the neuron's template has the highest amplitude.
-
2)
In order to deal with the high data redundancy, we reduce the number of electrodes considered per neuron. We simply order the set of electrodes for each neuron according to the energy of the template waveform on each electrode. We define the energy of a template as the sum of squares of the waveform samples. Also, more sophisticated relevance measures could be used, e.g., considering the noise statistics, the discriminability of the neuron and its neighbors or the spatial spread of the electrodes.
We discard the electrodes with low-energy templates and the remaining electrodes we refer to as “relevant electrodes” of a certain neuron. Concatenated spike waveforms recorded on the relevant electrodes, from now on, we refer to as “multi-electrode spike waveform” (“spike waveform” for the sake of brevity) of a neuron.
-
3)
Due to the large number of neurons that need to be processed simultaneously, i.e., in order to save computational resources, processing of the entire set of recording electrodes is multiplexed (“folded”) in time. The overall electrode set is partitioned so that the computations within each partition are performed in a single multiplexing (“folding”) cycle in the hardware architecture. The partitioning of the electrode set is possible due to the fact that the neurons that do not share relevant electrodes can be treated independently by an algorithm. Ideally, neurons from one electrode partition do not yield signals on any relevant electrodes of the neurons in the adjacent partitions.
In order to ensure that each fold of the hardware architecture contains approximately the same number of computational units, i.e., signal-processing units that operate in parallel (e.g., filters for filter-based algorithms), each partition encompasses approximately the same number of neurons. This measure leads to a uniform distribution of the computing demands across the electrode set. The upper limit of the partition number (NP) is determined by the data sampling frequency (fS) and the single-partition processing step latency (tD) as follows: NP < 1/(fstD).
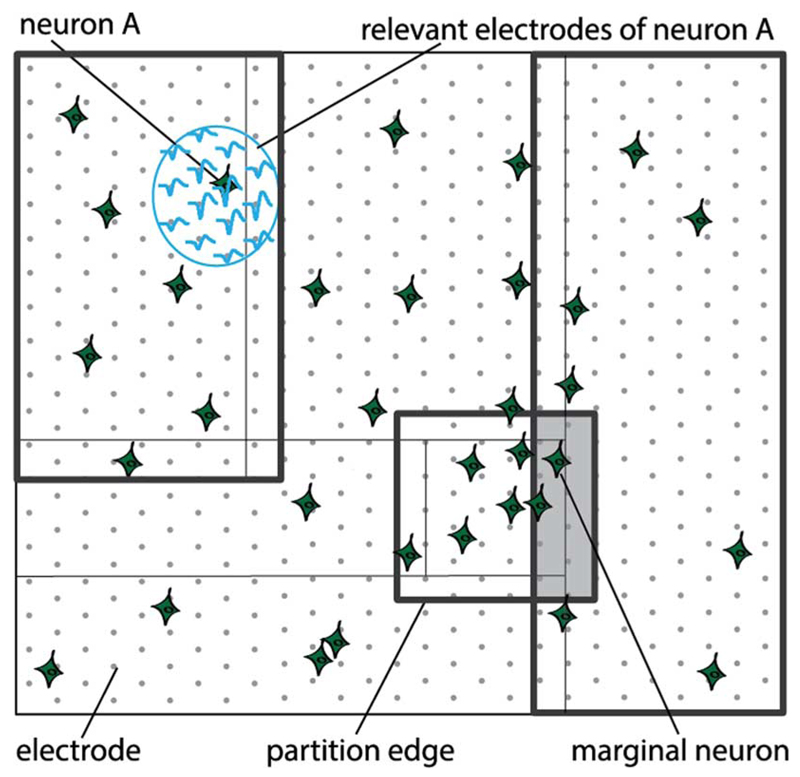
The division of the overall electrode set into independent partitions is usually not straightforward. The neurons belonging to adjacent partitions and located near the partition edges are likely to yield signals on some common relevant electrodes. In this case, a neuron spiking near the edge of a partition (“edge neuron”) might induce false spike detection, i.e., might cause a false spike to be assigned to a neuron located in its proximity, but belonging to the adjacent partition. For this reason we extend each provisional partition and cause the adjacent partitions to overlap. We refer to this partition-overlap area as a “marginal zone”. An illustration of an electrode set, its provisional partitions and marginal zones is depicted in Fig. 3. The width of a partition's marginal zone is defined in such a way as to ensure that spiking of a neuron at one side of the marginal zone cannot result in false spike detection at the opposite side of the marginal zone.
Fig. 3.
Illustration of a partitioned electrode set. For clarity, not all partitions are shown. Partitions are limited by thick lines; thin lines mark the provisional partitions. Partitions are different in size, resulting from the nonuniform spatial distribution of neurons. Marginal zone is depicted by a grey rectangle. Lightblue ellipse encompasses relevant electrodes for a given neuron.
To prevent false spikes from being assigned to the neurons located within a marginal zone (“marginal neurons”) we consider the following: a neuron is spiking in a partition Q, close to the marginal zone, which is shared by partition Q and an adjacent partition W. As a result of sharing relevant electrodes with the spiking neuron, a marginal neuron within this zone might be falsely reported as active in the partition W. On the other hand, in the case that the marginal neuron really spikes, its activity will be reported in both the partition Q and the partition W. This is why the marginal neuron's spiking is accepted only if its activity had been reported in both partitions, Q and W. A generalized approach is as follows: spiking of a marginal neuron is accepted as true only if a report has been generated as many times as there are partitions that this neuron belongs to (considering possible spatial layouts of partitions, this number can be 2, 3 or 4). The reports need not be simultaneous (i.e., within the same sampling cycle), but can occur within a short sampling window, which is wide enough (few cycles) to allow for possible noise-related jitter in the spike detection.
II. BOTM Algorithm
In this section, we give a theoretical overview of the Bayes-optimal template-matching (BOTM) spike-sorting algorithm [23], [24], which is targeted for HDME neural recording systems. The overview is followed by the algorithm's complexity optimization according to the technique introduced in the previous section with the aim to make the algorithm suitable for use with high-throughput HDME recording systems.
Algorithm Overview
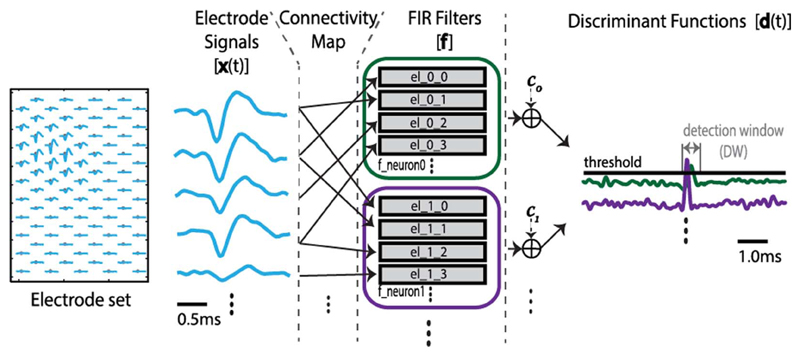
The BOTM algorithm takes into account the multi-electrode nature of the recordings made by high-density electrodes. The algorithm is based on template matching; its flow is illustrated in Fig. 4. Discrimination between different neurons in the recorded data is based on finite impulse response (FIR) filters, F. Each neuron i that is being recorded has its dedicated FIR filter, Fi. represents a sum of multiple subfilters, where k denotes electrodes neuron i is recorded from. The signal from each electrode that records from the neuron is filtered (convolved) by its dedicated subfilter. The coefficients of a subfilter are matched to the average spike waveform that a neuron generates on the electrode which the subfilter is dedicated to (single-electrode template). All single-electrode templates of a neuron, when concatenated, form a multi-electrode template (which we will simply refer to as “template”, ξ). The matching of the subfilters' coefficients to the corresponding single-electrode templates is done in such a way as to maximize the FIR filter's response to the corresponding template while striving to minimize the FIR filter's response to the noise present in the recordings. The subfilter coefficients, i.e., the coefficients of Fi are matched to the template of the ith neuron, ξi, by multiplying the template by the inverse noise covariance matrix, C: Fi = C−1ξi. Due to the nonstationary recording environment (e.g., electrode drift, cell bursting activities, temperature fluctuation, etc.), the templates tend to change in time [25]. To keep the sorting performance high, the algorithm can be periodically adapted to this change by recomputing the templates and reconfiguring the filters.
Fig. 4.
Illustration of the BOTM algorithm flow. High-density electrode set on the left and waveforms recorded on the electrodes (dots) in the case of an action potential. Each recorded neuron has its dedicated FIR filter; the filters consist of subfilters matched to the single-electrode spike templates and are loaded with the electrode data at each sampling clock edge, according to the connectivity map. FIR filter responses are summed with constants to form discriminant functions. Discriminant functions are checked for exceeding the zero-threshold; the maximal function within the subsequent detection window (DW) determines the ID of the spiking neuron.
We denote xk (t) a vector containing the data recorded on electrode k over a time interval that corresponds to the length of a single-electrode template and which ends at time t. The response of the filter Fi is
This response is then used to form a so-called “discriminant function” which serves in detecting spikes and discriminating between different neurons
| (1) |
The constant ci carries information on the ith neuron's template energy and its probability of spike generation (pi): ci = In (pi) − (1/2)ξiTC−1ξi.
The calculated discriminant functions are checked for exceeding the zero value (zero-threshold crossing) and in the case that crossing occurs, a spike is detected and reported. Zero-threshold crossing is usually detectable on multiple discriminant functions that correspond to the neurons located in the proximity of the one that spiked. This is due to the fact that the filters in the BOTM algorithm are designed to enhance the waveforms of their corresponding neurons and to reject the noise, but to not reject the waveforms originating from the other recorded neurons (for details, see [23] and [24]). The ID of the spiking neuron corresponds to the discriminant function that has the maximum value in a sampling window following the first threshold exceeding. This sampling window will be referred to as “detection window (DW)”.
The original algorithm includes a dedicated treatment of spatio-temporal spike overlaps; this is, however, beyond the scope of this paper due to the high computational complexity.
The fact that each of the filtering operations and the discriminant function calculations in the algorithm can be performed independently for each neuron opens up the possibility of parallelizing the algorithm's execution. This parallelism, and the simplicity of the operators used (addition and multiplication) makes the algorithm potentially suitable for hardware implementation. However, the complexity of the algorithm grows significantly with increasing number of electrodes and recorded neurons, which calls for optimization steps to be performed prior to the hardware implementation.
A. BOTM-Specific Optimization
1. Electrode Selection
The complexity of the BOTM algorithm is proportional to the number of multiply-accumulate (MAC) operations executed in the FIR filters. This number corresponds to the filter length, i.e., the number of filter coefficients, which is, according to (1), equal to the number of samples in the template that the filter has been matched to. After investigating several ways of selecting relevant electrodes (maximum/minimum template peak value, template peak-to-peak value, single-electrode template energy, single-electrode filter energy), we have found that selecting electrodes based on the highest single-electrode template energy yields the best sorting performance.
2. Detection Window Sizing
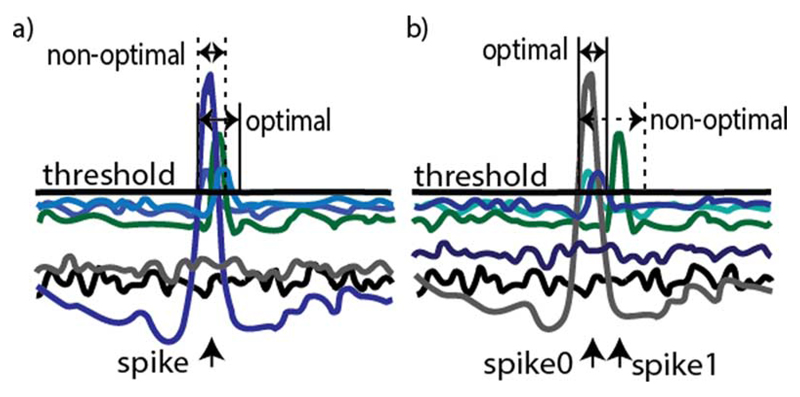
The length of the DW (LDW) needs to be carefully estimated. If the detection window is chosen to be too short, false spikes will be reported. This is a consequence of the fact that the window does not encompass the entire set of discriminant function points above the zero-threshold, as depicted in Fig. 5(a). In case the window is too long, a spike will be missed if two neurons spike shortly, one after the other [Fig. 5(b)]. As the decision of the maximal discriminant function is taken at the end of each window, the longer the window, the larger is the time delay between spike occurrence and its identification. We have opted for an adjustable DW length value—the minimal DW length is fixed and DW ends as soon as all discriminant functions fall below the zero-threshold.
Fig. 5.
Optimal discriminant window length illustrated for a set of discriminant functions. (a) Chosen DW length is too small to include all discriminant functions generated as a result of a single spike—a false DW will start as soon as the first ends, reporting false spikes. (b) Pair of neurons spike within a short time interval. If a large, nonoptimal DW length is used, the second spike will not be detected.
III. BOTM Hardware Architecture
In this section we introduce a real-time, low-latency folded VLSI hardware architecture of the BOTM algorithm. We discuss the benefits of the optimization steps performed in the previous section and examine the architecture's critical path and its latency.
A. VLSI Hardware Implementation
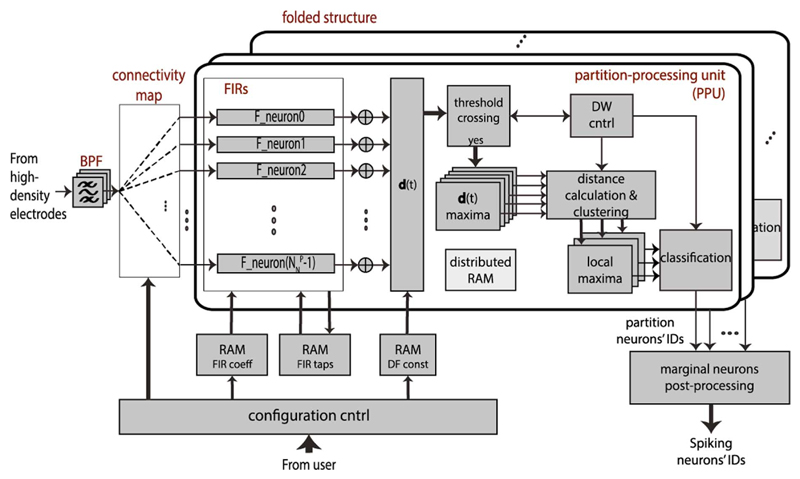
The block diagram of the VLSI hardware implementation of the BOTM spike-sorting algorithm is given in Fig. 6. The main processing load in the designed device is located in the “partition-processing unit” (PPU), where a number of FIR filters operate in parallel, each filter corresponding to a single neuron in the partition. The architecture is folded—the processing of the entire partition set is multiplexed in time, i.e., the PPU processes one electrode partition at a time. The number of FIR filters running in parallel is determined by the maximal number of neurons found in any of the existing partitions. In order to ensure optimal hardware resource utilization, the electrode set is partitioned in such a way that the number of neurons in all partitions is approximately the same.
Fig. 6.
BOTM spike-sorting hardware architecture top-level block diagram. Architecture features a folded structure, enabling hardware resource sharing and simultaneous processing of several hundred neurons. In each fold, computations concerning neurons belonging to a single partition are executed in parallel. Filter taps and coefficients, as well as the discriminant function constants, are stored in block RAMs. Input data from the recording electrodes arrive in a stream (time-multiplexed), are band-pass filtered and forwarded to an FIR filter, according to a connectivity map.
We used direct FIR filters, with the order of 49. The order depends on the single-electrode spike waveform length, which amounted to 50 for our data. Multiply-accumulate (MAC) hardware logic in the FIR filters has been implemented as a part of the PPU, while the filter taps' content has been stored external to this unit, in the RAM memory blocks. Since the input data are sampled at 20 kHz frequency, MAC operations within a single filter are performed sequentially, meaning that only one multiplier is needed per filter. The low logic utilization allows for an efficient area and power implementation. This FIR implementation is arguably more efficient than a commonly used distributed arithmetic FIR implementation. The distributed arithmetic implementation would, due to the high filter order that is used in the algorithm, result in a high memory utilization. Each filter has its own dedicated memory block, implemented in a FIFO form. The address of the first filter tap (containing the most recent data sample) is stored in a pointer, which is updated after each data sampling cycle. Filter coefficients are computed off-line, on an external host machine, and are, as well as the filter taps, stored in RAM memory blocks, each filter having its own dedicated block. Dividing the memory into smaller blocks allows for parallel access to multiple blocks, required for parallel execution of filtering operations within the PPU. The coefficient-RAM blocks are reconfigurable in order to allow the spike-sorting hardware to be adapted to potential changes in spike templates, caused by the nonstationary nature of neural recordings. Coefficient reconfiguration can be performed during the real-time spike-sorting operations, i.e., “on-the-fly”, and requires less than one sampling period for execution. The time, after which filter coefficients need to be reconfigured, depends on the nature of the recordings and on the recording environment (e.g., the presence of electrode drift [26]), and it is typically in the range of several tens of minutes to hours. Results of partition processing that need to be utilized by the same partition in the following sampling cycle are stored in dedicated registers; the remaining computing resources are reused for processing the partition that follows.
Apart from the filtering logic, each PPU contains the logic for calculating discriminant functions and parallel processing of temporal overlaps (distant simultaneous spiking activities). The constants used for forming discriminant functions in (1) are stored in a dedicated RAM block and can be reconfigured as part of the algorithm adaptation, together with the FIR filter coefficients. Each discriminant function is checked for threshold crossing, and the maxima of all discriminant functions that exceeded the zero-threshold are detected within the detection window that follows the threshold crossing. The candidate neurons found in this manner are then localized in the spike regions, one at a time. The dominant neuron of a region is the neuron that has the maximal discriminant function. The distance between two spiking neurons on the electrode set is calculated using a special coordinate system, described in the Appendix, which ensures lower computational complexity than in the case the Cartesian system is used. In the next step, the classification of spikes is performed.
The outputs of the PPU at different folding cycles are compared at the end of each sampling cycle. At this stage, the IDs of marginal neurons detected in different folding cycles are checked in order to discard false spike reports.
The data streamed into the FIR filters from the recording electrodes are usually digitalized with a low number of bits (ten in our case). For this reason, an interpolation stage has been included in the hardware in order to minimize the effect of a potential quantization error. The interpolation is done by means of band-pass filtering. We implemented a second-order, direct form II filter with a band-pass range from 500 Hz to 3 kHz. As the data from the electrodes are streamed in serially, filtering is multiplexed, so that the filtering logic is reused for each incoming signal sample. The filter states for the individual electrode signals are saved in local registers. The filter's frequency range can be configured depending on the nature of the recordings. The data come from the recording electrodes multiplexed in time, i.e., are streamed into the device. Interpolated data, obtained after band-pass filtering, are forwarded to the FIR filters according to the connectivity map. The connectivity map maps the input electrodes to the FIR filters, according to the selection of the relevant electrodes for each neuron, as discussed in Section II. Just like the filter coefficients and discriminant function constants, the connectivity map can be reconfigured “on-the-fly”. The length of the different metrics used in the architecture is a tradeoff between quantization error and hardware usage, and the characteristic figures include: filter taps 20 bits, filter coefficients 14 bits, discriminant functions 13 bits.
B. Latency-Critical Data Path
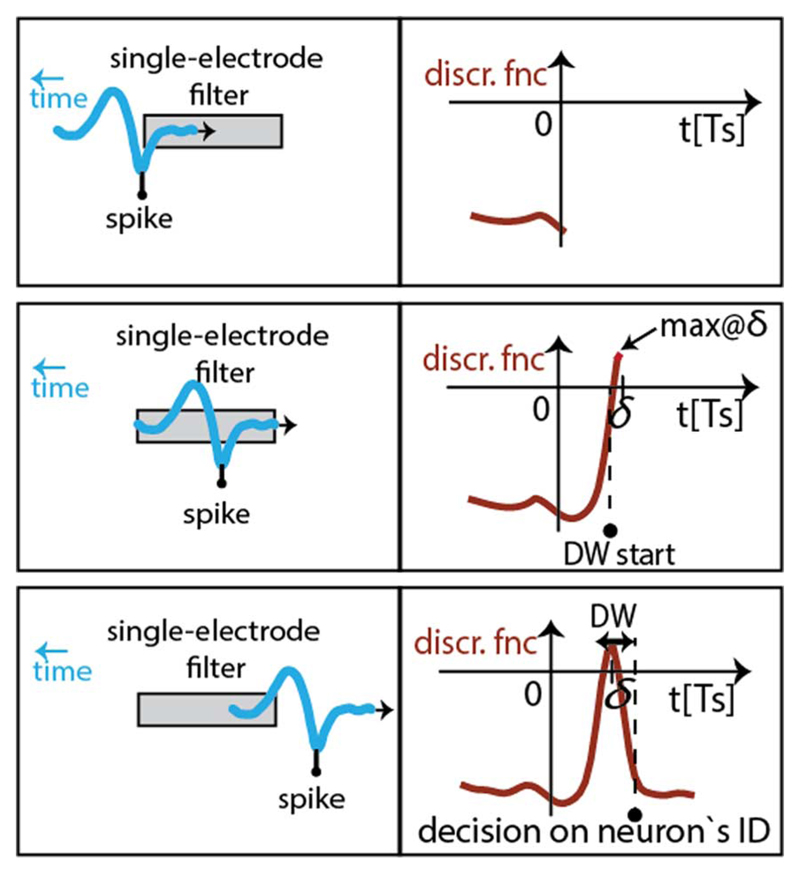
The execution latency of the algorithm is defined as the interval that elapses between the time point at which a spike occurred and the time point at which the spike is classified. In the BOTM algorithm implementation, this value depends mostly on the length of the subfilters (i.e., the single-electrode template length), which directly depends on the nature of the neuronal recordings. The overall latency can be approximated in numbers of sampling clock cycles as represents the number of samples between the negative peak of the band-pass filtered spike waveform (sample chosen to mark the occurrence of a spike) and the end of the spike waveform, as illustrated in Fig. 7. α stands for the data synchronization overhead in hardware and is equal to three sampling clock cycles for the presented architecture. This synchronization is a result of four different clock domains present in the system (input data-stream clock, folding clock, system clock and sampling clock).
Fig. 7.
Algorithm execution latency contributors. A spike occurred at t = 0; at t = δ the entire spike is located in the taps of the corresponding subfilters, and the resulting discriminant function reaches its maximum. After the DW's end has been reached, the spike is classified—the spiking neuron's ID is reported.
IV. Evaluation Results
In the following section, we present a performance evaluation of the hardware BOTM (HW-BOTM) algorithm implementation on an FPGA platform by using semi-artificial HDMEA recordings.
A. Performance Metrics
In order to estimate the spike-sorting performance of the HW-BOTM algorithm, we define the following metrics, denoting the spike-sorting error rate
| (2) |
FP represents the number of spikes that were falsely detected (“false positives”), FN the number of spikes present in the recordings that have not been detected (“false negatives”). Ns stands for the true number of spikes in the data.
The SNR of neuron i is then defined as
| (3) |
where ξi is the template of neuron i, and σk is the standard deviation of the noise on the electrode k, on which the template has its maximal absolute value.
B. Test Data
The test data consist of real noise, recorded on the device presented in [4], superimposed on the spike trains of real mouse retinal ganglion cells' spike templates [21]. The simulated array has a hexagonal arrangement and consists of 90 electrodes with 19 μm center-to-center distance. Three different cell densities have been used: 2887 cells/mm2, which corresponds to the cell density in retinal tissue preparations, 1283 cells/mm2 and 722 cells/mm2, corresponding to cell culture preparations. For each cell density, the performance of the algorithm is averaged over several different data sets for statistical purposes. The overall number of simulated neurons for the default density of 2887 cells/mm2 is around 2050. All neurons have SNR > 1, with respect to (3).
C. Parameter Set
Based on the test data characteristics, its inter-spike intervals, and taking into consideration the low execution latency objective, we have set the minimal detection window length to ten samples. This parameter is robust, such that small variations of its value do not introduce significant changes in spike-sorting performance of the algorithm.
The value of the parameter R, which determines the critical value for two neurons to be considered distant, is determined by simulations. It is set to 70 μm and it depends on the nature of the test data, i.e., the radius of the electrode subset on which it is possible to record activity of a spiking neuron.
D. Electrode Selection—Spike-Sorting Performance
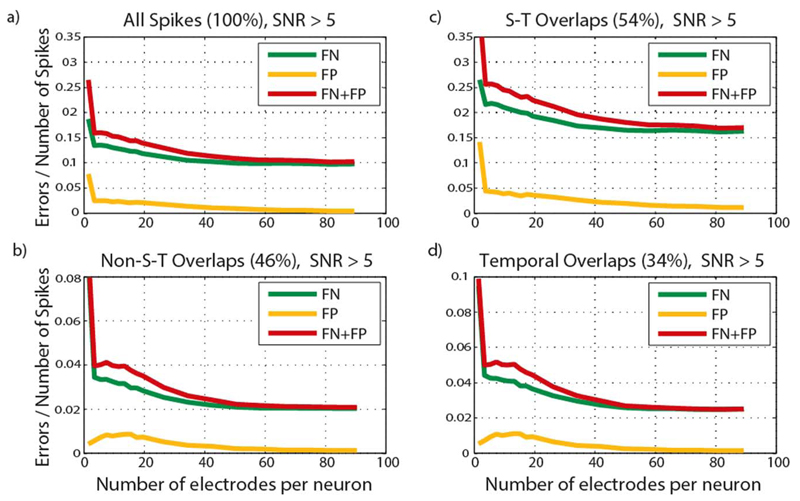
To reduce data redundancy and save hardware resources, only a subset of electrodes is considered to process the signals of each neuron. A tradeoff between the number of electrodes considered per neuron and the spike-sorting performance in the form of false positives, false negatives, and total error rate is depicted in Fig. 8. The plotted data represent the spikes of neurons with SNR > 5 at a density of 2887 cells/mm2. The figure is divided into four plots: all spikes, spikes that are not involved in spatio-temporal (S-T) overlaps (46% of all spikes), spikes that are involved in spatio-temporal overlaps (54% of all spikes) and spikes that are involved in temporal overlaps (34% of all spikes). We have defined spatio-temporal overlaps as neurons spiking within a time interval of up to 1.5 ms (equivalent to 30 sampling cycles at 20 kHz sampling rate) and located within a distance of up to 70 μm (R). The temporal overlaps are defined as neurons spiking within a time interval of up to 1.5 ms and distant more than 70 μm. Having implemented no explicit S-T overlap processing in this hardware, the overall error rate is mainly due to the spikes involved in this type of overlap. However, the algorithm possesses an in-built capability to resolve spatio-temporal overlaps to a certain degree, resulting in a relatively low error rate within this subset of spikes (0.17). This is due to the fact that the filters are “condensing” the spikes in time, i.e., the filter output waveforms are shorter in length than the original spike waveforms. This means that, although the original spike waveforms are overlapping, they produce clearly distinguishable, nonoverlapping peaks in the filter outputs and can be correctly resolved.
Fig. 8.
False negative and false positive error rates as a function of the number of electrodes per neuron for high SNR neurons (SNR > 5): (a) all spikes, (b) spikes not involved in spatio-temporal (S-T) overlaps, (c) spikes involved in spatio-temporal overlaps, (d) spikes involved in temporal overlaps. Values in brackets represent the percentage of all spikes in the data that belong to a specific spike subset, (time-multiplexed) are band-pass filtered and forwarded to an FIR filter, according to a connectivity map.
The error rates in the subset with no S-T overlaps is very low, 0.02 for a high number of electrodes per neuron, FN error being the majority error type. Unlike the S-T overlaps, which have an error rate of 0.17, temporal overlaps are sorted with a low error rate of 0.025.
As expected, spike-sorting performance deteriorates by decreasing the number of electrodes considered per neuron. The small nonmonotonic behavior of the plots comes from the fact that parameter sets proven to be optimal for different electrode counts slightly differ. Keeping in mind the tradeoff between hardware resource minimization and spike-sorting performance maximization, we have opted to use the architecture with five electrodes per neuron, as it provides a sufficiently low error rate for the subset of spikes with no S-T overlaps (0.04).
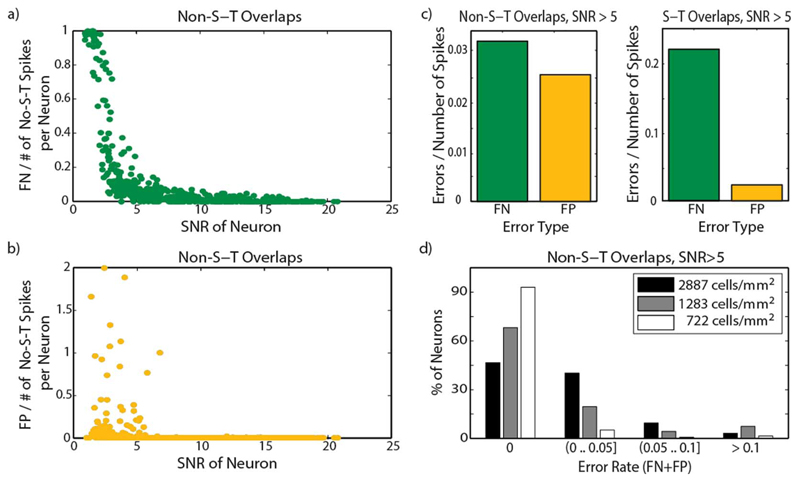
Detailed analysis of the spike-sorting performance with five electrodes per neuron is shown in Fig. 9. Fig. 9(a) and (b) depicts the variation of FN and FP error rates, depending on the SNR of the spiking neurons. Focusing on high-SNR neurons (SNR > 5), Fig. 9(c) shows that errors of the FN type are more prominent than FP errors, both in spike subset with no S-T overlaps and spike subset with only S-T overlaps. Fig. 9(d) depicts the percentage of high-SNR neurons with different ranges of error rates [according to (2)]. The plot shows results for the default neuron density of the test data used for the analysis (2887 cells/mm2), as well as for densities of 1283 and 722 cells/mm2. Obtained values show an increase in spike-sorting performance for less dense cell configurations due to a better separation of spike waveforms among neurons. Even at the highest density, it is possible to sort a large number of neurons without a single error.
Fig. 9.
Performance of the spike-sorting method in the case that five electrodes per neuron are considered. Dependence of (a) FN and (b) FP error rates on SNR of individual neurons has been analyzed. In (c) the relation between FN and FP rates is shown for spikes with no S-T overlaps and spikes with only S-T overlaps. (d) Percentage of neurons in different ranges of error rates for different cell densities. Both (c) and (d) refer to neurons with SNR > 5.
E. Electrode Set Partitioning—Hardware Utilisation
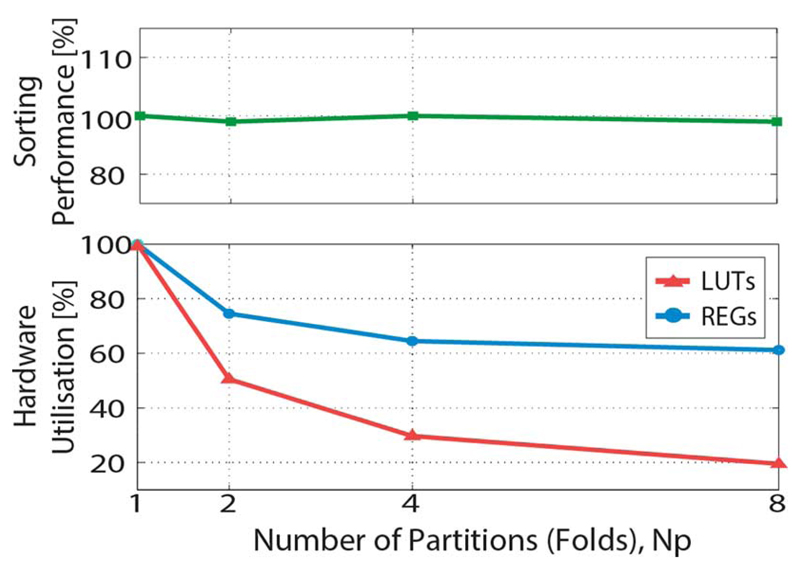
The algorithm architecture has been implemented on a Virtex 6 FPGA device. Hardware resource utilization is measured by the number of inferred Look-Up Tables (LUTs) and registers (REGs). The hardware resource savings obtained by implementing the architecture folding are illustrated in the bottom plot in Fig. 10. The number of implemented folds corresponds to the number of partitions the array has been divided into, according to the electrode set partitioning technique presented in the paper. The hardware resources have been normalized with resources required for the nonfolded architecture. The utilization does not scale with 1/NP due to the hardware blocks that are not affected by folding. The number of registers storing the PPU outputs remains constant with the number of folds. Only the number of registers within the PPU that store intermediate results scales down with NP, which is the reason that the slope of the REGs plot does not follow the slope of the plot LUTs.
Fig. 10.
Hardware resource consumption and spike-sorting performance as a function of the number of electrode set partitions/folding stages. Value used for normalization of the hardware resources corresponds to the nonfolded architecture: 128 neurons, with five electrodes per neuron, the number of occupied Virtex 6 LUTs is 22.8⋅103, and the occupied registers is 190⋅103. Spike-sorting performance is expressed as error rate on all spikes (2), normalized with respect to the error rate on all spikes in the nonfolded architecture. Normalization value is 0.16 (see Fig. 8).
The nonfolded architecture referenced in Fig. 10 is capable of simultaneously processing 128 neurons with five electrodes per neuron. In this architecture, the number of occupied Virtex 6 LUTs is 190 ⋅ 103, and the number of occupied registers is 29 ⋅ 103. The results mean that the same hardware resources can accommodate around 650 neurons using the eight-times fold architecture. The plotted results have been obtained under the assumption that no marginal neurons are present between different partitions. The occupied RAM memory scales only with the number of recorded neurons, not the number of folds, and equals 865 kb for the 128-neuron architecture at any fold.
The upper plot in Fig. 10 shows the error rate when different number of partitions is implemented. The used width of the marginal zone was 60 μm, which ensured sufficient overlap of neighboring partitions. The values have been normalized to the error rate in the nonfolded architecture (0.16, see Fig. 8). The plot shows that saving hardware resources by dividing the electrode set into partitions does not introduce any noticeable changes in the spike-sorting performance.
F. Spike-Sorting Latency
As discussed in Section IV, spike-sorting latency, i.e., the time interval between spike occurrence and spike classification, depends on algorithm parameters (mainly DW length) and the length of single-electrode spike templates. In the test data used in this paper, the typical single-electrode spike waveforms yield δ ≈ 40. Together with the δ parameter leads to a latency of 53 sampling cycles, i.e., 2.65 ms at a 20 kHz sampling rate. This value is well within the range required for closed-loop-based experiments [10].
V. Conclusion
We have presented a complexity optimization, which enables an efficient real-time high-throughput hardware implementation of HDME spike-sorting algorithms. We have successfully implemented the optimization techniques on the previously published BOTM algorithm, enabling its use with large (thousands of electrodes) HDME neural recording systems in real time. We have implemented the expanded algorithm in VLSI hardware architecture, featuring a folded structure and an “on-the-fly” adaptation to changes in the nonstationary neuronal data. Benchmarking of the new method performed on a realistic test data evidenced an error rate of 0.02 for the architecture that considers the full set of electrodes for each neuron in the spike subset with no spatio-temporal overlaps; spikes involved in spatio-temporal overlaps are sorted with an error rate of around 0.17, which results almost entirely from false negative (FN) spikes. The resolution of spatio-temporal overlaps to a certain degree is due to the in-built capability of the algorithm to deal with this type of overlaps. The error rate could be further decreased if dedicated handling of S-T overlaps would be included in the method. The localization of spike regions that deals with temporal overlaps performs very well, as the error rate for the spikes involved in temporal overlaps is 0.025. The tight constraints on hardware resources called for a reduction of the number of electrodes used per neuron. The presented selection of electrodes ensured an error rate of 0.04 for spikes with no S-T overlaps when considering only five electrodes per neuron. In that case, the majority of errors are due to false negative spikes, while false positive error rates are kept low, which is particularly important for certain applications, such as closed-loop experiments. Furthermore, these errors are not spread uniformly over the neurons—many neurons are sorted entirely error-free. The analysis further showed that HW-BOTM provides lower error rates for a lower density of cells on the electrode set.
The hardware architecture was verified on an FPGA Virtex 6 fabric, and it showed the ability to process hundreds of neurons simultaneously using a folded structure. The ability to process a large number of neurons in real time renders our architecture suitable for large-electrode-set recordings, such as those reported in [17] and [27]. The presented architecture could also be implemented as an ASIC, which would entail up to 18 times less area requirements and up to 14 times less power consumption in comparison to an FPGA implementation (see [26], study on 90 nm technology). The reduction in area and power could potentially allow for in vivo applications of the architecture. Architecture folding of the spike processing steps is enabled by the electrode set partitioning technique presented in the paper. The partitioning does not affect the spike-sorting performance, as shown by the analysis. The latency achieved for realistic retinal ganglion cell test data is 2.65 ms and it does not depend on the number of recorded cells, making the architecture suitable for real-time spike sorting in closed-loop experiments.
Acknowledgments
This work was supported in part by the European Community through the ERC Advanced Grant 267351, “NeuroCMOS” and Swiss National Science Foundation Sinergia Project CRSII3_141801.
Biographies
 Jelena Dragas received the B.Sc. degree in electrical engineering from
the University of Belgrade, Serbia, in 2009, and the M.Sc. degree in electronics and
microelectronics from EPFL, Switzerland, in 2011. She is currently working toward
the Ph.D. degree at ETH Zurich, Switzerland.
Her research interests include design of CMOS-based micro-electrode arrays for neuronal signal acquisition and design of VLSI hardware for neuronal signal processing.
 David Jäckel received the diploma in electrical engineering from
ETH Zurich, Switzerland, in 2008. He is currently working towards the Ph.D. degree
in the Department of Biosystems, Science and Engineering, ETH Zurich,
Switzerland.
His research interests include signal processing techniques for extracellular neuronal recordings and the combination of intracellular, extracellular and optical measurements for electrophysiological studies in cultured neuronal networks.
 Andreas Hierlemann (M’99) completed his college education in
chemistry at the University of Tübingen, Germany, and was awarded a Ph.D.
degree in 1996.
He then held Postdoctoral positions at Texas A & M University, College Station, TX, USA, in 1997, and at Sandia National Laboratories, Albuquerque, NM, USA, in 1998. In 1999, he joined the Department of Physics, ETH Zurich, Switzerland, where he was appointed Associate Professor in June 2004. In April 2008, he became a Full Professor in the Department of Biosystems Science and Engineering (BSSE), ETH Zurich, Basel. His research interests include the development of CMOS-based integrated biomicrosystems, bioelectronics, as well as microfluidics for investigation of single cells and microtissues.
 Felix Franke received the B.Sc. degree, in 2005, and the M.Sc. degree,
in 2006, in bioinformatics from the Free University of Berlin, Germany, and the
Ph.D. degree, in 2011, in electrical engineering and computer science from the
Technical University of Berlin and the Bernstein Center for Computational
Neuroscience in Berlin.
In 2011, he joined the Department of Biosystems Science and Engineering of ETH Zürich, Basel, Switzerland, as a Postdoctoral Fellow. He held various scholarships throughout his academic career. His research interests include statistical signal processing, retinal coding, neural coding, and information theory.
Appendix
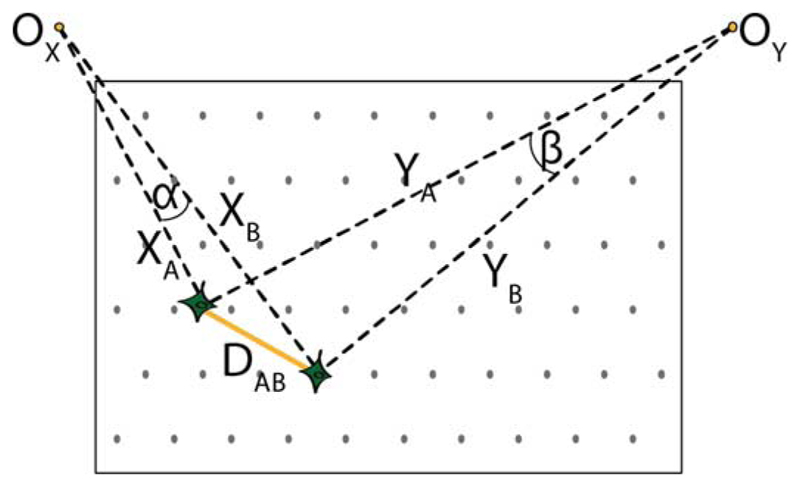
The distance between two neurons A and B (see Fig. 11) is calculated using a 2-D coordinate system, A: (XA, YA), B: (XB, YB). The coordinate system has been defined in a way to provide a lower complexity for interneuronal distance calculation as compared to Cartesian coordinates, i.e., to remove the need of a multiplier. The neurons are regarded as distant if DAB > R. The reference points (OX and OY) are located far above the corners of the electrode set. Keeping in mind the typical dimensions of the existing electrode sets/arrays (few hundred/few thousand μm), we can assume that at any given time, when DAB is in the range of values similar to the critical value R (few tens of μm), at least one of the angles α and β is small enough (e.g., α) to allow |XA − XB| ≈ DAB; while at the same time the larger angle, β, ensures |YA − YB| < DAB. In case both values |XA − XB| and |YA − YB| are less than R, the neurons A and B are considered to be close.
Fig. 11.
Neuronal distances. Distance between two neurons A and B is calculated using a 2-D coordinate system, A: (XA, YA), B: (XB, YB).
Footnotes
Color versions of one or more of the figures in this paper are available online at http://ieeexplore.ieee.org.
References
- [1].Lewicki MS. A review of methods for spike sorting: The detection and classification of neural action potentials. Network. 1998 [PubMed] [Google Scholar]
- [2].Gray M, Maldonado PE, Wilson M, McNaughton B. Tetrodes markedly improve the reliability and yield of multiple single-unit isolation from multi-unit recordings in cat striate cortex. J Neurosci Meth. 1995:43–54. doi: 10.1016/0165-0270(95)00085-2. [DOI] [PubMed] [Google Scholar]
- [3].Berdondini L, van der Wal PD, Guenat O, de Rooij NF, Koudelka-Hep M, Seitz P, Kaufmann R, Metzler P, Blanc N, Rohr S. High-density electrode array for imaging in vitro electrophysiological activity. Biosen Bioelectron. 2005:167–174. doi: 10.1016/j.bios.2004.08.011. [DOI] [PubMed] [Google Scholar]
- [4].Frey U, Sedivy J, Heer F, Pedron R, Ballini M, Mueller J, Bakkum D, Hafizovic S, Faraci FD, Greve F, Kirstein K-U, et al. Switch-matrix-based high-density microelectrode array in CMOS technology. IEEE J Solid State Circ. 2010 Mar;19(3):467–482. [Google Scholar]
- [5].Eversmann B, Jenkner M, Hofmann F, Paulus C, Brederlow R, Holzapfl B, Fromherz P, Merz M, Brenner M, Schreiter M, Gabl R, et al. A 128 × 128 CMOS biosensor array for extracellular recording of neural activity. IEEE J Solid-State Circ. 2003 Dec;38(12):2306–2317. [Google Scholar]
- [6].Hutzler M, Lambacher A, Eversmann B, Jenkner M, Thewes R, Fromherz P. High-resolution multitransistor array recording of electrical field potentials in cultured brain slices. J Neurophysiol. 2006;96:1638–1645. doi: 10.1152/jn.00347.2006. [DOI] [PubMed] [Google Scholar]
- [7].Eckhorn R, Thomas U. A new method for the insertion of multiple microprobes into neural and muscular tissue, including fiber electrodes, fine wires, needles and microsensors. J Neurosci Meth. 1993:175–179. doi: 10.1016/0165-0270(93)90121-7. [DOI] [PubMed] [Google Scholar]
- [8].Normann RA, Maynard EM, Rousche PJ, Warren DJ. A neural interface for a cortical vision prosthesis. Vision Res. 1999;39:2577–87. doi: 10.1016/s0042-6989(99)00040-1. [DOI] [PubMed] [Google Scholar]
- [9].Potter SM, Wagenaar DA, DeMarse TB. Closing the loop: Stimulation feedback systems for embodied MEA cultures. Advances in Network Electrophysiol. 2006:215–242. [Google Scholar]
- [10].Bi G-Q, Poo M-M. Synaptic modification by correlated activity: Hebb's postulate revisited. Annu Rev Neurosci. 2001;24(1):139–166. doi: 10.1146/annurev.neuro.24.1.139. [DOI] [PubMed] [Google Scholar]
- [11].Gibson S, Judy JW, Markovic D. Technology-aware algorithm design for neural spike detection, feature extraction, and dimensionality reduction. IEEE Trans Neural Syst Rehabil Eng. 2010 Sep;18(5):469–478. doi: 10.1109/TNSRE.2010.2051683. [DOI] [PubMed] [Google Scholar]
- [12].Santhanam G, Sahani M, Ryu SI, Shenoy KV. An extensible infrastructure for fully automated spike sorting during online experiments. IEEE Proc Eng Medicine Biol Soc. 2004 doi: 10.1109/IEMBS.2004.1404219. [DOI] [PubMed] [Google Scholar]
- [13].Yang Y, Mason AJ. On-chip spike clustering and classification using self-organizing map for neural recording implants. Proc IEEE Conf Biomedical Circuits and Systems (BioCAS) 2011 [Google Scholar]
- [14].Yu B, Mak T, Li X, Xia F, Yakovlev A, Sun Y, Poon C-S. Real-time FPGA-based multichannel spike sorting using Hebbian eigenfilters. IEEE J Emerging Sel Topics Circuits Syst. 2011 Apr;1(4):502–515. [Google Scholar]
- [15].Chen T-C, Chen K, Yang Z, Cockerham K, Liu W. A biomedical multiprocessor SoC for closed-loop neuroprosthetic applications. Proc Solid-State Circuits Conf ISSCC. 2009:434–435. [Google Scholar]
- [16].Chen T-C, Liu W, Chen L-G. VLSI architecture of leading eigenvector generation for on-chip principal component analysis spike sorting system. Proc Eng Medicine and Biology Soc Conf. 2008 doi: 10.1109/IEMBS.2008.4649882. [DOI] [PubMed] [Google Scholar]
- [17].Einevoll GT, Franke F, Hagen E, Pouzat C, Harris KD. Towards reliable spike-train recordings from thousands of neurons with multielectrodes. Current Opinion Neurobiol. 2011;27:1–7. doi: 10.1016/j.conb.2011.10.001. [DOI] [PMC free article] [PubMed] [Google Scholar]
- [18].Marre O, Amodei D, Deshmukh N, Sadeghi K, Soo F, Holy TE, Berry MJ., II Mapping a complete neural population in the retina. J Neurosci. 2012;32(43):14859–14873. doi: 10.1523/JNEUROSCI.0723-12.2012. [DOI] [PMC free article] [PubMed] [Google Scholar]
- [19].Segev R, Goodhouse J, Puchalla J, Berry MJ. Recording spikes from a large fraction of the ganglion cells in a retinal patch. Nature Neurosci. 2004 doi: 10.1038/nn1323. [DOI] [PubMed] [Google Scholar]
- [20].Prentice JS, Homann J, Simmons KD, Tkacik G, Balasubramanian V, Nelson PC. Fast, scalable, Bayesian spike identification for multi-electrode arrays. PLoS ONE. 2011;6:e19884. doi: 10.1371/journal.pone.0019884. [DOI] [PMC free article] [PubMed] [Google Scholar]
- [21].Jäckel D, Frey U, Fiscella M, Franke F, Hierlemann A. Applicability of independent component analysis on high-density microelectrode array recordings. J Neurophysiol. 2012:334–48. doi: 10.1152/jn.01106.2011. [DOI] [PMC free article] [PubMed] [Google Scholar]
- [22].Franke F, Jäckel D, Dragas J, Müller J, Radivojevic M, Bakkum D, Hierlemann A. High-density microelectrode array recordings and real-time spike sorting for closed-loop experiments: An emerging technology to study neural plasticity. J Front Neurosci. 2012 doi: 10.3389/fncir.2012.00105. [DOI] [PMC free article] [PubMed] [Google Scholar]
- [23].Franke F. Real-time analysis of extracellular multi-electrode recordings. Technische Universität Berlin, Berlin, Germany: 2011. Ph.D. dissertation. [Google Scholar]
- [24].Franke F, Quiroga RQ, Hierlemann A, Obermayer K. Bayes optimal template matching for spike sorting—Combining Fisher discriminant analysis with optimal filtering. J Computational Neurosci. doi: 10.1007/s10827-015-0547-7. to be published. [DOI] [PMC free article] [PubMed] [Google Scholar]
- [25].Franke F, Natora M, Boucsein C, Munk MH, Obermayer K. An online spike detection and spike classification algorithm capable of instantaneous resolution of overlapping spikes. J Computational Neurosci. 2010:127–148. doi: 10.1007/s10827-009-0163-5. [DOI] [PMC free article] [PubMed] [Google Scholar]
- [26].Kuon I, Rose J. Measuring the gap between FPGAs and ASICs. IEEE Trans Computer-Aided Design Integr Circuit Syst. 2007 [Google Scholar]
- [27].Litke A, et al. What does the eye tell the brain?: Development of a system for the large-scale recording of retinal output activity. IEEE Trans Nucl Sci. 2004 Dec;51(6):1434–1440. [Google Scholar]
- [28].Pillow JW, Shlens J, Chichilnisky EJ, Simoncelli EP. A model-based spike sorting algorithm for removing correlation artefacts in multi-neuron recordings. PLOS ONE. 2013 doi: 10.1371/journal.pone.0062123. [DOI] [PMC free article] [PubMed] [Google Scholar]


