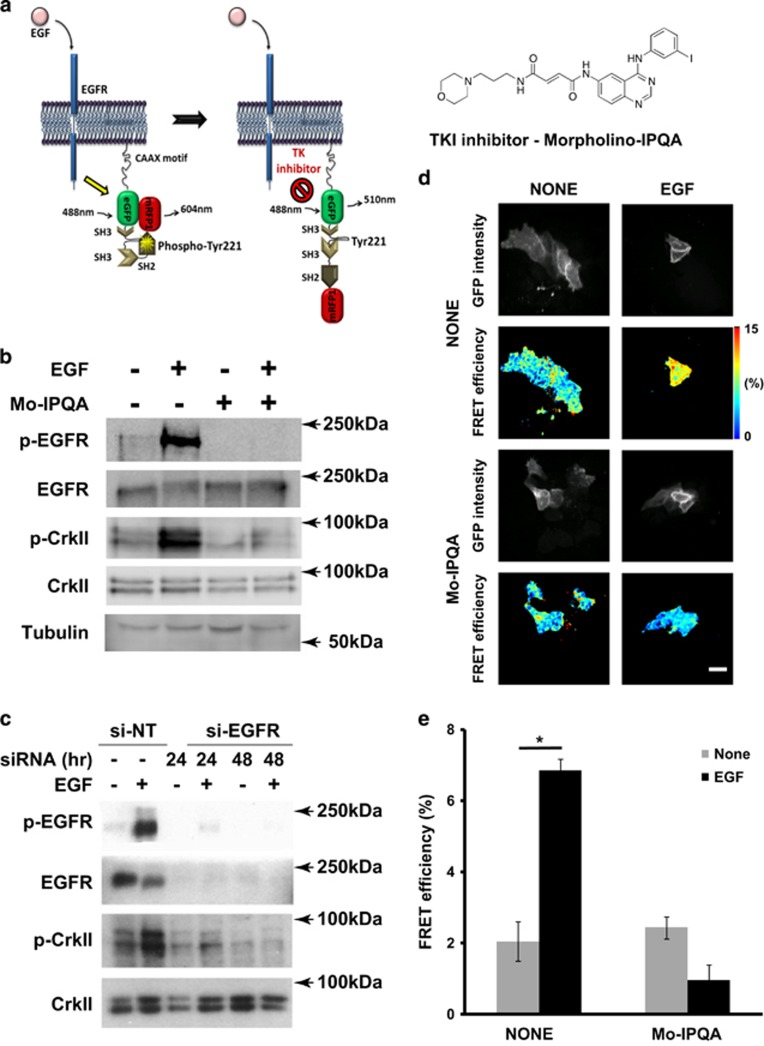
Figure 1.
EGF-induced activation of EGFR and phosphorylation of Picchu-X. (a) Schematic representation of conformational changes of the Picchu-X biosensor upon EGF stimulation and inhibition with TKI enabling FRET measurement of EGFR activity. (b) Effect of Mo-IPQA (10 μM) on EGF-induced (100 ng/ml) EGFR activation and biosensor phosphorylation in HCC1954 cells. (c) Effect of EGFR knockdown on phosphorylation of biosensor. (d) FRET/FLIM images of cells treated as in (b). Scale bar is 25 μm. (e) Quantification of FRET efficiencies for images in (d). The difference between untreated and EGF-treated cells is statistically significant (data are expressed as means±s.e.m.,*P<0.002, Student’s t-test, N>10 images).

