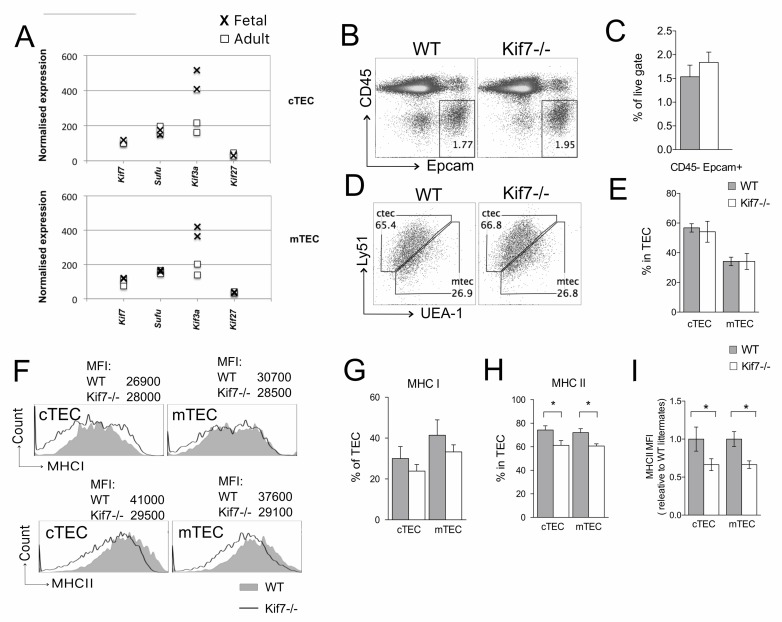
Figure 5. TEC population in Kif7−/−.
In all bar charts in this figure, error bars show the standard error of the mean (SEM). A. Expression of Kif7 and related genes assessed by microarray (GSE81433) from sorted cTEC (CD45-EpCam1+Ly51+UEA-1-, upper plot) and mTEC (CD45-EpCam1+Ly51-UEA-1+, lower plot) extracted from fetal (crosses) and adult (squares) thymus. (B-I) E16.5 WT (n = 4) and Kif7−/− (n = 5) FTOC were cultured for 7 days and TEC analysed by flow cytometry. B. Dot plot shows anti-CD45 and anti-Epcam1 staining on WT and Kif7−/− FTOC. C. Bar chart: percentage of TEC (CD45-Epcam1+) cells in WT and Kif7−/−. D. Facs profiles and E. bar chart shows proportion of cTEC (Ly51+UEA-1-) and mTEC (Ly51-UEA-1+) populations in WT and Kif7−/− FTOC. F. Histograms: cell surface staining for MHCI (upper panel) and MHCII (lower panel) on cTEC and mTEC populations isolated from WT (solid grey) and Kif7−/− (black line), giving MFI for each population. (G-I) Bar charts show mean percentage of G. MHCIhi cells and H. MHCIIhi cells in cTEC and mTEC populations from WT (solid bars) and Kif7−/− (open bars) fetal thymus; for MHCII, cTEC, *p = 0.048; mTEC, *p = 0.01 I. Bar chart: relative mean MFI (relative to mean of WT littermates) of anti-MHCII staining in cTEC and mTEC within the MHCII+ population; cTEC, *p = 0.03; mTEC, *p = 0.01.

