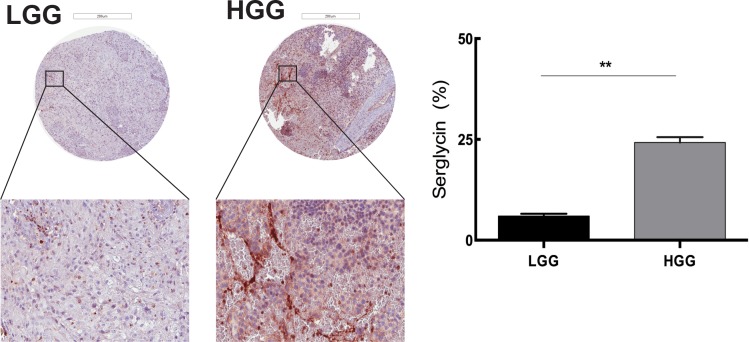
Figure 2. Serglycin expression is correlated with human glioma malignancy grade.
Representative TMA cores of low-grade glioma (LGG) (upper left panel) and high-grade glioma (HGG) (upper right panel) for serglycin expression. Selected areas from upper panels are magnified in the middle panel. TMAs involved tumor tissue from high-grade gliomas (anaplastic gliomas and glioblastomas, n = 101) and gliomas WHO grade II (astrocytomas, oligoastrocytomas and oligodendrogliomas grade II, n = 87). Scale bar = 200 μm. Quantification of the SRGN expression levels (lower panel) shows significantly higher level of SRGN expression in the high-grade glioma TMA. Data is expressed as mean + SEM values and significance differences are indicated in the figure. **p < 0.01.

