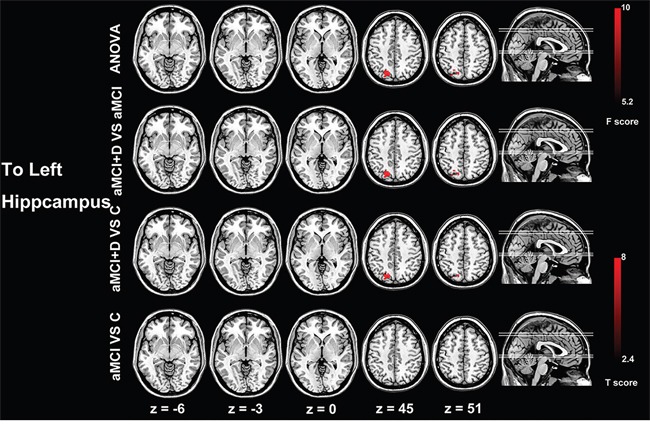
Figure 2. Group differences of effective connectivity based on the seed of left hippocampus.

ANOVA analysis shows significant difference of effective connectivity from the left superior parietal gyrus and superior and middle occipital gyrus to the left hippocampus. Compared with the aMCI patients and healthy controls, the MDD-aMCI patients have increased effective connectivity from the left superior parietal gyrus and superior and middle occipital gyrus to the left hippocampus. The t value and F value color-coded scale are reported at the right side of the images.
Abbreviations: ANOVA, analysis of variance; D, major depressive disorder; aMCI, amnestic mild cognitive impairment; C, healthy control.
