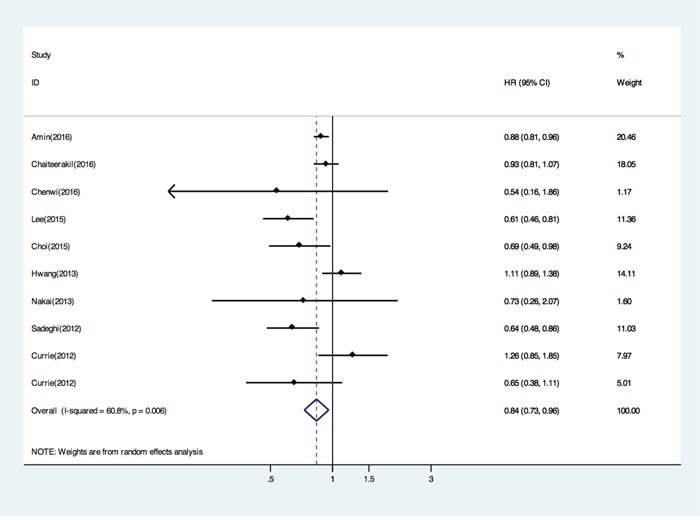
Figure 2. Forest plot (random effects model) of pooled Hazard ratios(HRs) of overall survival by metformin versus non-metformin treatment.

Each study is shown by the point estimate of the HR (the size of the square is proportional to the weight of each study) and 95% CI for the HR (extending lines). The diamond represents the summary HR and 95% CI.
