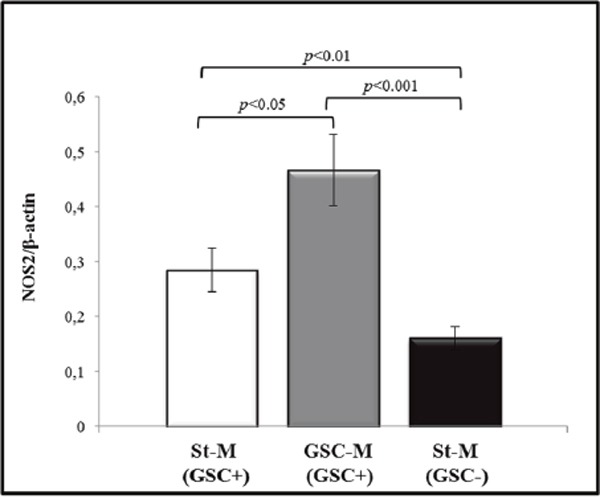
Figure 8. Densitometric analysis of NOS2 expression levels.

Analysis of NOS2 levels in the 5 primary cultures maintained in St-M and able to generate neurospheres (white bar), in the respective neurospheres (grey histogram) and in the 5 primary cultures in St-M that did not generate neurospheres (black histogram). Histogram bars represent the mean of data shown in Figure 7 ± SD.
