Abstract
On-chip preconcentration, purification, and fluorescent labeling are desirable sample preparation steps to achieve complete automation in integrated microfluidic systems. In this work, we developed electrokinetically operated microfluidic devices for solid-phase extraction and fluorescent labeling of preterm birth (PTB) biomarkers. Reversed-phase monoliths based on different acrylate monomers were photopolymerized in cyclic olefin copolymer microdevices and studied for the selective retention and elution of a fluorescent dye and PTB biomarkers. Octyl methacrylate-based monoliths with desirable retention and elution characteristics were chosen and used for on-chip fluorescent labeling of three PTB biomarkers. Purification of on-chip labeled samples was done by selective elution of unreacted dye prior to sample. Automated and rapid on-chip fluorescent labeling was achieved with similar efficiency to that obtained for samples labeled off chip. Additionally, protocols for microchip electrophoresis of several off-chip-labeled PTB biomarkers were demonstrated in poly(methyl methacrylate) microfluidic devices. This study is an important step toward the development of integrated on-chip labeling and separation microfluidic devices for PTB biomarkers.
1. Introduction
Microfluidics is a vibrant and expanding research field.1–4 An especially attractive feature of microfluidics is the ability to integrate multiple processes on a single device to achieve rapid, automated analysis.2, 5 Many processes like preconcentration,6–8 electrophoretic separation,9, 10 fluorescent labeling,11, 12 and solid phase extraction (SPE),13–15 have been implemented in microfluidic setups. However, samples for analysis in microfluidic devices are generally prepared off-chip, making this one of the biggest obstacles in achieving complete automation.2, 16, 17 Off-chip sample preparation can extend total analysis time and is prone to errors that cause variation and irreproducibility. Sample preparation steps like purification, preconcentration and fluorescent labeling performed on-chip can potentially overcome these challenges and lead to truly automated and rapid analysis.3 Microfluidic integration of sample preparation may also lead to cost reductions as reagent volumes and waste generation can be minimized.2
Sample purification and preconcentration can be achieved by SPE using a solid support in a microfluidic setup.18, 19 Solid supports can be made using packed materials,18, 20 monoliths,21, 22 hydrogels,23, 24 or membranes.6, 25 First introduced in microfluidics by Fréchet et al.,21 monoliths have been used extensively for SPE, preconcentration and sample modification26, 27 due to their facile fabrication, low backpressure and surface modification capabilities.27, 28 Monoliths used for SPE in microfluidics include affinity13, 14, 20, 29 and reversed-phase.11, 15, 30 Reversed-phase monoliths are used to retain analytes based on hydrophobic interactions, allowing preconcentration or separation.26, 31 Reversed-phase monoliths are commonly made from cross-linked chains of alkyl methacrylates like methyl methacrylate, butyl methacrylate (C4), octyl methacrylate (C8), lauryl methacrylate (C12), or octadecyl methacrylate.11, 12, 32–34
One of the slowest sample preparation steps in laser-induced fluorescence (LIF) analysis is the labeling of analytes, which can take hours to days.35, 36 Nge et al.11 reported reversed-phase monoliths in cyclic olefin copolymer (COC) devices for SPE and on-chip fluorescent labeling of model proteins. The monoliths simultaneously enriched the protein and fluorescent dye, which increased their effective concentrations, enhancing labeling. This work was further validated by Yang et al.12 for fluorescent labeling of proteins using fluorescein isothiocyanate (FITC) and Alexa Fluor 488. In both of these prior studies, only proteins were fluorescently labeled on-chip; additionally, these proteins were not collectively linked to a particular medical condition. Thus, in this study we have advanced this approach for on-chip fluorescent labeling of a peptide and proteins that are preterm birth (PTB) biomarkers.
PTB, the most common complication in pregnancy, affects more than 500,000 births every year in the USA alone and is the leading cause of newborn deaths and illnesses.37–39 An early diagnosis of PTB risk could allow therapeutic interventions to delay delivery and hence improve health outcomes for infants at risk; such a diagnosis could come through the measurement of specific biomarkers in maternal fluids.40, 41 Importantly, a recently characterized maternal serum biomarker panel showed ~87% sensitivity and ~81% specificity in predicting a PTB four weeks later at a gestational age of 28 weeks.42, 43 Although microfluidic systems have been developed for biomarkers4, 14 indicative of cancers,44–47 and infectious diseases,48, 49 there remains an unmet need for a cost-effective and rapid analysis system for the analysis of PTBs.15, 50
In this work, we lay the foundation for a microfluidic system for the analysis of PTB biomarkers. We demonstrate an electrokinetically operated SPE device consisting of reversed-phase monoliths photopolymerized in COC microchips for selective retention, fluorescent labeling and elution of PTB biomarkers. Different monolith formulations were evaluated to optimize the retention and elution of a peptide PTB biomarker (P1) in the presence of a fluorescent label (FITC).42, 43 Optimized monoliths were further used to achieve on-chip FITC labeling of three PTB biomarkers (one peptide and two proteins). Labeled analytes were then purified by removal of unreacted dye and selectively eluted from the column by changing eluent polarity. A comparison of elution profiles of unattached dye and off-chip labeled samples confirmed on-chip fluorescent labeling. Additionally, in a separate poly(methyl methacrylate) (PMMA) device, microchip electrophoresis (μCE) of several off-chip labeled PTB biomarkers was shown. This indicates potential for future work to integrate these two separate analysis processes (on-chip fluorescent labeling and μCE) in a single device.
2. Experimental section
2.1 Materials and reagents
Zeonor 1020R COC plates (6″×6″×1 mm thick and 6″×4″×2 mm thick) were purchased from Zeon Chemicals (Louisville, KY). PMMA sheets (1 mm and 3 mm thick) were from Evonik (Parsippany, NJ). Single side polished silicon wafers (4″ diameter) were obtained from Desert Silicon (Tempe, AZ). C8 was purchased from Scientific Polymer Products (Ontario, NY). C4, C12, 2,2-dimethoxy-2-phenylacetophenone (DMPA), ethylene dimethacrylate (EDMA), 1-dodecanol, dimethyl sulfoxide (DMSO), and hydroxypropylcellulose (HPC, Mw 100 kDa) were obtained from Sigma-Aldrich (St Louis, MO). Isopropyl alcohol (IPA) and acetonitrile (ACN) were obtained from Fisher Scientific (Pittsburgh, PA). Cyclohexanol was purchased from J. T. Baker (Phillipsburg, NJ). Sodium hydroxide and Tween 20 were from Mallinckrodt Baker (Paris, KY). Cyclohexane and potassium hydroxide were from Macron (Center Valley, PA). Sodium phosphate monohydrate, anhydrous sodium phosphate, anhydrous sodium carbonate, and sodium bicarbonate were from Merck (Darmstadt, Germany). Sodium chloride was purchased from Columbus Chemical (Columbus, WI). Buffers were prepared with deionized water (18.3 MΩ) purified by a Barnstead EASYpure UV/UF system (Dubuque, IA). Unlabeled and FITC-labeled P1 (QLGLPGPPDVPDHAAYHPF), and another unlabeled PTB peptide (P3, NVHSAGAAGSRM(O)NFRPGVLSSRQLGLPGPPDVPDHAAYHPF)42, 50 were synthesized by GenScript (Piscataway, NJ). Ferritin was purchased from EMD Millipore (Billerica, MA) and lactoferrin was from Sigma-Aldrich. FITC used for sample labeling was obtained from Life Technologies (Carlsbad, CA).
2.2 Device fabrication
Device designs were patterned on a silicon wafer (with ~500 nm thermal oxide) by photolithography in a Karl Suss UV aligner (Waterbury, VT) using a positive photoresist (S1805) and developer (MF26A, Dow Chemical, Marlborough, MA) as described previously.51 These patterned silicon templates were then subjected to wet etching using HF and KOH. COC and PMMA devices were made from these silicon templates roughly following hot embossing and thermal bonding techniques described previously.11, 51
2.2.1 COC device fabrication
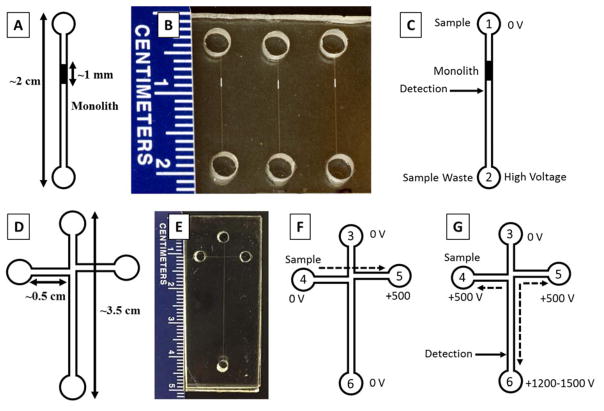
For monolith fabrication and on-chip labeling experiments, straight channel devices (Fig. 1A–C) were made using COC plates. These plates were cut into device size pieces (5 cm × 3 cm) for fabrication using a bandsaw. A device design containing 6 straight channels was transferred from silicon templates to 1 mm thick COC pieces using hot embossing at 138° C for 26 min. A micro drill press (Cameron, Sonora, CA) was used to drill 2 mm diameter holes for reservoirs in 2 mm thick COC cover plates. Drilled COC cover plates were thermally bonded to hot embossed COC plates at 110° C for 24 min. These bonded devices were then further sealed by applying cyclohexane around the edges. Channel dimensions were designed to be ~50 μm wide and ~20 μm deep.
Figure 1.
Device layouts, photographs, and operation. (A) Device layout, (B) photograph and (C) operation of straight channel design showing sample reservoir (1), sample waste reservoir (2), voltage configuration and detection point used for on-chip labeling/SPE of PTB biomarkers. (D) Device layout, (E) photograph, and operation of “T” shaped device for μCE of PTB biomarkers showing (3) buffer, (4) sample, (5) sample waste, and (6) separation waste reservoirs along with voltage configuration and detection point for (F) injection and (G) separation in μCE.
2.2.2 PMMA device fabrication
Four-reservoir “T” shaped devices (Fig. 1D–G) with ~50 μm × 20 μm channel dimensions were fabricated using PMMA for μCE of PTB peptides. PMMA plates were cut into 5 cm × 2 cm pieces using a laser cutter (VLS 2.30 Versa Laser, Universal Laser Systems, Scottsdale, AZ). Holes for reservoirs were also cut into 3 mm thick PMMA cover plates with the laser cutter. Silicon templates were used to transfer the device design onto PMMA pieces by hot embossing at 138° C for 28 min. Drilled cover plates were thermally bonded to embossed channel pieces at 110° C for 25 min and chemically sealed around the device edges using ACN.
2.3 Monolith fabrication
After device fabrication, channels were rinsed with IPA and dried using a vacuum pump. In this study, three different monomers (C4, C8 and C12) for monoliths were used to evaluate retention and elution of P1. Monoliths were fabricated following a similar protocol to that described by Nge et al.11 Monolith pre-polymer solution was prepared by mixing monomers, porogens, Tween 20 and photoinitiator with the mass ratios indicated in Table I. This mixture was sonicated for ~15 min until the photoinitiator was completely dissolved. After sonication, the mixture was purged for 5 min with nitrogen gas and then introduced into the reservoirs to fill the channel by capillary action. Electrical tape was used to seal the reservoirs, and a Cr mask was used to cover the channel, exposing only the desired region (~1 mm long). Monolith polymerization was carried out by UV exposure at >100 mWcm−2 for 11 min using a SunRay 600 UV lamp (Uvitron international, West Springfield, MA) as shown in Fig. S1A in the Electronic Supplementary Information (ESI). Any unpolymerized mixture was then rinsed out with IPA flowed using a vacuum pump. A photograph of a monolith in a channel (Fig. S1B in the ESI) was taken with a Nikon D90 digital camera.
Table I.
Monolith pre-polymer mixture
| Name | Functional role | Mass (%) |
|---|---|---|
| C4, C8 or C12 | monomer | 25% |
| EDMA | cross-linker | 15% |
| cyclohexanol | porogen | 20% |
| 1-dodecanol | porogen | 20% |
| Tween 20 | surfactant | 19% |
| DMPA | photoinitiator | 1% |
Scanning electron microscopy (SEM) images of bulk monoliths were taken using a Phillips XL30 environmental scanning electron microscope (Hillsboro, OR) in high vacuum mode using a 5 kV electron beam potential. Bulk monoliths for SEM were prepared by adding ~250 μL of pre-polymer solution to a 1 mL Eppendorf tube and exposing the whole tube to UV light as above for 11 min. These polymerized monoliths were broken into pieces and stored in IPA for a few hours to dissolve any unpolymerized mixture. Then, the monolith pieces were held in a vacuum chamber overnight before placing on carbon-coated aluminum stubs. To reduce charging, all samples were sputtered with Au-Pd (~15 nm thickness) before imaging using a Q150T ES Sputterer (Quorum Technologies, Lewes, East Sussex, UK).
2.4 Instrumentation and data analysis
The experimental setup for LIF detection has been described previously.13, 14, 52 A Nikon TE300 inverted microscope had a 488 nm laser (JDSU, Shenzhen, China) focused through a 20× objective (0.5 mW incident on the device, ~25 μm beam diameter) on a desired point in the channel to excite the fluorophores. The resulting fluorescence passed through a 505LD dichroic filter and a D535/40 band-pass filter (Chroma, Rockingham, VT) and was detected using a photomultiplier tube (PMT, Hamamatsu, Bridgewater, NJ). This signal was processed by a preamplifier (SR-560, Stanford Research Systems, Sunnyvale, CA). Fluorescence data were digitized by a NI USB-6212 analog-to-digital converter (National Instruments, Austin, TX) and recorded at 20 Hz using LabVIEW software (National Instruments). Voltages were applied to desired reservoirs using platinum electrodes connected to an in-house designed voltage switching box further connected to Stanford Research Systems power supplies (Sunnyvale, CA).
Retention and elution data were collected using a Photometrics coolSNAP HQ2 (Tucson, AZ) CCD camera. A 488 nm laser directed through a 4× objective on a Nikon TE300 inverted microscope was used to illuminate a ~2 mm diameter area on and around the monolith. CCD images were collected with a 500 ms exposure time, and background-subtracted fluorescence was analyzed using NIH ImageJ software. Data were analyzed and plotted using Origin Pro software (OriginLab, Northampton, MA).
2.5 Off-chip fluorescent labeling
Off-chip labeled proteins were prepared by adding 10 μL of 10 mM FITC in DMSO to 100 μL of the unlabeled analyte (500 μM and 50 μM for lactoferrin and ferritin, respectively) and incubating overnight at room temperature. Off-chip labeling of P3 was done similarly with 5 μL of 10 mM FITC in DMSO diluted to 50 μL in a 10 mM solution of P3. After incubation unreacted FITC was removed from lactoferrin and ferritin solutions using Amicon ultra centrifugal filters with a 10 kDa cutoff (EMD Millipore) in a centrifuge (Eppendorf, Denver, CO) at 14000 rpm for 15 min. Excess FITC was not removed after labeling P3 because of its lower molecular weight. The concentrations of labeled stock solutions were measured by a Nanodrop ND-1000 UV spectrophotometer (Wilmington, DE), and dilutions were made in 10 mM BCB (pH 9.5).
2.6 Device operation
Before conducting experiments, monoliths in COC devices were cleaned several times using IPA, and channels in PMMA devices were cleaned with deionized water. Then, buffer was filled in channels by capillary action, and visual inspection was done for any trapped bubbles. For monoliths, flushing was also done electrokinetically using 20 mM bicarbonate buffer (BCB, pH 9.6), by applying +400 V to reservoir 2 and grounding reservoir 1 to remove any air pockets trapped in the monolith.
2.6.1 Retention and elution from monoliths
FITC and FITC-labeled samples were retained and subsequently eluted from monoliths to optimize the conditions for on-chip labeling of PTB biomarkers. For retention and elution studies, the straight channel design described in Fig. 1A–C was used. After flushing monoliths electrokinetically, buffer in reservoir 1 was replaced with off-chip labeled sample or FITC solution. To inject the sample, reservoir 1 was grounded and +500 V were applied on reservoir 2 for 5 min. The detection point was just after the monolith as indicated in Fig. 1C. After sample injection the content of reservoir 1 was removed, rinsed and replaced with fresh 20 mM BCB. Rinsing of unretained sample was carried out by applying +500 V on reservoir 2 and grounding reservoir 1 until the eluting LIF signal became low and steady (~2 min). Further rinsing steps were carried out with 20% ACN, 50% ACN, and 85% ACN using +1000 V at reservoir 2. A CCD image of the monolith was taken after every rinsing and elution step to determine sample retention.
2.6.2 On-chip fluorescent labeling
For on-chip labeling, unlabeled sample (see Figure legends for concentrations) was loaded on a buffer-rinsed monolith for 10 min by applying +500 V at reservoir 2 while grounding reservoir 1. After loading sample, reservoir 1 was rinsed with buffer, and 10 or 20 μM FITC was filled in reservoir 1. FITC was loaded on the monolith by applying the same voltages for 5 min, followed by a no-voltage incubation time of 15–20 min to allow fluorescent labeling. After incubation, the reservoir was rinsed with buffer, which was loaded on the monolith for initial rinsing. Then, 50% ACN was filled in reservoir 1 and unreacted dye was eluted from the monolith by applying +1000 V at reservoir 2 and grounding reservoir 1 until the background signal became low and steady (~5 min). Finally, the labeled sample was eluted by replacing the content of reservoir 1 with 85% ACN and using the same voltage configurations for 2 min.
2.6.3 Microchip electrophoresis
For μCE, the standard design shown in Fig. 1D–E was used. The device was filled with separation buffer, and the sample (see Figure legends for concentrations) was filled in reservoir 4. We used pinched injection51, 53 for injecting fluorescently labeled samples, by applying +500 V on reservoir 5 and keeping the other reservoirs grounded (Fig. 1F). After injection the separation voltage was applied to reservoir 6, reservoir 3 was grounded, and +500 V was applied to reservoirs 4 and 5. For μCE of P1 with PTB proteins, the separation buffer was 50 mM BCB (pH 10, 0.02% HPC), the injection time was 60 s, the separation voltage was +1200 V, and the LIF detection point was 0.5 cm from the injection intersection. For μCE of P1 and P3, the separation buffer was 20 mM BCB (pH 9.8, 0.2% HPC, 25 mM NaCl), the injection time was 90 s, the separation voltage was +1500 V, and the detection point 2.5 cm from the injection intersection.
3. Results and discussion
3.1 Monolith optimization
In this study, monoliths fabricated in thermally bonded COC microchips were used for SPE of PTB biomarkers. COC was chosen as the device material due to its compatibility with organic solvents like acetonitrile and IPA that were used.54, 55 Monoliths were polymerized using a mixture containing 40% acrylate to ensure high porosity and sample retention as demonstrated previously.11, 12, 15 The exposure time for this polymer mixture was optimized to be 11 min for polymerizing high porosity monoliths in COC channels. Polymerized monoliths were found to be readily permeable to aqueous buffers by capillary action, so complicated preconditioning, surface modification or photografting steps56 were not required.
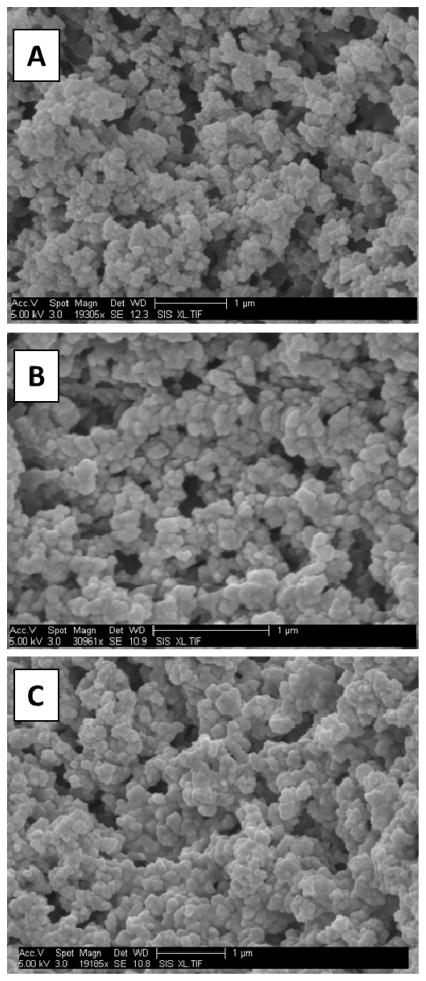
Three different monomers (C4, C8, and C12) were used to fabricate monoliths to study the retention and elution of P1. SEM images of bulk monoliths (Fig. 2A–C) showed nodule sizes from 100–200 nm and pore sizes from 100–1500 nm, consistent with previous reports.12, 22 Monolith porosity decreased with increasing length of alkyl chain going from C4 to C8 to C12. Additionally, pores were distributed randomly, aiding in sample mixing during flow. Monoliths did not dislocate during application of voltage across the channel, in accordance with previous reports.11, 12, 56
Figure 2.
SEM images of bulk monoliths. (A) C4, (B) C8, and (C) C12.
3.2 Retention and elution of P1
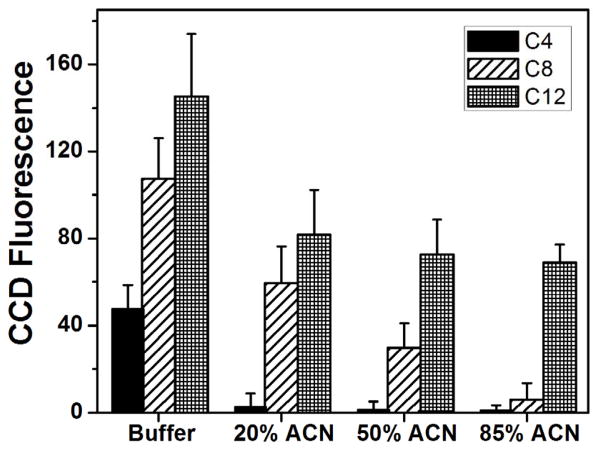
Yang et al.12 previously found that monoliths made from C8 worked well for on-chip labeling of model proteins, showing good retention after rinsing with 50% ACN and efficient elution in 85% ACN. Because on-chip SPE, labeling and elution of PTB peptides had not been shown previously, we tested monoliths made from C4, C8, and C12 to find the optimum composition for experiments with P1. The monomer to porogen ratio was the kept the same (40:60) in all cases to study the effect of the monomer itself on retention of P1. We measured background-subtracted fluorescence in CCD images of the monoliths to determine the retention of off-chip labeled FITC-P1 on these monoliths after rinsing with eluents of decreasing polarity. Fig. 3 shows the background-subtracted fluorescence on C4, C8 and C12 monoliths after injecting 50 μM FITC-P1 for 5 min and rinsing successively with buffer, 20%, 50% and 85% ACN solutions. P1 contains ten uncharged hydrophobic residues and four charged hydrophilic residues which makes it somewhat hydrophobic.57 C4 showed three-fold lower retention of P1 than on C12 after an initial buffer rinse, which can be attributed to the lower hydrophobicity of C4. The retained P1 was also readily eluted in 20% ACN due to its limited hydrophobic interaction with C4. C8 monoliths had more than twice as much retained P1 as C4 monoliths after a buffer rinse, because of the greater hydrophobicity of C8. Additionally, in 85% ACN >90% of the initially retained P1 was eluted, which makes C8 monoliths well suited for selective retention followed by effective elution of P1. C12, due to its highly hydrophobic nature, showed the greatest retention of P1 (~40% more than on C8). However, elution of P1 from C12 monoliths was limited to ~50% of what was present following a buffer rinse, after a series of successive rinses containing 20%, 50%, and 85% ACN solutions. Thus, C8 monoliths showed the best retention and elution characteristics for on-chip labeling of P1, and were chosen for subsequent studies.
Figure 3.
Background-subtracted CCD fluorescence signal obtained from 50 μM FITC-P1 retained on monoliths prepared from C4, C8 or C12 and eluted after successive electrokinetic flow of buffer, 20% ACN, 50% ACN, and 85% ACN (n=3). Error bars represent +1 standard deviation.
3.3 Retention of FITC on C8
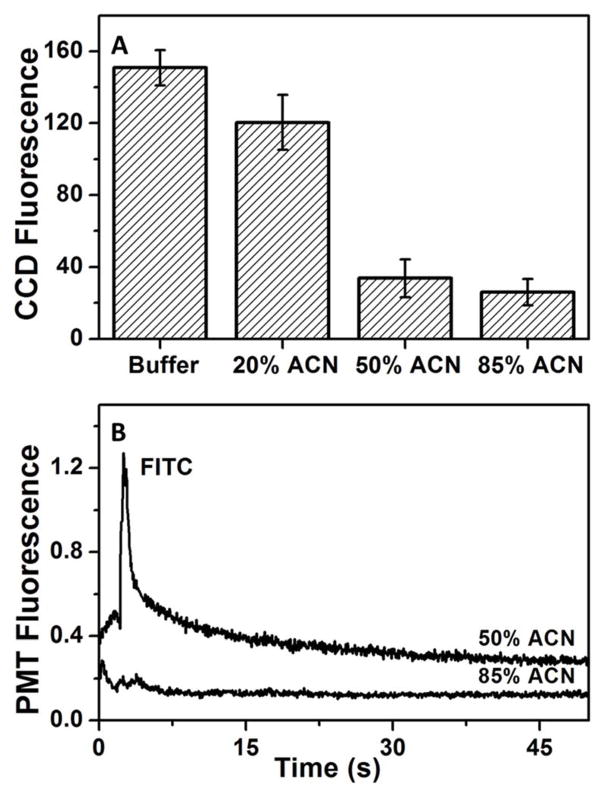
Since C8 showed the best retention and elution characteristics for P1, retention of the widely used fluorescent tag, FITC, was studied on a C8 monolith. We injected 10 μM FITC on the monolith for 5 min and sequentially rinsed with buffer, 20%, 50% and 85% ACN solutions. Fig. 4A shows the background-subtracted fluorescence on the monolith after each step, indicating a ~25% decrease in fluorescence between the buffer rinse and 20% ACN elution, with a further 3-fold decrease in fluorescence after a 50% ACN elution. Fig. 4B shows the electroelution profiles of 10 μM FITC in 50% ACN and 85% ACN recorded just past the end of the monolith (see Fig. 1C). During 50% ACN elution a sharp peak for eluted FITC is observed at ~5 s while only a small increase in signal (near the noise level) was noted in the successive 85% ACN elution, indicating that little additional FITC was eluted with 85% ACN.
Figure 4.
Retention and elution of FITC on a C8 monolith. (A) Background-subtracted CCD fluorescence from a C8 monolith after retention of 10 μM FITC and sequential rinsing with buffer, 20%, 50% and 85% ACN (n=3). Error bars represent ±1 standard deviation. (B) Sequential elution of 10 μM FITC from a C8 monolith after rinsing with 50% and then 85% ACN. Traces are offset vertically.
3.4 On-chip labeling of PTB biomarkers
For on-chip labeling experiments C8 monoliths were prepared and the device was operated as described in sections 2.3 and 2.6. For labeling, mixing of sample and dye solution is necessary, but is also difficult to achieve with laminar flow typically observed in microfluidic channels.58, 59 However, the non-uniform and random porous flow paths in monoliths allow mixing to be achieved more efficiently.19, 60
3.4.1 P1
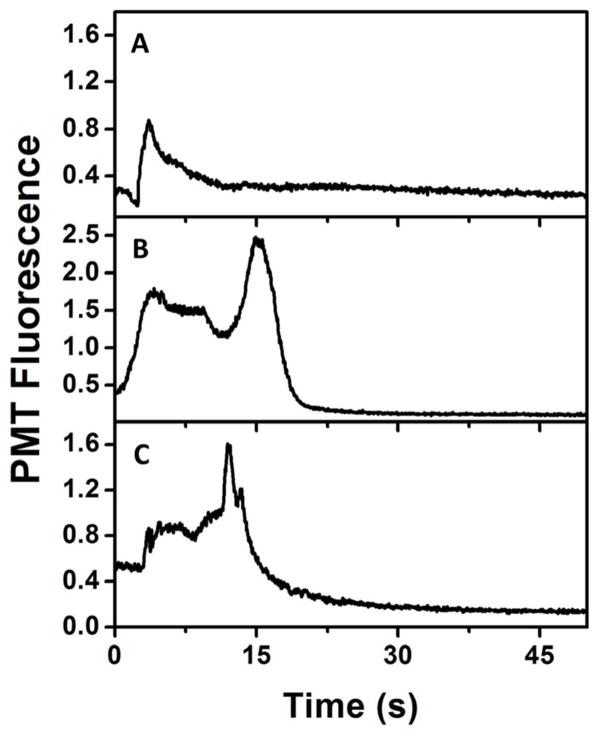
Blank experiments were done using FITC and off-chip labeled P1 to compare the elution profile in 85% ACN to that observed for on-chip labeled P1. Fig. 5A shows the elution of 20 μM FITC in 85% ACN, showing a tailing peak at ~5 s indicating elution of remaining FITC from the column after the 50% ACN rinse. In Fig. 5B, the elution profile of off-chip-labeled 50 μM FITC-P1 is seen. In addition to the FITC peak at ~ 5 s, a second, larger peak is observed at ~15 s, indicating elution of FITC-P1 in the 85% ACN solution. A similar FITC-P1 peak is also observed in Fig. 5C after on-chip labeling of P1 with FITC and the same sequence of washing and elution steps.. In both off-chip and on-chip labeled P1 elution (Fig. 5B–C), a broad peak corresponding to unreacted FITC at ~5 s is observed due to excess FITC used in labeling. The 1-mm length of the monolith is the principal cause of the breadth of the peaks in these electroelution experiments.
Figure 5.
On chip labeling of P1. Electroelution profiles from C8 monolithic columns in 85% ACN of (A) 20 μM FITC, and FITC-P1 labeled (B) off-chip (50 μM), and (C) on-chip (15 μM).
3.4.2 PTB proteins: ferritin and lactoferrin
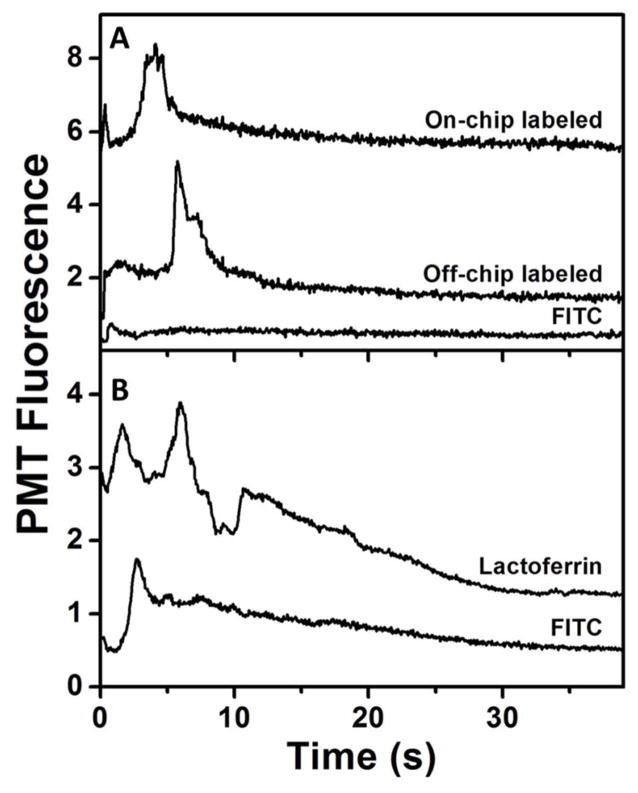
Fig. 6A shows the 85% ACN elution traces of 10 μM FITC and 45 nM ferritin, labeled off-chip and on-chip. Only a small peak for FITC is observed at ~1 s in the blank experiment. For off-chip labeled ferritin retained on and eluted from the column, a small FITC peak was seen at ~1 s and a larger peak corresponding to FITC-ferritin was observed at ~6 s. A similar set of peaks was observed when ferritin was labeled on-chip using FITC. Comparable peak height in 85% ACN elution of the off-chip and on-chip labeled ferritin indicates good efficiency for the on-chip labeling process. The difference in FITC peak heights for off-chip and on-chip labeled ferritin is likely due to the presence of excess FITC in on-chip labeled ferritin, unlike with the off-chip labeled ferritin sample, which was filtered before use. Lactoferrin was also used for on-chip labeling with a similar experimental procedure. Fig. 6B shows the elution profiles in 85% ACN for 20 μM FITC and 1.2 μM lactoferrin labeled on-chip. With only FITC loaded, a single peak corresponding to FITC was observed at ~3 s. When lactoferrin was labeled on-chip a second peak at ~7 s was observed, corresponding to on-chip-labeled FITC-lactoferrin.
Figure 6.
On-chip labeling of PTB proteins. Electroelution profiles from C8 monoliths in 85% ACN for (A) 10 μM FITC blank (bottom), FITC-ferritin (45 nM) labeled off-chip (middle), and on-chip (top); (B) 20 μM FITC blank (bottom), and 1.2 μM lactoferrin labeled on-chip (top). Traces are offset vertically.
3.5 μCE of PTB peptides
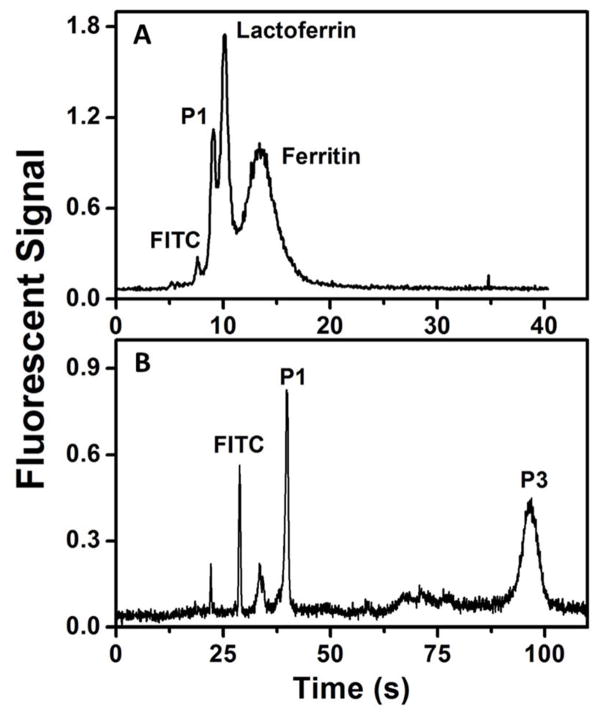
The resolution between dye and analyte peaks in electroelution (i.e., Figs. 5–6) is adequate for some applications, but better resolution between these peaks could be obtained through an additional separation step. Thus, we show μCE of PTB biomarkers as a demonstration of improved resolution between the unattached dye and analyte. In future studies the processes of electroelution and μCE could be integrated in a single device. Fig. 7A shows μCE of three PTB biomarkers (P1, lactoferrin and ferritin). The peaks for the proteins are broadened in the separation because different numbers of amine-reactive sites are labeled with FITC in individual molecules during off-chip labeling, leading to acceptable but incomplete resolution. In Fig. 7B, μCE of two PTB peptide biomarkers (P1 and P3) is shown. P1 (pI=5) appears before P3 (pI=9.5) and has a narrower peak due to its higher electrophoretic mobility owing to its lower molecular weight and higher net charge at pH 9.6. A larger peak for FITC is observed in Fig. 7B compared to Fig. 7A because of unfiltered FITC present in off-chip labeled P3. These electropherograms show our ability to separate PTB biomarkers, a capability that can be further utilized in the future to develop an integrated on-chip fluorescent labeling and μCE device.
Figure 7.
μCE of PTB biomarkers. (A) Electropherogram showing separation of P1 (100 nM), lactoferrin (50 nM) and ferritin (30 nM). (B) Electropherograms showing separation of P1 (50 nM), and P3 (1 μM).
4. Conclusion
Sample preparation is a challenge in automation of analysis. In this study, we demonstrated on-chip SPE and fluorescent labeling of PTB biomarkers. We also performed μCE of several PTB biomarkers in a different device. Reversed-phase monoliths were studied, and an octyl methacrylate formulation was found to provide desired retention and elution characteristics for on-chip labeling of PTB peptide and protein biomarkers. We successfully performed on-chip solid-phase extraction and fluorescent labeling of three PTB biomarkers with comparable results relative to off-chip labeled samples. Importantly, on-chip labeling used 10-fold smaller reagent volumes (~10 μL) in 30-fold faster times (15–20 min) for sample preparation compared to off-chip labeling procedures (~100 μL volumes and ~10 hr reaction times). Although the dye and analyte peaks are not completely resolved in electroelution, we show that better resolution is achieved using μCE.
These studies will further aid in the future development of an integrated setup for on-chip fluorescent labeling and separation of multiple PTB biomarkers. We carried out these analyses on biomarkers dissolved in buffer solutions rather than in biological matrices. However, if an upstream immunoaffinity extraction step that we have previously developed13, 14, 29 is used on biological samples, then the analytes eluted from the column in buffer solution would be compatible with the SPE and fluorescent labeling approach demonstrated herein. Thus, in future work we plan to evaluate immunoaffinity extraction monoliths for PTB biomarkers. Integration of immunoaffinity extraction with on-chip labeling and microchip electrophoresis may result in a truly automated analysis platform for preterm birth biomarkers.
Supplementary Material
Acknowledgments
We are thankful to Bibek Uprety for his help with SEM imaging and to Wade Ellis for assistance with laser power measurement. We also thank the Integrated Microfabrication Laboratory at Brigham Young University for device fabrication facilities. Financial support for this work was provided by the National Institutes of Health through grant R01 EB006124.
References
- 1.Arora A, Simone G, Salieb-Beugelaar GB, Kim JT, Manz A. Anal Chem. 2010;82:4830–4847. doi: 10.1021/ac100969k. [DOI] [PubMed] [Google Scholar]
- 2.Nge PN, Rogers CI, Woolley AT. Chem Rev. 2013;113:2550–2583. doi: 10.1021/cr300337x. [DOI] [PMC free article] [PubMed] [Google Scholar]
- 3.Sackmann EK, Fulton AL, Beebe DJ. Nature. 2014;507:181–189. doi: 10.1038/nature13118. [DOI] [PubMed] [Google Scholar]
- 4.Pagaduan JV, Sahore V, Woolley AT. Anal Bioanal Chem. 2015;407:6911–6922. doi: 10.1007/s00216-015-8622-5. [DOI] [PMC free article] [PubMed] [Google Scholar]
- 5.Araci IE, Brisk P. Curr Opin Biotechnol. 2014;25:60–68. doi: 10.1016/j.copbio.2013.08.014. [DOI] [PubMed] [Google Scholar]
- 6.Nge PN, Yang W, Pagaduan JV, Woolley AT. Electrophoresis. 2011;32:1133–1140. doi: 10.1002/elps.201000698. [DOI] [PMC free article] [PubMed] [Google Scholar]
- 7.Giordano BC, Burgi DS, Hart SJ, Terray A. Anal Chim Acta. 2012;718:11–24. doi: 10.1016/j.aca.2011.12.050. [DOI] [PubMed] [Google Scholar]
- 8.Song H, Wang Y, Garson C, Pant K. Anal Methods. 2015;7:1273–1279. doi: 10.1039/C4AY01858C. [DOI] [PMC free article] [PubMed] [Google Scholar]
- 9.Castro ER, Manz A. J Chromatogr A. 2015;1382:66–85. doi: 10.1016/j.chroma.2014.11.034. [DOI] [PubMed] [Google Scholar]
- 10.Nuchtavorn N, Suntornsuk W, Lunte SM, Suntornsuk L. J Pharm Biomed Anal. 2015;113:72–96. doi: 10.1016/j.jpba.2015.03.002. [DOI] [PubMed] [Google Scholar]
- 11.Nge PN, Pagaduan JV, Yu M, Woolley AT. J Chromatogr A. 2012;1261:129–135. doi: 10.1016/j.chroma.2012.08.095. [DOI] [PMC free article] [PubMed] [Google Scholar]
- 12.Yang R, Pagaduan JV, Yu M, Woolley AT. Anal Bioanal Chem. 2015;407:737–747. doi: 10.1007/s00216-014-7988-0. [DOI] [PMC free article] [PubMed] [Google Scholar]
- 13.Sun X, Yang W, Pan T, Woolley AT. Anal Chem. 2008;80:5126–5130. doi: 10.1021/ac800322f. [DOI] [PMC free article] [PubMed] [Google Scholar]
- 14.Yang W, Yu M, Sun X, Woolley AT. Lab Chip. 2010;10:2527–2533. doi: 10.1039/c005288d. [DOI] [PMC free article] [PubMed] [Google Scholar]
- 15.Kumar S, Sahore V, Rogers CI, Woolley AT. Analyst. 2016;141:1660–1668. doi: 10.1039/c5an02352a. [DOI] [PMC free article] [PubMed] [Google Scholar]
- 16.Verbarg J, Kamgar-Parsi K, Shields AR, Howell PB, Jr, Ligler FS. Lab Chip. 2012;12:1793–1799. doi: 10.1039/c2lc21189k. [DOI] [PMC free article] [PubMed] [Google Scholar]
- 17.Hitzbleck M, Delamarche E. Chem Soc Rev. 2013;42:8494–8516. doi: 10.1039/c3cs60118h. [DOI] [PubMed] [Google Scholar]
- 18.Oleschuk RD, Shultz-Lockyear LL, Ning Y, Harrison DJ. Anal Chem. 2000;72:585–590. doi: 10.1021/ac990751n. [DOI] [PubMed] [Google Scholar]
- 19.Quirino JP, Dulay MT, Zare RN. Anal Chem. 2001;73:5557–5563. doi: 10.1021/ac0155299. [DOI] [PubMed] [Google Scholar]
- 20.Malmstadt N, Yager P, Hoffman AS, Stayton PS. Anal Chem. 2003;75:2943–2949. doi: 10.1021/ac034274r. [DOI] [PubMed] [Google Scholar]
- 21.Yu C, Davey MH, Svec F, Fréchet JMJ. Anal Chem. 2001;73:5088–5096. doi: 10.1021/ac0106288. [DOI] [PubMed] [Google Scholar]
- 22.Ramsey JD, Collins GE. Anal Chem. 2005;77:6664–6670. doi: 10.1021/ac0507789. [DOI] [PubMed] [Google Scholar]
- 23.Dhopeshwarkar R, Sun L, Crooks RM. Lab Chip. 2005;5:1148–1154. doi: 10.1039/b509063f. [DOI] [PubMed] [Google Scholar]
- 24.Tokuyama H, Iwama T. Langmuir. 2007;23:13104–13108. doi: 10.1021/la701728n. [DOI] [PubMed] [Google Scholar]
- 25.Long Z, Shen Z, Wu D, Qin J, Lin B. Lab Chip. 2007;7:1819–1824. doi: 10.1039/b711741h. [DOI] [PubMed] [Google Scholar]
- 26.Svec F. J Chromatogr B. 2006;841:52–64. doi: 10.1016/j.jchromb.2006.03.055. [DOI] [PubMed] [Google Scholar]
- 27.Knob R, Sahore V, Sonker M, Woolley AT. Biomicrofluidics. 2016;10:032901. doi: 10.1063/1.4948507. [DOI] [PMC free article] [PubMed] [Google Scholar]
- 28.Vázquez M, Paull B. Anal Chim Acta. 2010;668:100–113. doi: 10.1016/j.aca.2010.04.033. [DOI] [PubMed] [Google Scholar]
- 29.Yang W, Sun X, Wang HY, Woolley AT. Anal Chem. 2009;81:8230–8235. doi: 10.1021/ac901566s. [DOI] [PMC free article] [PubMed] [Google Scholar]
- 30.Karenga S, El Rassi Z. J Sep Sci. 2008;31:2677–2685. doi: 10.1002/jssc.200800310. [DOI] [PubMed] [Google Scholar]
- 31.Groarke RJ, Brabazon D. Materials. 2016;9:446. doi: 10.3390/ma9060446. [DOI] [PMC free article] [PubMed] [Google Scholar]
- 32.Stachowiak TB, Rohr T, Hilder EF, Peterson DS, Yi M, Svec F, Fréchet JMJ. Electrophoresis. 2003;24:3689–3693. doi: 10.1002/elps.200305536. [DOI] [PubMed] [Google Scholar]
- 33.Aggarwal P, Tolley HD, Lee ML. J Chromatogr A. 2012;1219:1–14. doi: 10.1016/j.chroma.2011.10.083. [DOI] [PubMed] [Google Scholar]
- 34.Liu K, Aggarwal P, Lawson JS, Tolley HD, Lee ML. J Sep Sci. 2013;36:2767–2781. doi: 10.1002/jssc.201300431. [DOI] [PubMed] [Google Scholar]
- 35.Hermanson GT. Bioconjugate Techniques. 3. Academic Press; 2013. [Google Scholar]
- 36.Rashidian M, Dozier JK, Distefano MD. Bioconjugate Chemistry. 2013;24:1277–1294. doi: 10.1021/bc400102w. [DOI] [PMC free article] [PubMed] [Google Scholar]
- 37.Blencowe H, Cousens S, Oestergaard MZ, Chou D, Moller A-B, Narwal R, Adler A, Vera Garcia C, Rohde S, Say L, Lawn JE. Lancet. 2012;379:2162–2172. doi: 10.1016/S0140-6736(12)60820-4. [DOI] [PubMed] [Google Scholar]
- 38.Romero R, Dey SK, Fisher SJ. Science. 2014;345:760–765. doi: 10.1126/science.1251816. [DOI] [PMC free article] [PubMed] [Google Scholar]
- 39.Goldenberg RL, Culhane JF, Iams JD, Romero R. Lancet. 2008;371:75–84. doi: 10.1016/S0140-6736(08)60074-4. [DOI] [PMC free article] [PubMed] [Google Scholar]
- 40.Goldenberg RL, Iams JD, Mercer BM, Meis PJ, Moawad A, Das A, Miodovnik M, VanDorsten PJ, Caritis SN, Thurnau G, Dombrowski MP. Am J Obstet Gynecol. 2001;185:643–651. doi: 10.1067/mob.2001.116752. [DOI] [PubMed] [Google Scholar]
- 41.Goldenberg RL, Goepfert AR, Ramsey PS. Am J Obstet Gynecol. 2005;192:S36–S46. doi: 10.1016/j.ajog.2005.02.015. [DOI] [PubMed] [Google Scholar]
- 42.Esplin MS, Merrell K, Goldenberg R, Lai Y, Iams JD, Mercer B, Spong CY, Miodovnik M, Simhan HN, van Dorsten P, Dombrowski M. Am J Obstet Gynecol. 2011;204:391.e1–391.e8. doi: 10.1016/j.ajog.2010.09.021. [DOI] [PMC free article] [PubMed] [Google Scholar]
- 43.Graves SW, Esplin MS. Am J Obstet Gynecol. 2011;204:S46. [Google Scholar]
- 44.Chikkaveeraiah BV, Mani V, Patel V, Gutkind JS, Rusling JF. Biosens Bioelectron. 2011;26:4477–4483. doi: 10.1016/j.bios.2011.05.005. [DOI] [PMC free article] [PubMed] [Google Scholar]
- 45.Zhang H, Liu L, Fu X, Zhu Z. Biosens Bioelectron. 2013;42:23–30. doi: 10.1016/j.bios.2012.10.076. [DOI] [PubMed] [Google Scholar]
- 46.Sardesai NP, Kadimisetty K, Faria R, Rusling JF. Anal Bioanal Chem. 2013;405:3831–3838. doi: 10.1007/s00216-012-6656-5. [DOI] [PMC free article] [PubMed] [Google Scholar]
- 47.Pagaduan JV, Ramsden M, O’Neill K, Woolley AT. Electrophoresis. 2015;36:813–817. doi: 10.1002/elps.201400436. [DOI] [PMC free article] [PubMed] [Google Scholar]
- 48.Klostranec JM, Xiang Q, Farcas GA, Lee JA, Rhee A, Lafferty EI, Perrault SD, Kain KC, Chan WCW. Nano Lett. 2007;7:2812–2818. doi: 10.1021/nl071415m. [DOI] [PubMed] [Google Scholar]
- 49.Lee WG, Kim YG, Chung BG, Demirci U, Khademhosseini A. Adv Drug Delivery Rev. 2010;62:449–457. doi: 10.1016/j.addr.2009.11.016. [DOI] [PMC free article] [PubMed] [Google Scholar]
- 50.Sahore V, Kumar S, Rogers CI, Jensen JK, Sonker M, Woolley AT. Anal Bioanal Chem. 2016;408:599–607. doi: 10.1007/s00216-015-9141-0. [DOI] [PMC free article] [PubMed] [Google Scholar]
- 51.Kelly RT, Woolley AT. Anal Chem. 2003;75:1941–1945. doi: 10.1021/ac0262964. [DOI] [PubMed] [Google Scholar]
- 52.Yu M, Wang HY, Woolley AT. Electrophoresis. 2009;30:4230–4236. doi: 10.1002/elps.200900349. [DOI] [PMC free article] [PubMed] [Google Scholar]
- 53.Jacobson SC, Hergenröder R, Koutny LB, Warmack RJ, Ramsey JM. Anal Chem. 1994;66:1107–1113. [Google Scholar]
- 54.Ro KW, Liu J, Knapp DR. J Chromatogr A. 2006;1111:40–47. doi: 10.1016/j.chroma.2006.01.105. [DOI] [PubMed] [Google Scholar]
- 55.Faure K, Albert M, Dugas V, Crétier G, Ferrigno R, Morin P, Rocca JL. Electrophoresis. 2008;29:4948–4955. doi: 10.1002/elps.200800235. [DOI] [PubMed] [Google Scholar]
- 56.Ladner Y, Crétier G, Faure K. J Chromatogr A. 2010;1217:8001–8008. doi: 10.1016/j.chroma.2010.07.076. [DOI] [PubMed] [Google Scholar]
- 57.Kyte J, Doolittle RF. J Mol Biol. 1982;157:105–132. doi: 10.1016/0022-2836(82)90515-0. [DOI] [PubMed] [Google Scholar]
- 58.Kamholz AE, Yager P. Biophys J. 2001;80:155–160. doi: 10.1016/S0006-3495(01)76003-1. [DOI] [PMC free article] [PubMed] [Google Scholar]
- 59.Koo J, Kleinstreuer C. J Micromech Microeng. 2003;13:568–579. [Google Scholar]
- 60.Rohr T, Yu C, Davey MH, Svec F, Fréchet JMJ. Electrophoresis. 2001;22:3959–3967. doi: 10.1002/1522-2683(200110)22:18<3959::AID-ELPS3959>3.0.CO;2-5. [DOI] [PubMed] [Google Scholar]
Associated Data
This section collects any data citations, data availability statements, or supplementary materials included in this article.


