

Abstract
Background
There is limited information on the association between metabolic syndrome components including body mass index (BMI) and type 2 diabetes mellitus in elderly Chinese population. Therefore, we investigated whether components of metabolic syndrome are associated with type 2 diabetes mellitus in elderly.
Methods
A total of 479 hospitalized patients (aged 65–95 years) with recently diagnosed type 2 diabetes mellitus were studied retrospectively in a cross-sectional study and compared with 183 subjects with prediabetes and 62 subjects without glucose metabolism abnormalities.
Results
BMI (24.69±3.59 versus 23.92±3.08 and 23.56±3.25 kg/m2), blood pressure, cholesterol, triglyceride, liver enzymes and prevalence of fatty liver were higher in patients with type 2 diabetes mellitus as compared with elderly subjects with prediabetes or normal glucose metabolism separately (all P<0.05). Multivariable regression analysis showed that BMI was associated positively with insulin resistance and inversely with insulin sensitivity in type 2 diabetes mellitus group (all P<0.05).
Conclusion
Higher BMI was associated with increased insulin resistance and decreased insulin sensitivity in elderly Asian population with type 2 diabetes mellitus.
Keywords: body mass index, type 2 diabetes, elderly, aging
Introduction
Morbidity and prevalence of type 2 diabetes mellitus (DM) are increasing in elderly population. The prevalence of type 2 DM in elderly is approximately 22.7% at present in China.1 Global elderly population of type 2 DM has been estimated to increase from 106 million in 2010 to 200 million in 2030.2 Type 2 DM is a chronic progressive metabolic disease caused by various pathogenic factors. However, insulin resistance and deficiency of insulin secretion from β-cells are the main pathogenesis of type 2 DM.3 Type 2 DM usually coexists with other components of metabolic syndrome such as high body mass index (BMI), hypertension, hypercholesterolemia, hypertriglyceridemia and fatty liver4–6 and increases the risk of all-cause and cardiovascular mortality.7–9 High BMI is a predictor of an onset of type 2 DM in older persons aged 65–96 years.10 However, a study reported that high BMI was associated with a lower mortality risk in very elderly population aged ≥80 years with type 2 DM.11 Some recent studies have demonstrated that a J-shaped association exists between BMI and mortality; high BMI was associated with increased mortality among subjects with type 2 DM.8,9 It is not well known if various metabolic syndrome components such as BMI are related to type 2 DM in Chinese elderly. Therefore, we collected recently diagnosed type 2 DM elderly patients retrospectively in a cross-sectional study in order to investigate the correlation between metabolic syndrome components including BMI and type 2 DM in Chinese elderly.
Methods
Patients
Seven hundred twenty-four elderly patients aged 65–95 years (370 males, 354 females) were hospitalized due to comorbidities of diabetes and prediabetes without the use of antidiabetic drugs. The patients’ blood glucose concentration was found to be elevated accidentally after hospitalization. Then, they underwent standard 75 g oral glucose tolerance and insulin release tests from December 2012 to February 2016. Among them, 479 subjects were firstly diagnosed with type 2 DM, 183 with prediabetes and 62 with normal glucose metabolism. Data were collected retrospectively in a cross-sectional study from the First Affiliated Hospital of Chongqing Medical University, Chongqing, China.
We excluded patients with type 1 and other types of DM, alcoholic fatty liver, viral hepatitis, hepatic cirrhosis, glomerulonephritis, pyelonephritis, carcinoma, glucocorticoid use, bleeding, acute cardio- or cerebrovascular disease, acute and chronic infection or trauma.
This study was approved by the ethics committee of The First Affiliated Hospital of Chongqing Medical University, Chongqing, China. All participants provided written informed consent.
Diagnosis of type 2 DM and prediabetes
Diagnosis of type 2 DM and prediabetes was confirmed by oral glucose tolerance and insulin release tests described as follows. After 8 h fasting period, plasma glucose (fasting plasma glucose [FPG]) and insulin concentrations (fasting plasma insulin [FPI]) were measured. Then, the patients were made to drink 300 mL syrup containing 75 g glucose. Postprandial plasma glucose (PPG) and postprandial insulin (PPI) concentrations at 30, 60 and 120 min were determined by glucose oxidase method and radioimmunoassay, respectively. DM, prediabetes and normal glucose metabolism were diagnosed according to the World Health Organization criteria 1998.12 DM is defined as FPG ≥7.0 mmol/L and/or 120 min PPG ≥11.1 mmol/L. Prediabetes refers to impaired fasting glucose (7.0 mmol/L >FPG ≥6.1 mmol/L and 120 min PPG <7.8 mmol/L) and/or impaired glucose tolerance (FPG <6.1 and 11.1 mmol/L >120 min PPG ≥7.8 mmol/L). Normal glucose metabolism refers to 6.1 mmol/L >FPG ≥3.9 and 7.8 mmol/L >120 min PPG ≥3.9 mmol/L.12
FPI was normal or high and PPI increased to varying degrees compared with baseline, and there was no autoimmune antibody against islet β-cells and insulin in the recruited elderly with type 2 DM and prediabetes.
Measurement of insulin resistance parameters: homeostasis model assessment (HOMA) and LogHOMA
Measurement of insulin sensitivity parameters: HOMA−1, quantitative insulin sensitivity check index (QUICKI) and Gutt’s insulin sensitivity index (ISI0,120)
Measurement of estimated glomerular filtration rate (eGFR)
Measurement of BMI
Measurement of blood lipids
Total cholesterol (TC), high-density lipoprotein cholesterol (HDL-C) and triglyceride (TG) were determined by cholesterol oxidase, magnesium sulfate precipitation and three color methods, respectively. Low-density lipoprotein cholesterol (LDL-C) = TC − HDL-C − (TG ÷ 2.19). Apolipoprotein B (apoB) was determined by immune transmission turbidity method.
Measurement of fatty liver and liver enzymes
Fatty liver was diagnosed by color Doppler ultrasound.18 Alanyl aminotransferase (ALT), alkaline phosphatase (ALP), γ-glutamyltransferase (γ-GT) and cholinesterase were determined by rate method.
Statistical analysis
Continuous parameters were expressed as mean values ± standard deviation. The statistical differences were evaluated by one-way analysis of variance, followed, in case of significance, by a two-sided Fisher’s least significant difference test for multiple comparisons. Categorical data were summarized as percentages and compared using chi-square test. Pearson univariate linear correlation and logistic multivariate regression models were utilized for data analysis. Statistical analysis was performed by SPSS 21.0 software package (IBM Corporation, Armonk, NY, USA). A two-tailed value of P<0.05 was considered to be statistically significant.
Results
Clinical characteristics
The age and BMI of the enrolled 724 subjects were 74±6 years and 24.39±3.46 kg/m2, respectively. Compared with prediabetes and normal groups, the insulin resistance index HOMA and LogHOMA were increased and the insulin sensitivity index HOMA−1, QUICKI and ISI0,120 were decreased in the recently diagnosed type 2 DM group (Table 1). There were no differences in age, sex, smoking, drinking, prevalence of coronary heart disease, stroke, hyperthyroidism and gout, and the use of medicines among the three groups (Table 1).
Table 1.
Comparison of clinical characteristics among type 2 diabetes mellitus, prediabetes and normal subject groups
| Type 2 diabetes mellitus (n=479) | Prediabetes (n=183) | Normal (n=62) | P-value | |
|---|---|---|---|---|
| Age, years | 73.83±6.15 | 73.35±5.68 | 73.08±5.36 | 0.484 |
| Sex (M/F) n | 238/241 | 99/84 | 33/29 | 0.563 |
| FPG, mmol/L | 6.98±1.68a,b | 5.67±0.59b | 5.16±0.42 | <0.001 |
| 30 min PPG, mmol/L | 12.36±2.94a,b | 10.06±1.61b | 8.80±1.41 | <0.001 |
| 60 min PPG, mmol/L | 14.91±3.19a,b | 10.80±2.10b | 8.47±2.27 | <0.001 |
| 120 min PPG, mmol/L | 15.81±3.95a,b | 9.27±1.1b | 6.50±0.91 | <0.001 |
| FPI, μU/mL | 7.35±4.96b | 6.46±4.54 | 4.95±2.63 | 0.083 |
| 30 min PPI, μU/mL | 34.63±32.64a,b | 48.78±32.04 | 63.1±47.01 | <0.001 |
| 60 min PPI, μU/mL | 48.03±45.47b | 59.84±42.51 | 70.83±58.34 | 0.046 |
| 120 min PPI, μU/mL | 69.76±57.25 | 72.76±55.49 | 44.58±47.42 | 0.173 |
| Glycated hemoglobin, % | 7.05±1.73a,b | 6.09±0.53 | 6.00±0.40 | <0.001 |
| HOMA | 2.28±1.55a,b | 1.63±1.26 | 1.13±0.62 | <0.001 |
| LogHOMA | 0.27±0.27a,b | 0.12±0.28 | −0.01±0.243 | <0.001 |
| HOMA−1 | 0.67±0.56a,b | 0.96±0.89 | 1.18±0.75 | <0.001 |
| QUICKI | 0.35±0.05a,b | 0.37±0.04 | 0.38±0.03 | 0.002 |
| ISI0,120 | 39.95±11.32a,b | 57.81±13.75b | 104.56±40.35 | <0.001 |
| Smoking, n (%) | 144 (30.1) | 53 (29.0) | 18 (29.0) | 0.956 |
| Drinking, n (%) | 90 (18.8) | 37 (20.2) | 9 (14.5) | 0.612 |
| CHD, n (%) | 79 (16.5) | 37 (20.2) | 15 (24.2) | 0.054 |
| COPD, n (%) | 57 (11.9) | 25 (13.7) | 11 (17.7) | 0.404 |
| Stroke, n (%) | 183 (38.2) | 81 (44.3) | 23 (37.1) | 0.331 |
| Hypothyroidism, n (%) | 41 (18.9) | 16 (16.0) | 9 (27.3) | 0.359 |
| Hyperthyroidism, n (%) | 8 (3.7) | 3 (3.0) | 1 (3.0) | 0.945 |
| TSH, μIU/mL | 3.57±9.14 | 2.38±2.04 | 5.60±17.09 | 0.189 |
| Gout, n (%) | 10 (2.1) | 3 (1.6) | 1 (1.6) | 0.916 |
| Uric acid, μmol/L | 341.26±110.35 | 335.39±109.73 | 322.96±81.2 | 0.427 |
| Creatinine, μmol/L | 80.62±27.72 | 81.88±24.84 | 79.74±23.18 | 0.819 |
| eGFR, mL/min/1.73 m2 | 79.36±19.44 | 78.60±17.58 | 80.10±16.75 | 0.838 |
| Hemoglobin, g/L | 130.03±17.39 | 128.62±14.82 | 129.10±15.22 | 0.608 |
| Albumin, g/L | 39.24±4.33 | 39.6±4.72 | 40.46±4.39 | 0.115 |
| Fibrinogen, g/L | 3.28±1.03 | 3.19±0.95 | 3.12±0.85 | 0.376 |
| Antiplatelet agents, n (%) | 273 (57.1) | 117 (63.9) | 38 (61.3) | 0.343 |
| Warfarin, n (%) | 24 (5.0) | 7 (3.8) | 5 (8.0) | 0.863 |
| ACEI, n (%) | 157 (32.8) | 47 (25.7) | 16 (25.8) | 0.148 |
| ARB, n (%) | 94 (19.6) | 38 (20.8) | 16 (25.8) | 0.552 |
| α1-blockers, n (%) | 9 (1.9) | 7 (3.8) | 1 (1.6) | 0.310 |
| β1-blockers, n (%) | 130 (27.1) | 56 (30.6) | 19 (30.6) | 0.619 |
| CCB, n (%) | 187 (39.0) | 70 (38.3) | 18 (29.0) | 0.311 |
| Diuretics, n (%) | 86 (18.0) | 29 (15.9) | 9 (14.5) | 0.636 |
| Spironolactone, n (%) | 19 (4.0) | 8 (4.4) | 5 (8.1) | 0.337 |
| Statins, n (%) | 313 (65.3) | 122 (66.7) | 42 (67.7) | 0.594 |
| Fibrates, n (%) | 8 (1.7) | 3 (1.6) | 0 (0) | 0.594 |
| Nitrates, n (%) | 77 (16.1) | 36 (19.7) | 12 (19.4) | 0.496 |
| Trimetazidine, n (%) | 52 (10.9) | 21 (11.5) | 8 (12.9) | 0.882 |
| Digitalis, n (%) | 17 (3.5) | 6 (3.3) | 2 (3.2) | 0.981 |
| Finasteride, n (%) | 14 (2.9) | 6 (3.3) | 0 (0) | 0.390 |
| Allopurine, n (%) | 2 (0.4) | 0 (0) | 0 (0) | 0.600 |
| Narcaricin, n (%) | 2 (0.4) | 2 (1.1) | 0 (0) | 0.479 |
| Bicarbonate, n (%) | 7 (1.5) | 3 (1.6) | 2 (3.2) | 0.614 |
| Thyroxine, n (%) | 10 (2.1) | 0 (0) | 2 (3.2) | 0.102 |
Notes: Values are presented as mean ± SD unless otherwise stated. All the figures are based on nonmissing data.
P<0.05 versus prediabetes group;
P<0.05 versus normal group.
Abbreviations: ACEI, angiotensin converting enzyme inhibitor; ARB, angiotensin II receptor inhibitor; CCB, calcium channel blocker; CHD, coronary heart disease; COPD, chronic obstructive pulmonary disease; eGFR, estimated glomerular filtration rate; FPG, fast plasma glucose; FPI, fasting plasma insulin; HOMA, homeostasis model assessment, an insulin resistance index; HOMA−1, reciprocal of HOMA, an insulin sensitivity index; ISI0,120, Gutt’s insulin sensitivity index; LogHOMA, logarithm of HOMA, an insulin resistance index; PPG, postprandial plasma glucose; PPI, postprandial plasma insulin; QUICKI, quantitative insulin sensitivity check index; SD, standard deviation; TSH, thyroid stimulating hormone; F, female; M, male.
Metabolic syndrome components
Compared with prediabetes and normal groups, BMI, resting heart rate (HR), prevalence of primary hypertension, systolic and diastolic blood pressure, TC, LDL-C, TG, apoB, prevalence of fatty liver, ALT, ALP, γ-GT and cholinesterase were higher and HDL-C was lower in patients with recently diagnosed type 2 DM (Table 2).
Table 2.
Comparison of metabolic syndrome components among type 2 diabetes mellitus, prediabetes and normal subject groups
| Type 2 diabetes mellitus (n=479) | Prediabetes (n=183) | Normal (n=62) | P-value | |
|---|---|---|---|---|
| BMI, kg/m2 | 24.69±3.59a,b | 23.92±3.08 | 23.56±3.25 | 0.029 |
| HR, beats/min | 80.28±14.47b | 78.93±14.5 | 75.56±14.84 | 0.047 |
| Hypertension, n (%) | 354 (73.9)a | 121 (66.1) | 39 (62.9) | 0.049 |
| SBP, mmHg | 144.67±23.58a,b | 137.4±22.00 | 132.21±18.09 | <0.001 |
| DBP, mmHg | 79.57±13.01a,b | 76.81±13.19 | 75.44±12.76 | 0.008 |
| TC, mmol/L | 4.55±1.07a | 4.32±1.07 | 4.37±1.11 | 0.048 |
| LDL-C, mmol/L | 2.80±0.90a | 2.6±0.91 | 2.65±0.98 | 0.056 |
| HDL-C, mmol/L | 1.18±0.34b | 1.24±0.30 | 1.30±0.05 | 0.014 |
| TG, mmol/L | 1.81±1.45b | 1.54±1.38 | 1.29±0.91 | 0.008 |
| ApoB, g/L | 0.91±0.27a,b | 0.83±0.25 | 0.84±0.27 | 0.002 |
| FL, n (%) | 194 (40.6)a | 31 (17.1) | 14 (24.0) | 0.001 |
| ALT, U/L | 24.06±17.28b | 21.74±16.11 | 18.82±10.47 | 0.035 |
| ALP, U/L | 81.41±31.99a,b | 74.90±26.98 | 73.07±20.08 | 0.014 |
| γ-GT, U/L | 46.38±69.79b | 35.99±42.49 | 27.99±22.7 | 0.028 |
| CE, U/L | 7,678.98±1,938.23a | 7,307.64±651.60 | 7,517.77±2,289.30 | 0.047 |
Notes: Values presented as mean ± SD unless otherwise stated.
P<0.05 versus prediabetes group;
P<0.05 versus normal group.
Abbreviations: γ-GT, γ-glutamyl transferase; ALP, alkaline phosphatase; ALT, alanine aminotransferase; apoB, apolipoprotein B; BMI, body mass index; CE, cholinesterase; DBP, diastolic blood pressure; FL, fatty liver; HDL-C, high-density lipoprotein cholesterol; HR, resting heart rate; LDL-C, low-density lipoprotein cholesterol; SBP, systolic blood pressure; SD, standard deviation; TC, total cholesterol; TG, triglyceride.
In univariate correlation analysis, BMI and ALT were correlated positively with insulin resistance index HOMA, and BMI and fatty liver were correlated positively with insulin resistance index LogHOMA among patients with recently diagnosed type 2 DM. While BMI and fatty liver were correlated inversely with insulin sensitivity index HOMA−1, BMI was correlated inversely with insulin sensitivity index QUICKI and ISI0,120, respectively (Table 3).
Table 3.
Pearson univariate correlation analysis of metabolic syndrome components with insulin resistance and sensitivity index in type 2 diabetes mellitus
| Value | HOMA
|
LogHOMA
|
HOMA−1
|
QUICKI
|
ISI0,120
|
|||||
|---|---|---|---|---|---|---|---|---|---|---|
| r | P-value | r | P-value | r | P-value | r | P-value | r | P-value | |
| BMI | 0.407 | 0.000* | 0.434 | 0.000* | −0.328 | 0.000* | −0.277 | 0.001* | −0.262 | 0.002* |
| HR | 0.003 | 0.965 | 0.043 | 0.550 | −0.030 | 0.587 | −0.013 | 0.852 | 0.125 | 0.133 |
| HT | 0.015 | 0.841 | 0.050 | 0.493 | −0.083 | 0.251 | 0.029 | 0.687 | −0.077 | 0.357 |
| SBP | 0.036 | 0.618 | 0.008 | 0.911 | 0.035 | 0.633 | 0.012 | 0.868 | 0.025 | 0.765 |
| DBP | −0.005 | 0.945 | −0.022 | 0.765 | 0.041 | 0.569 | 0.037 | 0.606 | 0.090 | 0.284 |
| TC | 0.004 | 0.963 | 0.010 | 0.894 | 0.005 | 0.954 | 0.001 | 0.991 | −0.083 | 0.355 |
| LDL-C | 0.006 | 0.935 | 0.022 | 0.779 | 0.010 | 0.894 | 0.009 | 0.911 | −0.110 | 0.222 |
| HDL-C | −0.024 | 0.762 | −0.062 | 0.423 | 0.040 | 0.608 | −0.004 | 0.960 | −0.090 | 0.318 |
| TG | 0.049 | 0.530 | 0.059 | 0.451 | −0.059 | 0.446 | −0.024 | 0.760 | −0.015 | 0.872 |
| ApoB | −0.036 | 0.645 | −0.029 | 0.709 | 0.048 | 0.541 | 0.026 | 0.737 | −0.040 | 0.656 |
| FL | 0.181 | 0.089 | 0.225 | 0.034* | −0.211 | 0.047* | 0.011 | 0.916 | −0.186 | 0.110 |
| ALT | 0.171 | 0.021* | 0.116 | 0.118 | −0.016 | 0.830 | −0.060 | 0.424 | −0.109 | 0.212 |
| ALP | −0.064 | 0.393 | −0.081 | 0.277 | 0.109 | 0.141 | 0.107 | 0.150 | 0.016 | 0.851 |
| γ-GT | −0.004 | 0.955 | −0.015 | 0.846 | 0.057 | 0.448 | 0.012 | 0.873 | 0.008 | 0.928 |
| CE | 0.093 | 0.238 | 0.128 | 0.102 | −0.113 | 0.152 | −0.007 | 0.929 | −0.118 | 0.206 |
Note:
P<0.05.
Abbreviations: γ-GT, γ-glutamyl transferase; ALP, alkaline phosphatase; ALT, alanine aminotransferase; apoB, apolipoprotein B; BMI, body mass index; CE, cholinesterase; DBP, diastolic blood pressure; FL, fatty liver; HDL-C, high-density lipoprotein cholesterol; HOMA, homeostasis model assessment, an insulin resistance index; HOMA−1, reciprocal of HOMA, an insulin sensitivity index; HR, resting heart rate; HT, hypertension; ISI0,120, Gutt’s insulin sensitivity index; LDL-C, low-density lipoprotein cholesterol; LogHOMA, logarithm of HOMA, an insulin resistance index; QUICKI, quantitative insulin sensitivity check index; SBP, systolic blood pressure; TC, total cholesterol; TG, triglyceride.
Furthermore, in multivariate regression analysis, BMI was only independently directly associated with the insulin resistance index HOMA and LogHOMA (Table 4; Figures 1 and 2) and inversely with sensitivity index HOMA−1, QUICKI and ISI0,120, respectively, among patients with recently diagnosed type 2 DM (Table 4; Figures 3–5).
Table 4.
Logistic multivariate regression analysis of metabolic syndrome components with insulin resistance and sensitivity index in type 2 diabetes mellitus
| Value | β | SE | Wald | P-value | Exp (β) | 95% CI | |
|---|---|---|---|---|---|---|---|
| HOMA | BMI | −0.491 | 0.222 | 4.890 | 0.027* | 1.634 | 1.057–2.524 |
| HOMA | ALT | −0.003 | 0.026 | 0.013 | 0.909 | 0.997 | 0.948–1.049 |
| LogHOMA | BMI | −0.364 | 0.119 | 9.432 | 0.002* | 0.695 | 0.551–0.877 |
| LogHOMA | FL | 0.415 | 1.103 | 0.142 | 0.707 | 1.514 | 0.174–13.161 |
| HOMA−1 | BMI | −0.357 | 0.126 | 7.990 | 0.005* | 0.700 | 0.547–0.896 |
| HOMA−1 | FL | −0.254 | 1.432 | 0.031 | 0.859 | 0.776 | 0.047–12.844 |
| QUICKI | BMI | −0.300 | 0.107 | 7.918 | 0.005* | 0.741 | 0.601–0.913 |
| ISI0,120 | BMI | −0.451 | 0.206 | 4.814 | 0.028* | 0.637 | 0.425–0.953 |
Note:
P<0.05.
Abbreviations: ALT, alanine aminotransferase; BMI, body mass index; CI, confidence interval; FL, fatty liver; HOMA, homeostasis model assessment, an insulin resistance index; HOMA−1, reciprocal of HOMA, an insulin sensitivity index; LogHOMA, logarithm of HOMA, an insulin resistance index; ISI0,120, Gutt’s insulin sensitivity index; QUICKI, quantitative insulin sensitivity check index; SE, standard error.
Figure 1.
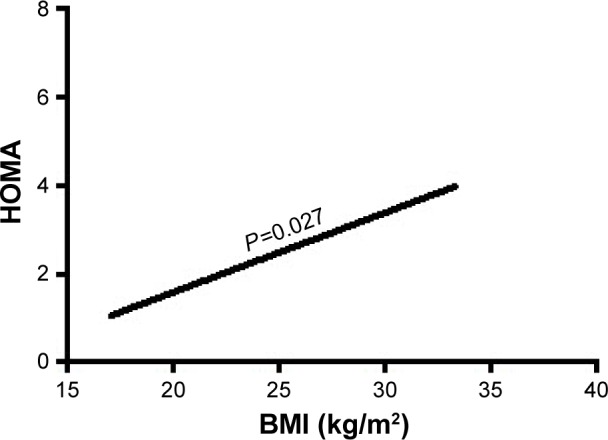
The association of BMI with HOMA.
Abbreviations: BMI, body mass index; HOMA, homeostasis model assessment, an insulin resistance index.
Figure 2.
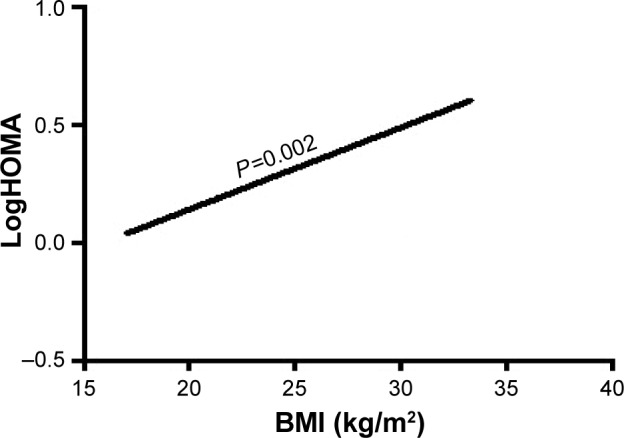
The association of BMI with LogHOMA.
Abbreviations: BMI, body mass index; HOMA, homeostasis model assessment, an insulin resistance index; LogHOMA, logarithm of HOMA, an insulin resistance index.
Figure 3.
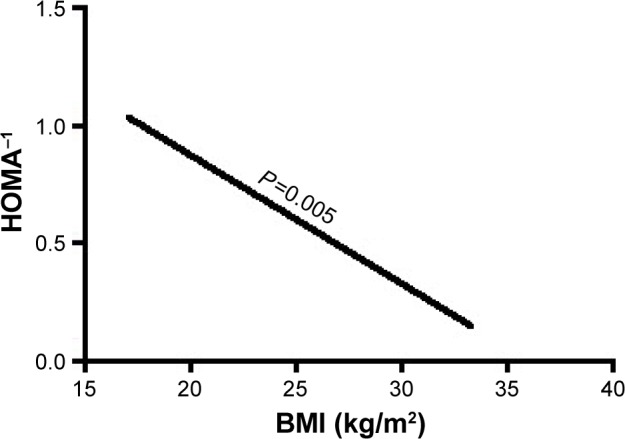
The association of BMI with HOMA−1.
Abbreviations: BMI, body mass index; HOMA, homeostasis model assessment, an insulin resistance index; HOMA−1, reciprocal of HOMA, an insulin sensitivity index.
Figure 4.
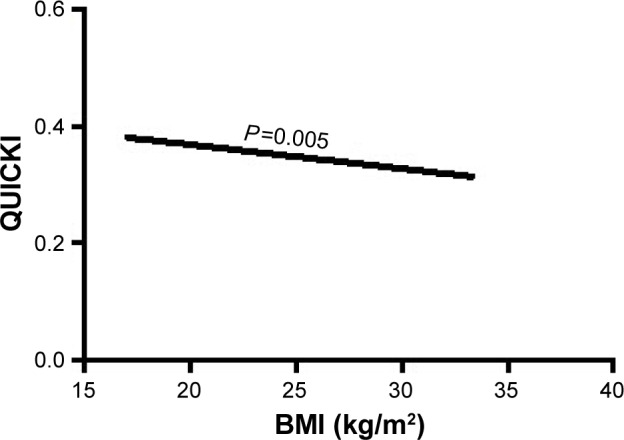
The association of BMI with insulin sensitivity index QUICKI.
Abbreviations: BMI, body mass index; QUICKI, quantitative insulin sensitivity check index.
Figure 5.
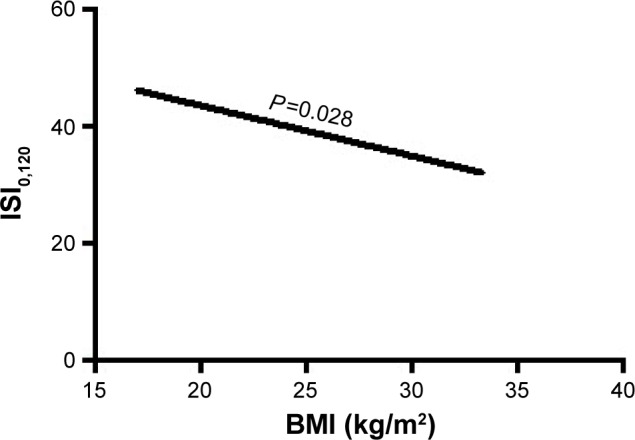
The association of BMI with insulin sensitivity index ISI0,120.
Abbreviations: BMI, body mass index; ISI0,120, Gutt’s insulin sensitivity index.
However, BMI was not associated independently with the insulin resistance and sensitivity index in prediabetes and normal subject groups.
Discussion
Higher BMI was associated with increased insulin resistance and decreased insulin sensitivity in elderly with recently diagnosed type 2 DM. This study shows that higher BMI may be the most important pathogenic factor and associated with type 2 DM in elderly Asian population. These findings were consistent with conclusions from European elderly and Asian population studies.10,19,20 They showed that overweight Asian people are still more susceptible to type 2 DM.20 Our study confirmed that slightly increased BMI was associated with type 2 DM in elderly Asian population. It could be useful for initiating early interventional measures including balanced diet and regular physical exercise to prevent overweight, obesity and type 2 DM in the elderly population.8
Middle-aged adults with elevated resting HR have been reported to have higher risk of incident type 2 DM when they enter old age.21 Our present study found that high resting HR was associated with increased insulin resistance and decreased insulin sensitivity in the elderly with recently diagnosed type 2 DM. However, we did not observe an association between resting HR and type 2 DM in this elderly population, suggesting that increased resting HR is not a determinant of type 2 DM among elderly.
A previous meta-analysis concluded that hypertension could predict the risk of incident type 2 DM in adults aged 30–90 years.22 This study showed that elevated blood pressure was related to high insulin resistance and low insulin sensitivity in the elderly Chinese population with recently diagnosed type 2 DM. However, the independent association of hypertension with type 2 DM has not been found.
High apoB, LDL-C and TG and low HDL-C have been demonstrated to be associated with the risk of incident type 2 DM.23 Previous population studies have shown that hypertriglyceridemia can predict the future risk of incident type 2 DM.24–26 We found that TC, LDL-C, TG and apoB were increased among patients with recently diagnosed type 2 DM, while HDL-C was decreased significantly and was related to high insulin resistance and low insulin sensitivity. Nevertheless, this study found that there was no independent association between the abnormal lipid profile and the risk of type 2 DM in elderly, indicating that lipid abnormalities were not risk markers for type 2 DM.
Increased liver enzymes have been found to predict the risk of incident type 2 DM in the elderly.27 Our present study identified that the prevalence of fatty liver and liver enzymes including ALT, ALP, γ-GT and cholinesterase were increased significantly with high insulin resistance and low insulin sensitivity in elderly patients with recently diagnosed type 2 DM. But this study revealed that fatty liver and liver enzymes were not independently associated with type 2 DM in the elderly.
The major limitation of the present study is that the data were obtained retrospectively in a cross-sectional study by reviewing the patients’ medical records. The confounding factors arising from the study setting, population selection, use of medications, exercise and dietary habits could not be completely excluded. The number of type 2 DM patients among the elderly was quite limited. Although a previous study reported the association of higher BMI with prediabetes,28 our study did not support this conclusion. Therefore, large prospective study settings would be needed to confirm these findings.
Conclusion
Higher BMI was associated with increased insulin resistance and decreased insulin sensitivity in the elderly with type 2 DM.
Acknowledgments
This study was supported by the grants from National Key Clinical Specialties Construction Program of China (No [2013]544), the medical science and technology research fund of Health Bureau of Chongqing City, China (No 04-2-154 and No 2009-2-290) and the natural science research fund of Chongqing Science and Technology Commission in Chongqing City, China (CSTC, No 2007BB5276).
Footnotes
Disclosure
The authors report no conflicts of interest in this work.
References
- 1.Zhao Y, Crimmins EM, Hu P, et al. Prevalence, diagnosis, and management of diabetes mellitus among older Chinese: results from the China Health and Retirement Longitudinal Study. Int J Public Health. 2016;61(3):347–356. doi: 10.1007/s00038-015-0780-x. [DOI] [PMC free article] [PubMed] [Google Scholar]
- 2.Shaw JE, Sicree RA, Zimmet PZ. Global estimates of the prevalence of diabetes for 2010 and 2030. Diabetes Res Clin Pract. 2010;87(1):4–14. doi: 10.1016/j.diabres.2009.10.007. [DOI] [PubMed] [Google Scholar]
- 3.Imamura F, Mukamal KJ, Meigs JB, et al. Risk factors for type 2 diabetes mellitus preceded by beta-cell dysfunction, insulin resistance, or both in older adults: the Cardiovascular Health Study. Am J Epidemiol. 2013;177(12):1418–1429. doi: 10.1093/aje/kws440. [DOI] [PMC free article] [PubMed] [Google Scholar]
- 4.Novo S, Balbarini A, Belch JJ, et al. The metabolic syndrome: definition, diagnosis and management. Int Angiol. 2008;27(3):220–231. [PubMed] [Google Scholar]
- 5.Chen LK, Peng LN, Lin MH, et al. Predicting new onset diabetes mellitus in older Taiwanese metabolic syndrome or impaired fasting glucose? J Atheroscler Thromb. 2009;16(5):627–632. doi: 10.5551/jat.794. [DOI] [PubMed] [Google Scholar]
- 6.Maggi S, Noale M, Gallina P, et al. Metabolic syndrome, diabetes, and cardiovascular disease in an elderly Caucasian cohort the Italian Longitudinal Study on Aging. J Gerontol A Biol Sci Med Sci. 2006;61(5):505–510. doi: 10.1093/gerona/61.5.505. [DOI] [PubMed] [Google Scholar]
- 7.Noale M, Maggi S, Zanoni S, et al. The metabolic syndrome, incidence of diabetes and mortality among the elderly: the Italian Longitudinal Study of Ageing. Diabetes Metab. 2012;38(2):135–141. doi: 10.1016/j.diabet.2011.09.005. [DOI] [PubMed] [Google Scholar]
- 8.Tanaka S, Tanaka S, Iimuro S, et al. Body mass index and mortality among Japanese patients with type 2 diabetes: pooled analysis of the Japan diabetes complications study and the Japanese elderly diabetes intervention trial. J Clin Endocrinol Metab. 2014;99(12):E2692–E2696. doi: 10.1210/jc.2014-1855. [DOI] [PubMed] [Google Scholar]
- 9.Tobias DK, Pan A, Jackson CL, et al. Body-mass index and mortality among adults with incident type 2 diabetes. N Engl J Med. 2014;370(3):233–244. doi: 10.1056/NEJMoa1304501. [DOI] [PMC free article] [PubMed] [Google Scholar]
- 10.Olafsdottir E, Aspelund T, Sigurdsson G, et al. Unfavourable risk factors for type 2 diabetes mellitus are already apparent more than a decade before onset in a population-based study of older persons: from the Age, Gene/Environment Susceptibility-Reykjavik Study (AGES-Reykjavik) Eur J Epidemiol. 2009;24(6):307–314. doi: 10.1007/s10654-009-9343-x. [DOI] [PMC free article] [PubMed] [Google Scholar]
- 11.Weiss A, Boaz M, Beloosesky Y, et al. Body mass index and risk of all-cause and cardiovascular mortality in hospitalized elderly patients with diabetes mellitus. Diabet Med. 2009;26(3):253–259. doi: 10.1111/j.1464-5491.2009.02672.x. [DOI] [PubMed] [Google Scholar]
- 12.Puavilai G, Chanprasertyotin S, Sriphrapradaeng A. Diagnostic criteria for diabetes mellitus and other categories of glucose intolerance: 1997 criteria by the Expert Committee on the Diagnosis and Classification of Diabetes Mellitus (ADA), 1998 WHO consultation criteria, and 1985 WHO criteria. World Health Organization. Diabetes Res Clin Pract. 1999;44(1):21–26. doi: 10.1016/s0168-8227(99)00008-x. [DOI] [PubMed] [Google Scholar]
- 13.Matthews DR, Hosker JP, Rudenski AS, et al. Homeostasis model assessment: insulin resistance and beta-cell function from fasting plasma glucose and insulin concentrations in man. Diabetologia. 1985;28(7):412–419. doi: 10.1007/BF00280883. [DOI] [PubMed] [Google Scholar]
- 14.Chen H, Sullivan G, Quon MJ. Assessing the predictive accuracy of QUICKI as a surrogate index for insulin sensitivity using a calibration model. Diabetes. 2005;54(7):1914–1925. doi: 10.2337/diabetes.54.7.1914. [DOI] [PubMed] [Google Scholar]
- 15.Katz A, Nambi SS, Mather K, et al. Quantitative insulin sensitivity check index: a simple, accurate method for assessing insulin sensitivity in humans. J Clin Endocrinol Metab. 2000;85(7):2402–2410. doi: 10.1210/jcem.85.7.6661. [DOI] [PubMed] [Google Scholar]
- 16.Gutt M, Davis CL, Spitzer SB, et al. Validation of the insulin sensitivity index (ISI(0,120)): comparison with other measures. Diabetes Res Clin Pract. 2000;47(3):177–184. doi: 10.1016/s0168-8227(99)00116-3. [DOI] [PubMed] [Google Scholar]
- 17.Levey AS, Stevens LA, Schmid CH, et al. A new equation to estimate glomerular filtration rate. Ann Intern Med. 2009;150(9):604–612. doi: 10.7326/0003-4819-150-9-200905050-00006. [DOI] [PMC free article] [PubMed] [Google Scholar]
- 18.Lin SC, Heba E, Wolfson T, et al. Noninvasive diagnosis of nonalcoholic fatty liver disease and quantification of liver fat using a new quantitative ultrasound technique. Clin Gastroenterol Hepatol. 2015;13(7):1337–1345. e1336. doi: 10.1016/j.cgh.2014.11.027. [DOI] [PMC free article] [PubMed] [Google Scholar]
- 19.Noale M, Maggi S, Marzari C, et al. Components of the metabolic syndrome and incidence of diabetes in elderly Italians: the Italian Longitudinal Study on Aging. Atherosclerosis. 2006;187(2):385–392. doi: 10.1016/j.atherosclerosis.2005.09.018. [DOI] [PubMed] [Google Scholar]
- 20.Nagaya T, Yoshida H, Takahashi H, et al. Increases in body mass index, even within non-obese levels, raise the risk for type 2 diabetes mellitus: a follow-up study in a Japanese population. Diabet Med. 2005;22(8):1107–1111. doi: 10.1111/j.1464-5491.2005.01602.x. [DOI] [PubMed] [Google Scholar]
- 21.Carnethon MR, Yan L, Greenland P, et al. Resting heart rate in middle age and diabetes development in older age. Diabetes Care. 2008;31(2):335–339. doi: 10.2337/dc07-0874. [DOI] [PubMed] [Google Scholar]
- 22.Emdin CA, Anderson SG, Woodward M, et al. Usual blood pressure and risk of new-onset diabetes: evidence from 4.1 million adults and a meta-analysis of prospective studies. J Am Coll Cardiol. 2015;66(14):1552–1562. doi: 10.1016/j.jacc.2015.07.059. [DOI] [PMC free article] [PubMed] [Google Scholar]
- 23.Ley SH, Harris SB, Connelly PW, et al. Association of apolipoprotein B with incident type 2 diabetes in an aboriginal Canadian population. Clin Chem. 2010;56(4):666–670. doi: 10.1373/clinchem.2009.136994. [DOI] [PMC free article] [PubMed] [Google Scholar]
- 24.Beshara A, Cohen E, Goldberg E, et al. Triglyceride levels and risk of type 2 diabetes mellitus: a longitudinal large study. J Investig Med. 2016;64(2):383–387. doi: 10.1136/jim-2015-000025. [DOI] [PubMed] [Google Scholar]
- 25.Vega GL, Barlow CE, Grundy SM, et al. Triglyceride-to-high-density-lipoprotein-cholesterol ratio is an index of heart disease mortality and of incidence of type 2 diabetes mellitus in men. J Investig Med. 2014;62(2):345–349. doi: 10.2310/JIM.0000000000000044. [DOI] [PubMed] [Google Scholar]
- 26.Wang W, Liu J, Sun JY, et al. The association between the changes in triglyceride levels and the risk of incident type 2 diabetes mellitus a 15 years followed-up results from the Chinese Multi-provincial Cohort Study. Zhonghua Nei Ke Za Zhi. 2012;51(7):516–519. [PubMed] [Google Scholar]
- 27.Wannamethee SG, Shaper AG, Lennon L, et al. Hepatic enzymes, the metabolic syndrome, and the risk of type 2 diabetes in older men. Diabetes Care. 2005;28(12):2913–2918. doi: 10.2337/diacare.28.12.2913. [DOI] [PubMed] [Google Scholar]
- 28.Serlachius A, Elovainio M, Juonala M, et al. The association between social support, body mass index and increased risk of prediabetes: the Cardiovascular Risk in Young Finns Study. Int J Behav Med. 2016 doi: 10.1007/s12529-016-9597-0. Epub 2016 Oct 3. [DOI] [PubMed] [Google Scholar]