Significance
The sounds we encounter in everyday life (e.g. speech, voices, animal cries, wind, rain) are complex and various. How the human brain analyses their acoustics remains largely unknown. This research shows that mathematical modelling in combination with high spatial resolution functional magnetic resonance imaging enables reverse engineering of the human brain computations underlying real-life listening. Importantly, the research reveals that even general auditory processing mechanisms in the human brain are optimized for fine-grained analysis of the most behaviorally relevant sounds (i.e., speech, voices). Most likely, this observation reflects the evolutionary feat that, for humans, discriminating between speech sounds is more crucial than distinguishing, for example, between barking dogs.
Keywords: auditory cortex, functional MRI, natural sounds, model-based decoding, spectrotemporal modulations
Abstract
Ethological views of brain functioning suggest that sound representations and computations in the auditory neural system are optimized finely to process and discriminate behaviorally relevant acoustic features and sounds (e.g., spectrotemporal modulations in the songs of zebra finches). Here, we show that modeling of neural sound representations in terms of frequency-specific spectrotemporal modulations enables accurate and specific reconstruction of real-life sounds from high-resolution functional magnetic resonance imaging (fMRI) response patterns in the human auditory cortex. Region-based analyses indicated that response patterns in separate portions of the auditory cortex are informative of distinctive sets of spectrotemporal modulations. Most relevantly, results revealed that in early auditory regions, and progressively more in surrounding regions, temporal modulations in a range relevant for speech analysis (∼2–4 Hz) were reconstructed more faithfully than other temporal modulations. In early auditory regions, this effect was frequency-dependent and only present for lower frequencies (<∼2 kHz), whereas for higher frequencies, reconstruction accuracy was higher for faster temporal modulations. Further analyses suggested that auditory cortical processing optimized for the fine-grained discrimination of speech and vocal sounds underlies this enhanced reconstruction accuracy. In sum, the present study introduces an approach to embed models of neural sound representations in the analysis of fMRI response patterns. Furthermore, it reveals that, in the human brain, even general purpose and fundamental neural processing mechanisms are shaped by the physical features of real-world stimuli that are most relevant for behavior (i.e., speech, voice).
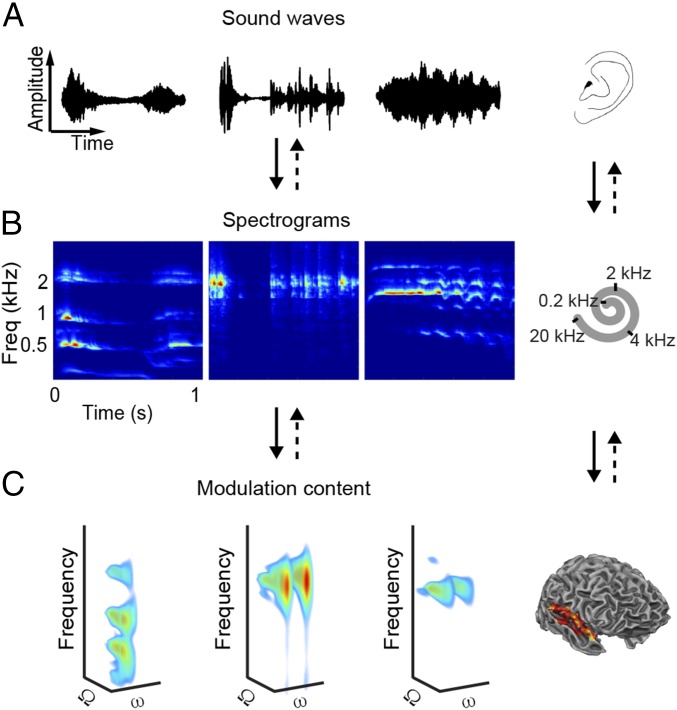
Many natural and man-made sources in our environment produce acoustic waveforms (sounds) consisting of complex mixtures of multiple frequencies (Fig. 1A). At the cochlea, these waveforms are decomposed into frequency-specific temporal patterns of neural signals, typically described with auditory spectrograms (Fig. 1B). How complex sounds are further transformed and analyzed along the auditory neural pathway and in the cortex remains uncertain. Ethological considerations have led to the hypothesis that brain processing of sounds is optimized for spectrotemporal modulations, which are characteristically present in ecologically relevant sounds (1), such as in animal vocalizations [e.g., zebra finch (2), macaque monkeys (3)] and speech (2, 4–7). Modulations are regular variations of energy in time, in frequency, or in time and frequency simultaneously. Typically, in natural sounds, modulations dynamically change over time. The contribution of modulations to sound spectrograms can be made explicit using 4D (time-varying; Movies S1–S3, Left) or 3D (time-averaged; Fig. 1C) representations. Such representations highlight, for example, that the energy of human vocal sounds is mostly concentrated at lower frequencies and at lower temporal modulation rates (Fig. 1C, Left), whereas the whinny of a horse contains energy at higher frequencies and at higher temporal modulations (Fig. 1C, Right).
Fig. 1.
Schematic of reconstruction procedure. Sounds enter a listener’s ear as waveforms of acoustic energy (A) and are converted into spectrograms (B) at the cochlea. Freq, frequency. (C) Sound representations in the auditory cortex are modeled as 4D functions of frequency, spectral modulation (Ω), temporal modulation (ω), and time. Note that C shows the time-averaged representations of the sounds in A and B (time-resolved representations are illustrated in Movies S1–S3). Sounds are examples of human vocal (Left, “male vocalization”), tool (Center, “typewriter”), and animal (Right, “horse”) sounds. The fMRI activation patterns are used to decode each feature (Ω, ω, frequency, time) of the 4D representation, which is then inverted (dashed arrows) to obtain the corresponding spectrogram and waveform.
Electrophysiological investigations in several animal species have reported single neurons tuned to specific spectrotemporal modulations at various stages of the auditory pathway [e.g., inferior colliculus (8), auditory thalamus (9)] and in the primary auditory cortex (10, 11). Intracranial electrocorticography (ECoG) recordings (12, 13) as well as noninvasive functional neuroimaging studies (14, 15) suggest that similar mechanisms are also in place in the human auditory cortex.
In the present study, we tested the hypothesis that the human auditory cortex entails modulation-based sound representations by combining real-life sound stimuli, high spatial resolution (7 Tesla) functional magnetic resonance imaging (fMRI), and the analytical approach of model-based decoding (16–20). Unlike the more common classification-based decoding, which only allows discriminating between a small set of stimulus categories, this approach embeds a representational model of the stimuli in terms of elementary features, thereby enabling the identification of individual arbitrary stimuli from brain response patterns (18, 19).
Specifically, we modeled the cortical processing of real-life sounds as the combined output of frequency-localized neural filters tuned to specific combinations of spectral and temporal modulations (14, 21). We then used this sound representation model in two sets of fMRI data analysis. In a first set of analyses, conducted at the level of the whole auditory cortex, we trained a pattern-based decoder independently for each model feature (i.e., for each unique combination of frequency, spectral modulation, and temporal modulation). We then asked whether the combination of these feature-specific decoders would enable reconstruction of the acoustic content of hold-out sets of sounds from fMRI response patterns. Supporting the hypothesis embedded in our model, obtained reconstructions were significantly accurate and specific. Most surprisingly, despite the inherent loss of temporal information due to the sluggish hemodynamics and poor temporal sampling of the blood oxygen level-dependent (BOLD) response, fMRI-based reconstructions presented a temporal specificity of about 200 ms. In a second set of analyses, we considered the contribution of different auditory cortical regions separately and characterized each region by the accuracy of the fMRI-based reconstruction for each feature of the sound representation model, which we refer to as modulation transfer function (MTF). A detailed comparison of these regional MTFs revealed relevant insights into the processing of acoustic information in primary and nonprimary auditory cortical regions. Most interestingly, our results suggested that even in primary regions, sound representations and processing are optimized for the fine-grained discrimination of human speech (and vocal) sounds.
Results
Sound Reconstruction from fMRI Activity Patterns.
We recorded 7-T fMRI responses from the auditory cortex while subjects listened to a large set of real-life sounds, including speech and vocal samples, music pieces, animal cries, scenes from nature, and tool sounds [experiment 1: n1 = 5 (14, 22), experiment 2: n2 = 5]. As a first step of the model-based decoding analysis, we calculated the time-varying spectrotemporal modulation content of all our stimuli (e.g., Movies S1–S3, Left). Then, per subject, we estimated a linear decoder for each feature of this modulation representation. This estimation was done using a subset of sounds and corresponding fMRI responses (training) and resulted in a map of voxels’ contributions for each feature (Ci in Eq. S1). We then tested whether the combination of estimated feature-specific decoders could be used to reconstruct the time-varying spectrotemporal modulations of novel (“test”) sounds based on the measured fMRI responses to those testing sounds. We refer to this operation as modulation-based reconstruction (SI Materials and Methods). We verified the quality of obtained sound reconstructions by means of several statistical analyses.
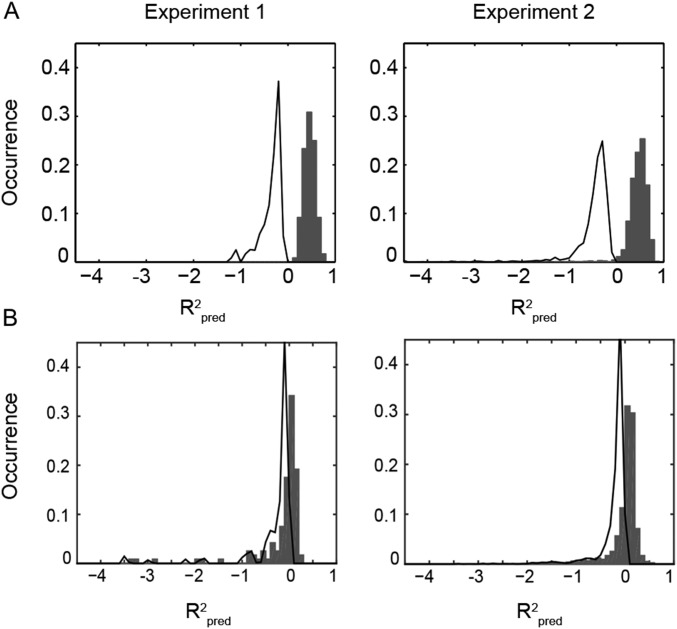
First, we assessed the accuracy of the sounds’ reconstructed modulation content using the coefficient of determination () (Eq. S3). For each sound, is greater than 0 if the reconstructed modulation representation predicts the actual representation better than the mean of that sound. In both experiments, was significantly higher than 0 (Fig. S1A; experiment 1: median [interquartile range (IQR)] = 0.37 [0.36 0.47], P < 0.05; experiment 2: IQR = 0.44 [0.42 0.45], P < 0.05). (Unless differently indicated, statistical comparisons are based on random effects, group-level, one-tailed Wilcoxon signed-rank tests.) Conversely, a reconstruction model based on a time-frequency representation of the stimuli yielded poorer reconstruction accuracy, with distributions largely overlapping or only marginally shifted with respect to the null distribution [experiment 1: −0.05 [−0.06 0.01], not significant (n.s.); experiment 2: 0.02 [0.01 0.03], P < 0.05; Fig. S1B]. These results suggest that the modulation representation is crucial for the decoding of complex sounds from fMRI activity patterns.
Fig. S1.
Distribution of across all test sounds and all subjects for the reconstruction based on the modulation (A) and on the time-frequency representation (B). Gray bars represent the histogram of observed values, and the black line outlines the distribution of obtained by randomly permuting the feature labels of the reconstructed sounds. Experiment 1 (Left) and experiment 2 (Right) are shown (statistics are provided in main text).
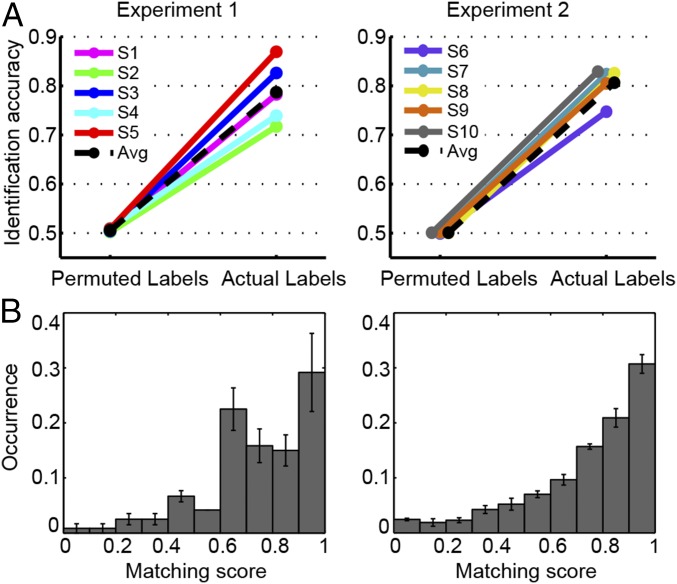
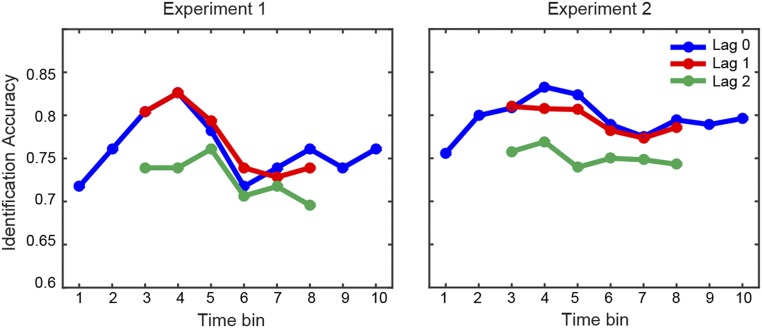
Second, we assessed the specificity of the reconstructed modulation representations by examining to what extent the fMRI-based predictions enabled identifying a given sound among all testing sounds in the test set (SI Materials and Methods). Identification accuracy was significantly above chance (0.5) for both datasets on a group level (experiment 1: 0.78 [0.73 0.84], P < 0.05; experiment 2: 0.82 [0.79 0.83], P < 0.05) and on a single-subject level (for each subject: P < 0.01, one-tailed permutation test; Fig. 2A and B). Notably, in about 30% of cases, the identification scores were in the range of 0.9–1.0 (Fig. 2B), indicating that the fine-grained, within-category distinction between sounds contributed relevantly to the median score. Finally, because our modulation-based sound representations were based on a temporal subdivision of the sounds in 10 time windows, we further examined the temporal specificity of our fMRI-based reconstructions. We calculated separately for each time window (100 ms) the identification accuracy score using fMRI-based predictions corresponding to the same time window of the actual sound features (lag = 0; blue lines in Fig. S2) or to time windows at a distance of 1 (lag = 1; red lines in Fig. S2) or 2 (lag = 2; green lines in Fig. S2). Identification accuracy for lag = 0 did not differ significantly from the identification accuracy obtained for lag = 1 (experiment 1: n.s., experiment 2: n.s.), but it was significantly greater than the identification accuracy at lag = 2 (experiment 1: P < 0.05, experiment 2: P < 0.0001, random effects Friedman test with lag and subject as factors). This analysis suggests a temporal specificity of at least two time bins (i.e., 200 ms) for the obtained fMRI-based predictions.
Fig. 2.
Identification results. (A) Identification accuracy for individual participants. Each panel shows the accuracy obtained with correct labels and the accuracy derived by permuting the sound labels. (B) Average distribution of matching scores across subjects for the modulation-based reconstruction (mean ± SEM, n = 5, for the two experiments separately). These matching scores are used to calculate the identification accuracy. Avg, average.
Fig. S2.
Temporal specificity of modulation-based reconstructions. Identification accuracy (median across subjects), as obtained for each separate time window in experiment 1 (Left) and experiment 2 (Right), is shown. The blue, red, and green lines indicate, respectively, the identification accuracy calculated using actual sound features for time bin i and fMRI-based predictions for time bin i (lag = 0, blue), i ± 1 (lag = 1, red), and i ± 2 (lag = 2, green) bins. Identification accuracy was significantly above chance for each time window in both datasets (P < 0.05, group-level one-tailed Wilcoxon signed-rank test), with a trend toward larger values for the central time bins. The identification accuracy for lag = 0 predictions did not differ significantly from the identification accuracy for lag = 1 predictions, but was significantly higher than the identification accuracy for lag = 2 predictions (experiment 1: P = 0.02, experiment 2: P < 0.0001, random effects group analysis, Friedman test with lag and subject as factors). Each time bin corresponds to 100 ms.
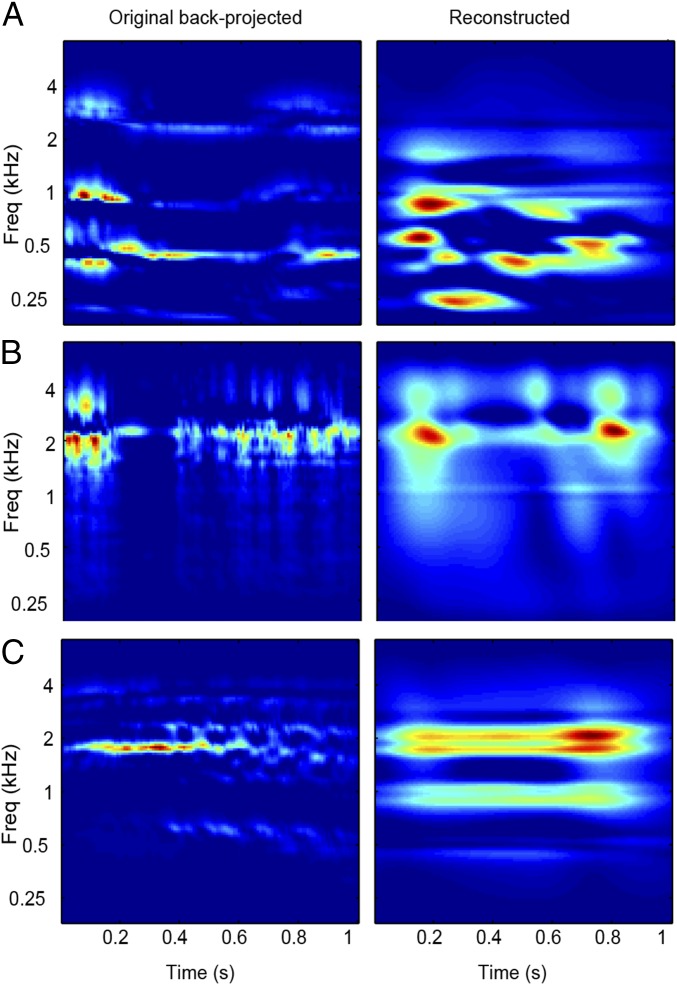
To obtain an intuitive understanding of these results, we reconstructed spectrograms from the fMRI-derived modulation representations (Movies S1–S3, Right) and resynthesized the corresponding waveforms (SI Materials and Methods). As illustrated in Fig. 3 A–C, we could recover “temporally smooth” versions of the original spectrograms. In line with these results, resynthesized waveforms enabled the recognition of the original sound sources (Audio File S1, “bird” reconstruction) in some cases, but lacked the fine temporal details required, for example, for speech comprehension (Audio File S2, “speech”). A formal statistical analysis showed that recovery specificity for spectrograms was significantly above chance (0.5) (experiment 1: 0.65 [0.33 0.91], P < 0.05; experiment 2: 0.75 [0.43 0.90], P < 0.05).
Fig. 3.
Examples of reconstructed spectrograms. Reconstructed spectrograms for vocal (A), tool (B), and animal (C) sounds. The original spectrograms are depicted in Fig. 1. (Left) Reference spectrograms obtained by inverting the down-sampled (10 time bins) magnitude-only modulation representation of the original sounds (SI Materials and Methods). (Right) Sound spectrogram as reconstructed from the fMRI-based predictions (also Movies S1–S3).
Region of Interest Analysis of Spectral and Temporal Information Content.
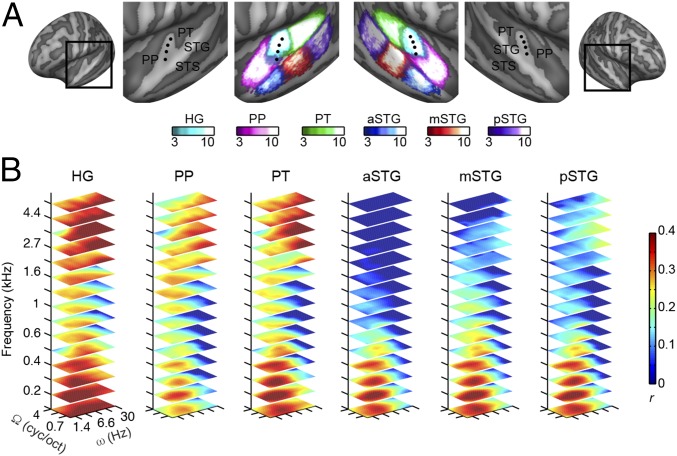
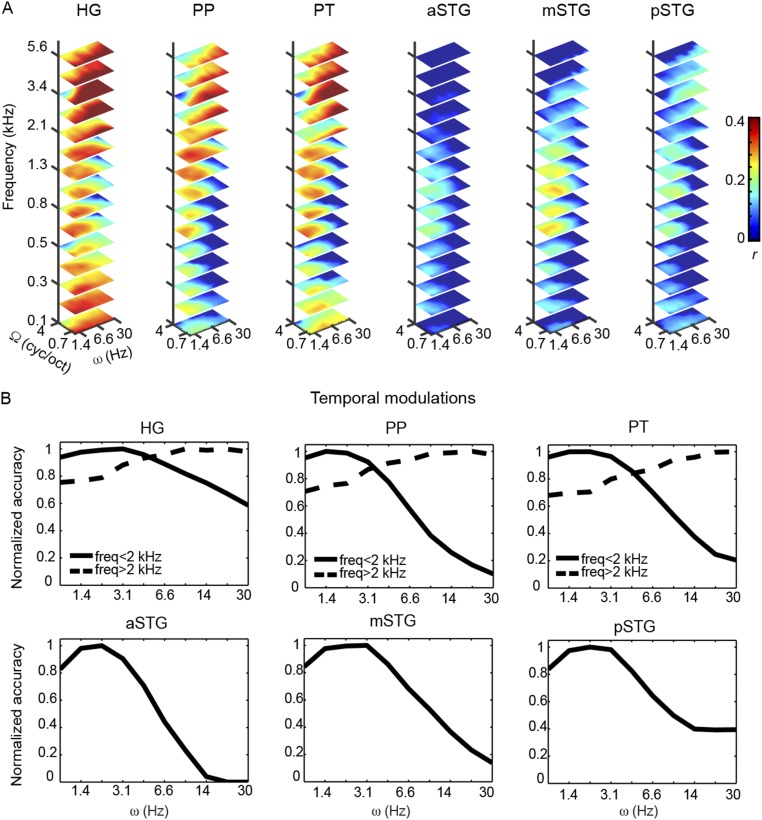
Having established that the modulation-based model enables sufficiently accurate and specific sound reconstructions, we investigated how the decoding of the spectrotemporal modulation content varies throughout auditory cortical regions. We compared reconstruction performance of six anatomical regions of interest (ROIs): Heschl’s gyrus (HG), planum polare (PP), planum temporale (PT), anterior superior temporal gyrus (aSTG), middle STG (mSTG), and posterior STG (pSTG) (Fig. 4A and SI Materials and Methods). For each subject and ROI, we estimated the multivoxel decoders and quantified, per each feature, the reconstruction accuracy as Pearson’s correlation coefficient (r) between predicted and actual feature values in all sounds of the test set. This procedure resulted in an MTF per ROI (Fig. 4B), with corresponding marginal frequency (f), spectral modulation (Ω), and temporal modulation (ω) profiles (Fig. 5). These MTFs were assessed statistically and thresholded (P < 0.05, corrected for multiple comparisons; SI Materials and Methods), and thereby provide an objective measure of what information about each feature of the model is available in the ROI’s response patterns.
Fig. 4.
MTFs of individual ROIs. (A) Inflated representation of the group cortical surface mesh. ROIs are shown with different colors scaled to indicate the overlap of defined regions across subjects. The black dots indicate the HG. (B) Each slice represents the MTF at a given frequency value (only 15 frequencies are shown). The color code indicates the group-averaged Pearson’s r between reconstructed and original features. Features with a nonsignificant r are depicted in dark blue. The average MTF across hemispheres is shown. MTFs have been interpolated for display purposes. cyc/oct, cycles per octave.
Fig. 5.
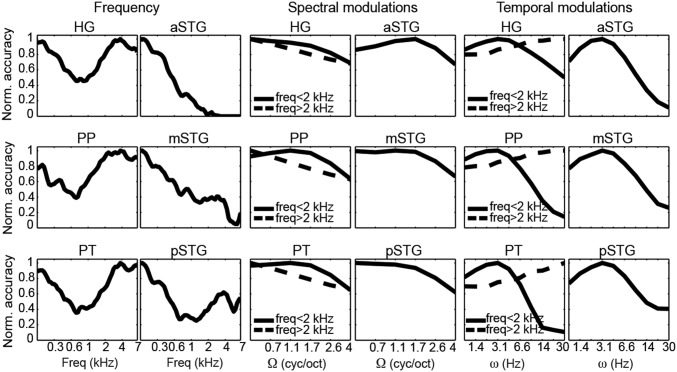
ROI-based marginal profiles for frequency, spectral modulation, and temporal modulation. Each profile was obtained by averaging the MTFs along the other two dimensions and normalized (Norm.) by its maximum value. Based on the visual inspection of the full MTF (Fig. 4B) for the HG, PP, and PT, we computed distinct marginal tuning functions for frequencies below and above <2 kHz.
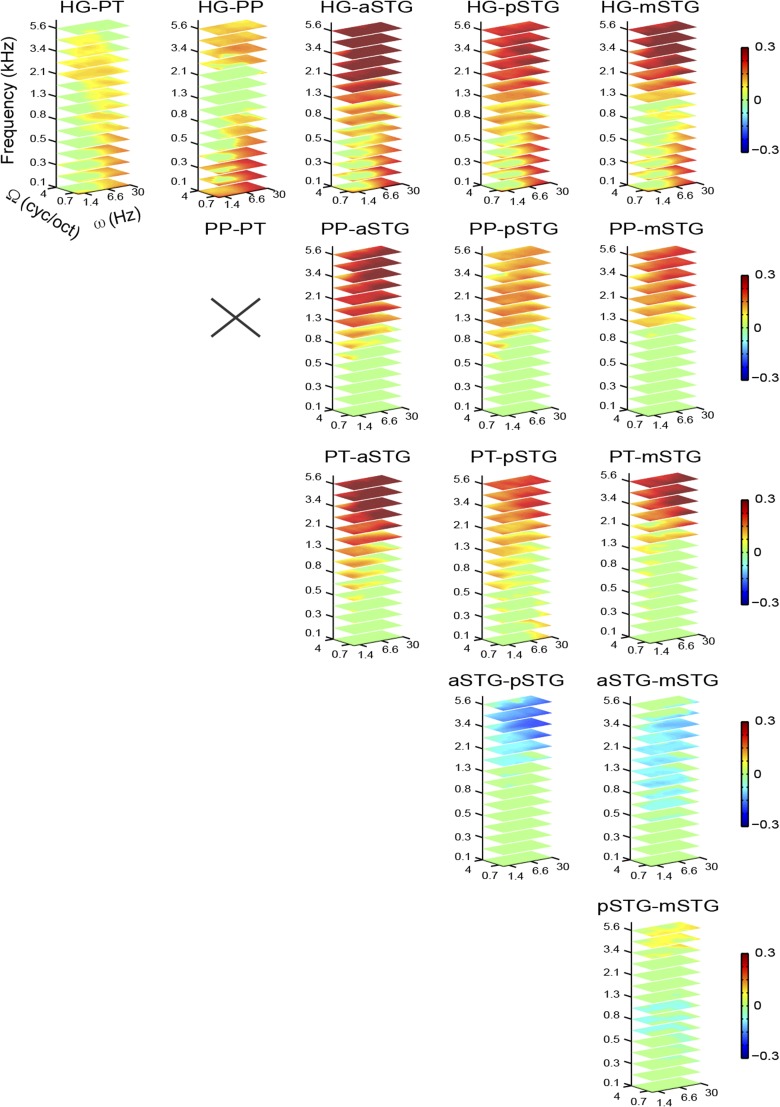
Results indicated that in the HG, PP, and PT, a broader range of acoustic features can be decoded compared with STG regions (Fig. 4B; detailed pairwise comparisons between ROIs are shown in Fig. S3). The reconstruction accuracy profile for frequency was highest at around 0.8 kHz for the HG, PT, and PP and at lower frequencies for the aSTG, mSTG, and pSTG (Fig. 5). For the HG, PT, and PP, reconstruction accuracy for frequencies above 2 kHz and below 0.5 kHz was significantly higher than in the frequency range between 0.5 and 2 kHz (Bonferroni-adjusted P < 0.001). Note that this behavior for frequency was not present in the stimuli (Fig. S4 A and B) and might be related to direct and indirect effects of the scanner noise (Discussion and Fig. S5). For the aSTG, mSTG, and pSTG, the reconstruction accuracy below 0.6 kHz was significantly greater than at higher frequencies (Bonferroni-adjusted P < 0.001). In all ROIs, the reconstruction accuracy profile for spectral modulations was highest for lower modulations (with a steeper slope at higher frequencies in the HG, PT, and PT; Fig. 5), with reconstruction accuracies at the lowest spectral modulations [0.5 cycles per octave (cyc/oct)] significantly higher than at four cyc/oct (Bonferroni-adjusted P < 0.001). Thus, there was not a preferred range of spectral modulations, because brain responses followed the spectral modulation content of the stimuli (Fig. S4). Conversely, in all regions, the temporal modulation profile was highest for a range centered at ∼3 Hz (Fig. 5). Reconstruction accuracy at 3.1 Hz was significantly higher than at 1 Hz and 9.7 Hz for the aSTG, mSTG, and pSTG (Bonferroni-adjusted P < 0.001). Visual inspection of the MTFs (Fig. 4B) indicated that for the HG, PP, and PT, this effect was only observed in the frequency range below 2 kHz. Formal statistical testing confirmed this observation (Bonferroni-adjusted P < 0.001). Instead, at frequencies above 2 kHz, reconstruction accuracy of temporal modulations for HG, PP, and PT was higher at 30 Hz than at 1 Hz (Bonferroni-adjusted P < 0.001). This distinctive reconstruction accuracy profile for temporal modulations could not be explained by the overall acoustic properties of the stimuli (Fig. S4).
Fig. S3.
Pairwise comparisons between ROI-based MTFs. In each panel, the color code indicates the group-averaged difference between the MTFs of two ROIs. Features with a nonsignificant difference are assigned a value of 0 and depicted in green. A cross indicates pairs of MTFs that are not significantly different. MTFs have been interpolated for display purposes. Ω, spectral modulation scale; ω, temporal modulation rate.
Fig. S4.
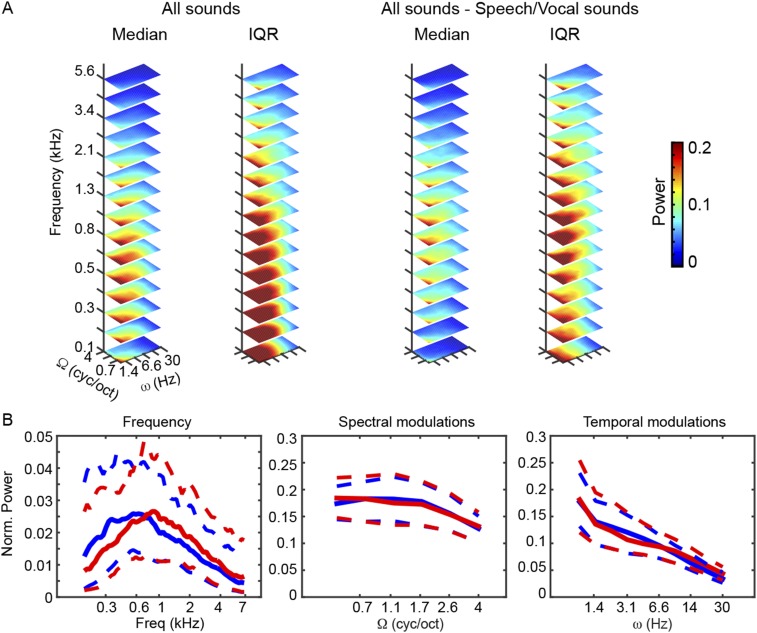
Modulation content of stimuli. (A) Median and IQRs of acoustic energy distribution for the complete stimulus set (Left) and for the reduced stimulus set without speech and vocal sounds (Right). Values are shown using a linear color scale, with the 0 color-coded in black. (B) Marginal profiles of the median energy distribution in A for the complete (blue) and reduced (red) stimulus sets. Dashed lines indicate the corresponding IQR. Freq, frequency, Ω, spectral modulation scale; ω, temporal modulation rate. Removal of speech and vocal sounds largely altered the relative contribution of low and high frequencies to the overall acoustic energy of the stimulus set used for training/testing the decoders (maximum reduction of 45% at f = 209.5 Hz, maximum increase of 46% at f = 6.8 kHz). For temporal and spectral modulations, the consequences on the relative energy distribution were smaller (maximum reduction of 11% at ω = 3.1 Hz, maximum increase of 28% at ω = 30 Hz; maximum reduction of 4% at Ω = 1.1 cyc/oct, maximum increase 6% at Ω = 0.5 cyc/oct). cyc/oct, cycles per octave.
Fig. S5.
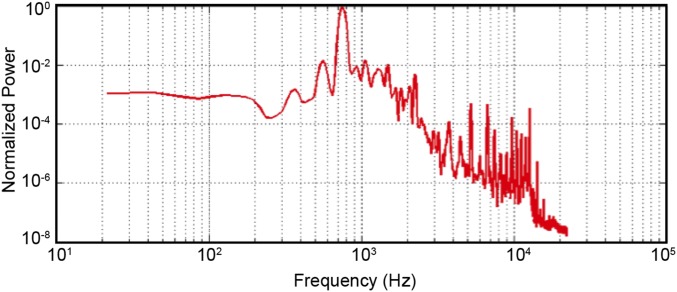
Audio recording of the scanner noise for the echo planar imaging sequence used for the fMRI measurements.
ROI-Based Analysis Without Speech and Vocal Stimuli.
The low temporal modulation rates for which we have obtained the highest reconstruction accuracy are prominently present in speech and vocal sounds, and are relevant for the analysis of syllabic information (23) and for speech intelligibility (6), for example. In many previous studies, processing of speech/voice (24–26) beyond the analysis of acoustic features has been related to stronger fMRI responses relative to other natural and control sounds, especially along the STG (and adjacent superior temporal sulcus). We thus performed a further analysis to control that the enhanced reconstruction accuracy of low temporal rates was not an indirect effect of decoding these global response differences. In this analysis, we removed all speech and vocal sounds from the stimulus set, retrained the decoders, and statistically reassessed the regional MTFs. Removal of speech and vocal sounds largely altered the relative contribution of low and high frequencies to the overall acoustic energy of the stimulus set used for training/testing the decoders, but affected temporal and spectral modulations less (Fig. S4). Fig. S6A shows, for all ROIs, the MTFs obtained with this reduced stimulus set and thresholded as in the previous analysis. The newly identified MTFs resembled the original ones very closely in early auditory regions (Pearson’s r with the original MTFs, 3,600 features: HG = 0.90, PT = 0.83, PP = 0.89) and with larger deviations in STG regions [Pearson’s r, 3,600 features: aSTG = 0.47, mSTG = 0.42, pSTG = 0.48]. In these latter regions, changes were most pronounced at the low frequencies. Importantly, in all ROIs, including early auditory as well as STG regions, the marginal profile for temporal modulation reconstruction accuracy remained unchanged (Fig. S6B), with a peak around 3 Hz (Pearson’s r, over the 10 temporal modulations: HG = 0.99, PT = 0.99, PP = 0.98, aSTG = 0.97, mSTG = 0.97, pSTG = 0.95).
Fig. S6.
ROI-specific MTFs and temporal modulation marginal profiles for the reduced stimulus set (without speech and voice sounds). (A) Three-dimensional reconstruction accuracy MTFs for each ROI. In this graph, each slice represents the MTF at a given frequency value (only 15 frequencies are shown). At each (f, Ω, and ω) location, the color indicates the group-averaged Pearson’s r between reconstructed and original features. Features with a nonsignificant r are depicted in dark blue. The average MTF across hemispheres is shown. MTFs have been interpolated for display purposes. (B) ROI-specific marginal profiles for temporal modulations. Each profile was obtained by averaging the MTFs along the other two dimensions and normalized by its maximum value. Based on the visual inspection of the full MTF in A, for the HG, PP, and PT, we computed distinct marginal tuning functions for frequencies below and above <2 kHz.
Discriminability Analysis.
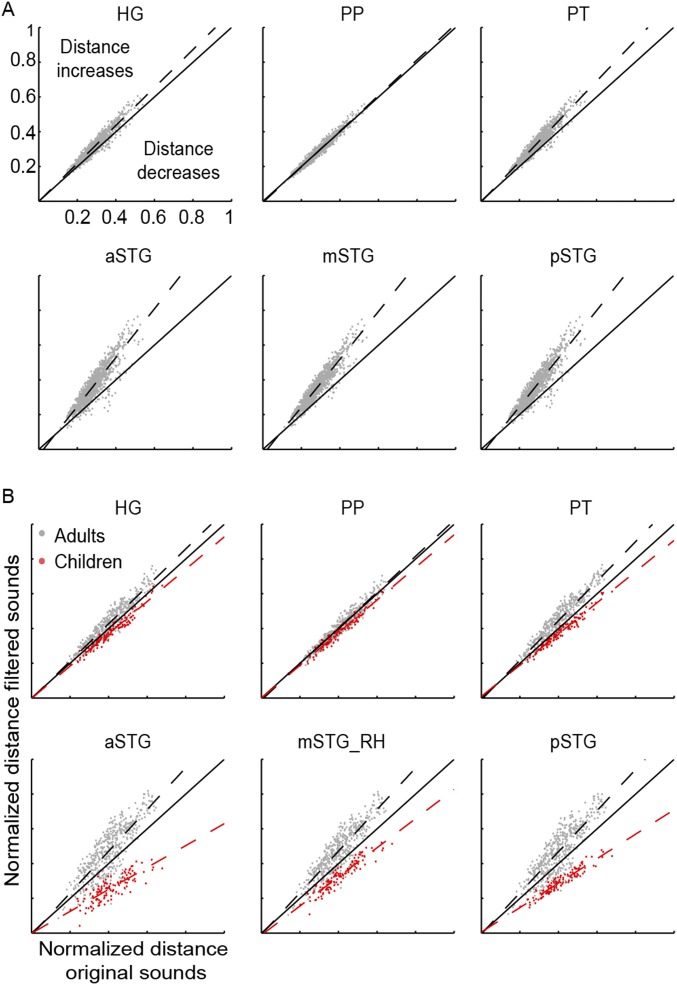
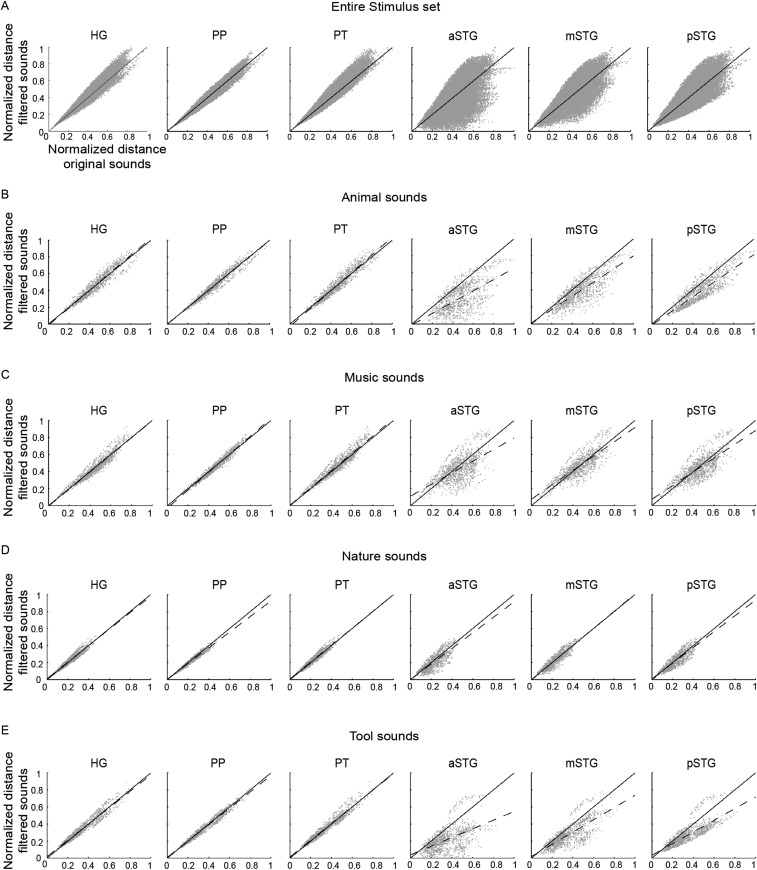
Electrophysiological recordings in zebra finches suggested that spectrotemporal population tuning of auditory neurons maximizes the acoustic distance between sounds, facilitating the animal’s discrimination ability (27, 28). Under the assumption that the reconstructed accuracy of MTFs reflects the weighted distribution of neuronal populations tuned to the corresponding spectrotemporal modulation (SI Discussion), we tested the effects of this ROI-specific processing on sound discriminability. We calculated pairwise distances between sounds based on their original modulation representations as well as on the representations obtained by weighting the original representations based on the ROI-specific reconstruction accuracy of MTFs (Figs. S7 and S8). Comparison of these two sets of pairwise distances across the entire stimulus set exhibited a complex pattern (Fig. S8A). However, a clear pattern emerged when the analysis was restricted to speech sounds (Fig. S7A). In all ROIs, we found a significant linear relationship between the normalized distances of filtered and original speech sounds (slope of the regression line: HG = 1.09, PP = 1.03, PT = 1.16, aSTG = 1.40, mSTG = 1.38, pSTG = 1.38; Bonferroni-adjusted P < 0.001, two-tailed t test). Pairwise distances for all regions fell mainly above the diagonal (slope significantly higher than 1; Bonferroni-adjusted P < 0.001, two-tailed z test), indicating significant amplification of sound distances. The regression line was significantly steeper for the PT than for the HG and for the aSTG, mSTG, and pSTG than for the HG and PT (Bonferroni-adjusted P < 0.001, two-tailed z test). We did not observe similar effects for the other sound categories (Fig. S8 B–E), except for adults’ vocal sounds (Fig. S7B).
Fig. S7.
Discriminability analysis of speech and vocal sounds. For the indicated ROI, each panel shows the relation between pairwise distances of speech (A) and nonspeech vocal (B) sounds based on their original modulation representations (x axis) and on the representations obtained by weighting the original representations based on ROI-specific MTFs (y axis). These latter representations were calculated as the point-wise product between the original modulation content and the group-average reconstruction accuracy MTF of individual ROIs. The normalized distance between sound pairs was defined as the Euclidean distance between sounds in the modulation space, divided by the maximum pairwise distance obtained for the condition of interest (i.e., projected, original). The dashed line is the fitted line, and the solid line represents the diagonal. Points lying on the diagonal designate pairs of sounds whose normalized relative distance does not change after the weighting operation. A shift above (below) the diagonal indicates that the filtering operation increases (decreases) the normalized relative distances between sounds.
Fig. S8.
Discriminability analysis for all other sounds, which is the same as in Fig. S7 for all sounds in the stimulus set (A) and for all distinct sound categories other than speech and vocal sounds (B–E).
SI Materials and Methods
Subjects.
Five healthy subjects who were different for the two experiments participated in experiment 1 (n1 = 5, median age = 32 y, three males) and experiment 2 (n2 = 5, median age = 27 y, two males). Data of experiment 1 have been previously described (14, 22) and are analyzed here using a different analytical approach. Data of experiment 2 have been collected for the present study and have never been reported before. All subjects (experiment 1 and experiment 2) reported no history of a hearing disorder or neurological disease, and gave informed consent before commencement of the measurements.
Experimental Design.
In both experiments, fMRI responses were recorded from the auditory cortex while subjects listened to a large set of real-life sounds (maximum duration of 1 s, sampling frequency of 16 kHz, experiment 1: 168 sounds, experiment 2: 288 sounds). Stimuli included speech samples, vocal sounds, music pieces, animal cries, scenes from nature, and tool sounds. Sound onset and offset were ramped with a 10-ms linear slope, and their energy (rms) levels were equalized.
In experiment 1, data were subdivided into six training runs and two testing runs. In the training runs, 144 of the 168 stimuli were presented with three repetitions overall (i.e., each sound was presented in three of the six training runs). The remaining 24 sounds were presented in the testing runs and repeated three times per run. In experiment 2, stimuli were equally distributed between six semantic categories (48 sounds per category): human nonspeech vocal sounds, speech sounds, animal cries, musical instruments, scenes from nature, and tool sounds. Vocal sounds were equally distributed between male, female, and children’s voices. Speech sounds were evenly divided between male and female speakers. Stimuli were divided into four nonoverlapping sets of 72 sounds each. Grouping was performed randomly under the constraint that all semantic categories would be equally represented in each set. Each subject underwent two scan sessions. During one session, two of the four sets of stimuli were presented. The order of the stimulus sets was counterbalanced across subjects. Each session consisted of six functional runs (∼11 min each). We presented one stimulus set (72 distinct sounds) per run, and every set was presented three times (i.e., three runs per set). Within each run, stimuli were arranged according to a pseudorandom scheme to ensure that all semantic categories would be uniformly distributed throughout the run and that no stimuli of the same category would follow each other. Within each scan session, the stimulus sets were presented in an interleaved fashion. Within each run, stimuli were presented in the silent gap between acquisitions with a randomized interstimulus interval of two, three, or four TRs. Because the TR was 2,600 ms and the acquisition time (TA) was 1,200, the silent gap was TR − TA = 1,400 ms; the sound onset occurred randomly at 50 ms, 200 ms, or 350 ms after the TA. Five “null” trials (i.e., trials where no sound was presented) and five “catch” trials (i.e., trials in which the preceding sound was repeated) were included. In the null trials, a sound that would normally occur in the presentation stream is omitted, causing a temporary interstimulus interval of five to seven TRs. Subjects were instructed to respond with a button press when a sound was repeated. This incidental one-back task ensured that participants remained alert and focused on the stimuli. Catch trials were excluded from the analysis.
MRI Parameters.
MRI data for experiment 1 were acquired on the 7-T scanner at the Center for Magnetic Resonance Research (University of Minnesota) using a head radiofrequency (RF) coil (single transmit, 16 receive channels). MRI data for experiment 2 were acquired on the 7-T scanner (Siemens) at Scannexus (www.scannexus.nl) using a head RF coil (single transmit, 32 receive channels). Anatomical T1-weighted images were acquired using a modified magnetization prepared rapid acquisition gradient echo (MPRAGE) sequence [experiment 1: TR = 2,500 ms, inversion time (TI) = 1,500 ms, flip angle = 4°, voxel size = 1 × 1 × 1 mm3; experiment 2: TR = 3,100 ms, TI = 1,500 ms, flip angle = 5°, voxel size = 0.6 × 0.6 × 0.6 mm3]. In experiment 1, proton density (PD)-weighted images were acquired, together with the T1-weighted images (both acquisitions are interleaved in the modified MPRAGE sequence). In experiment 2, PD images were acquired separately (TR = 1,440 ms, voxel size = 0.6 × 0.6 × 0.6 mm3). The PD-weighted images were used to minimize inhomogeneities in T1-weighted images (51). Acquisition time for anatomy was ∼7 min in experiment 1 and ∼10 min in experiment 2. T2*-weighted functional data were acquired using a clustered echo planar imaging sequence in which time gaps were placed after the acquisition of each volume. The fMRI time series were acquired according to a fast event-related scheme, with the following acquisition parameters: experiment 1: TR = 2,600 ms, TA = 1,200 ms, echo time (TE) = 15 ms, generalized autocalibrating partially parallel acquisitions (GRAPPA) = 3, partial Fourier = 6/8, flip angle = 90°, voxel size = 1.5 × 1.5 × 1.5 mm3, 31 slices (no gap); experiment 2: TR = 2,600 ms, TA = 1,200 ms, TE = 19 ms, GRAPPA = 2, partial Fourier = 6/8, flip angle = 70°, voxel size = 1.5 × 1.5 × 1.5 mm3. The numbers of slices were 31 and 46 for experiments 1 and 2, respectively. There was no gap between slices, and the acquisition volume covered the brain transversally from the inferior portion of the anterior temporal pole to the superior portion of the STG bilaterally. For both experiments, there was a silent gap of 1.4 s between subsequent acquisitions during which the sounds were presented. Sounds were delivered binaurally through fMRI-compatible earphones (Sensimetrics Corporation). The sounds were filtered to correct for the S14 frequency response. The sampling rate and bit resolution for presentation were 44.1 kHz and 16 bit, respectively, and the approximate sound level (adjusted at an individual level to ensure subject comfort) was 60–70 dB sound pressure level.
Data Preprocessing.
Functional and anatomical data were preprocessed with BrainVoyager QX (Brain Innovations). Preprocessing consisted of temporal high-pass filtering (removing drifts of seven cycles or less per run) and 3D motion correction (trilinear/sinc interpolation). No spatial smoothing was applied. For experiment 2, anatomical data from the two scan sessions were aligned using the automatic alignment in BrainVoyager QX. Functional slices were coregistered to the anatomical data and normalized in Talairach space. Normalized functional data were resampled (sinc interpolation) to 1-mm isotropic resolution. The border between gray and white matter was segmented from anatomical volumes and used to generate cortical surface meshes of the individual subjects. We performed cortex-based alignment (52) of all 10 subjects included in this study. Alignment information was used to obtain a group surface mesh representation and to compute the overlap of ROIs across subjects (Fig. 4A).
Modulation Representation.
The modulation content of the stimuli was computed using a biologically inspired model of auditory processing (21). The auditory model consists of two main components: an early stage that accounts for the transformations that acoustic signals undergo from the cochlea to the midbrain and a cortical stage that simulates the processing of the acoustic input at the level of the (primary) auditory cortex. We derived the auditory spectrogram and its modulation content using the “NSL Tools” package (available at www.isr.umd.edu/Labs/NSL/Software.htm) and customized MATLAB code (The MathWorks, Inc.). Sounds’ spectrograms were generated using a bank of 128 overlapping bandpass filters with constant Q (Q10dB = 3), equally spaced along a logarithmic frequency axis over a range of 5.3 octaves (f = 180–7,040 Hz). The output of the filter bank underwent bandpass filtering (hair cell stage), first-order derivative with respect to the frequency axis, half-wave rectification, and short-term temporal integration with time constant τ = 8 ms (midbrain stage). The modulation content of the auditory spectrogram was computed through a bank of 2D modulation-selective filters, which perform a complex wavelet decomposition of the auditory spectrogram. The magnitude of such decomposition yields a phase-invariant measure of modulation content. The modulation-selective filters have joint selectivity for spectral and temporal modulations, have a constant Q (Q3dB = 1.8 for temporal modulation filters, Q3dB = 1.2 for spectral modulation filters), and are directional (i.e., they respond either to upward or downward frequency sweeps). Filters were tuned to six spectral modulation frequencies [Ω = (0.5, 0.7, 1.1, 1.7, 2.6, 4) cyc/oct] and 10 temporal modulation frequencies [ω = (1, 1.4, 2.1, 3.1, 4.5, 6.6, 9.7, 14, 20.6, 30) Hz] (also SI Discussion). For the reconstruction analysis, we reduced the modulation representation by defining 10 nonoverlapping time bins and averaging the modulation energy within each of these bins over time. This procedure resulted in a representation with six spectral modulation frequencies × 20 temporal modulation frequencies (10 upward and 10 downward) × 10 time bins × 128 frequencies = 153,600 features.
For the ROI analysis, to reduce the overall computational time, we averaged the modulation representation over time bins and across the upward and downward filter directions. Then, we divided the tonotopic axis into 60 ranges with constant bandwidth in octaves and averaged the modulation energy within each of these regions. This procedure resulted in a representation with six spectral modulation frequencies × 10 temporal modulation frequencies × 60 frequencies = 3,600 features. The processing steps described above were applied to all stimuli, resulting in a [N × F] feature matrix S of modulation energy, where N is the number of sounds and F is the number of features in the reduced modulation representation.
Time-Frequency Representation.
In addition to the modulation model, we trained a reconstruction model based on a time-frequency (i.e., spectrogram) representation of the stimuli that describes the time-varying energy content at each acoustic frequency. The stimulus representation in the time-frequency space was obtained using only the input stage of the auditory model. First, we computed the spectrogram at 128 logarithmically spaced frequency values (f = 180–7,040 Hz). Then, we defined 10 nonoverlapping time bins and averaged the frequency content within each time bin over time. This procedure resulted in a time-frequency representation with 128 frequencies × 10 time bins = 1,280 features. The processing steps described above were applied to all stimuli, resulting in a [N × F] feature matrix S of time-dependent frequency content, where N is the number of sounds and F is the number of features.
Estimation of fMRI Responses to Natural Sounds.
We computed voxels’ responses to natural sounds using customized MATLAB code. For each voxel i, the response vector Yi [(N × 1)], where N is the number of sounds, was obtained in two steps. First, a hemodynamic response function (HRF) common to all stimuli was estimated via a deconvolution analysis in which all stimuli were treated as a single condition. Then, using this HRF and one predictor per sound, we computed the beta weight of each sound. In experiment 1, the HRF was estimated from the six training runs (discussed above) and beta weights were computed separately for training and testing runs. In experiment 2, we implemented a fourfold cross-validation across the four stimulus sets (discussed above). The HRF was estimated using the training data, and beta weights were computed separately for training and testing sounds. Further analyses were performed on voxels with a significant positive response to the training sounds (P < 0.05 uncorrected, in order not to be too stringent at this stage of the process) within an anatomically defined mask, which included the HG, PT, PP, and STG.
Estimation of Linear Decoders.
For each subject, a linear decoder was trained for every feature of the modulation space, as follows. The stimulus feature Si [Ntrain × 1] was modeled as a linear transformation of the multivoxel response pattern Ytrain [Ntrain × V] plus a bias term bi and a noise term n [Ntrain × 1] as follows:
| [S1] |
where Ntrain is the number of sounds in the training set, V is the number of voxels, 1 is a [Ntrain × 1] vector of ones, and Ci is a [V × 1] vector of weights, whose elements cij quantify the contribution of voxel j to the encoding of feature i. For the ROI analysis, independent decoders were trained for each ROI.
The solution to Eq. S1 was computed by means of kernel ridge regression using a linear kernel (53). The regularization parameter λ was determined independently for each feature by generalized cross-validation (54). The search grid included 32 values between 100.5 and 1011 logarithmically spaced with a grid grain of 100.33.
For the reconstruction analysis of experiment 1, decoders were estimated on the six training runs and tested on the two testing runs (discussed above). For the reconstruction analysis of experiment 2, we implemented a fourfold cross-validation across the four stimulus sets (discussed above).
For the ROI analysis of experiment 1, we used only data from the training runs and implemented a sixfold cross-validation (120 training sounds and 24 testing sounds). Folds were generated in a pseudorandom manner to balance sound categories across folds, and the same folds were used for all ROIs. For experiment 2, we implemented a fourfold cross-validation across the four stimulus sets.
fMRI-Based Sound Reconstruction: Accuracy.
Given the set of trained decoders [V × F] and the patterns of fMRI activity for the test sounds Ytest [Ntest × V], the predicted feature matrix [Ntest × F] for the test set was obtained as follows:
| [S2] |
For the reconstruction analysis, we assessed how well we could predict the modulation content (or time-varying frequency content) of each test sound. We quantified prediction accuracy by calculating the for the stimuli in the test set. For each stimulus s, we computed as follows:
| [S3] |
where sk is the kth measured feature, is the kth predicted feature, and is the mean of sound s in the features space. Note that despite the “squared” in the name, may assume negative values (e.g., when the prediction of the mean is wrong). values range from −Inf to 1 and represent a relative measure of how well the decoders predict the data, with the reference model being the mean of the data itself. greater than 0 indicates that the set of decoders predicts the data better than the mean of the data. We tested the statistical significance of at the group level, as follows: We computed the median per subject (i.e., across test sounds) and tested it against 0 using a group-level, random effects, one-tailed Wilcoxon signed-rank test.
was computed on a different number of features for the modulation-frequency– and time-frequency–based models (153,600 for the modulation representation and 1,280 for the time-frequency representation). To control that the greater obtained for the modulation model is not due to the different number of features for the two models, we performed the following simulations: for each stimulus in the test set, we randomly permuted (P = 500 permutations) the feature labels of the reconstructed sound (i.e., F in matrix S) and computed for each permutation for both models. To prevent sample-related variability, the same permutations were applied to all sounds and all subjects. We thus obtained a permutation-based random distribution for the modulation-based model (black line in Fig. S1A) and for the time-frequency model (black line in Fig. S1B), with the following median and IQR: experiment 1: median [IQR], modulation model = −0.28 [−0.43 to 0.21], time-frequency model = −0.12 [−0.29 to 0.07]; experiment 2: median [IQR], modulation model = −0.39 [−0.53 to 0.28], time-frequency model = −0.12 [−0.22 to 0.07]). Although testing the equality of these two random distributions is difficult, the simulation results are in sharp contrast to the results obtained considering the actual distributions and demonstrate that the larger number of features for the modulation model does not lead to higher per se in the implemented cross-validation scheme.
fMRI-Based Sound Reconstruction: Specificity.
We assessed the specificity of the fMRI-based predictions by means of a sound identification analysis. Namely, we used the predictions from fMRI activity patterns to identify which sound had been heard among all sounds in the test set.
For each stimulus si, we computed the between its predicted representation [1 × F] and all stimuli [1 × F], j = 1, 2, …, N. The rank of the between predicted and actual sounds for stimulus si was selected as a measure of the model’s ability to match correctly with its prediction . The matching score m for stimulus si was obtained by normalizing the computed rank between 0 and 1 as follows (m = 1 indicates correct match, m = 0 indicates that the prediction for stimulus si was least similar to the actual one among all stimuli):
| [S4] |
Normalized ranks were computed for all stimuli in the test set, and the overall model’s accuracy was obtained as the median of the matching scores across stimuli. To assess the statistical significance of the identification accuracy, we computed its null distribution by randomly permuting (P = 200 permutations) the test sounds (i.e., Ntest in ) and computing the identification accuracy for each permutation. We applied the same permutations to all subjects to prevent sample-related variability.
Sound Wave Resynthesis from Brain-Based Reconstructions.
The restoration of the original sound wave from the predicted modulation representation requires two inverse operations: from the modulation domain to the spectrogram and from the spectrogram to the waveform. Our reconstruction model estimates only the magnitude information of the complex-valued modulation representation. An approximation of the spectrogram can be obtained by using iterative algorithms that attempt to retrieve the missing phase information. Likewise, the spectrogram itself is not perfectly invertible due to nonlinear operations involved in its calculation; therefore, an iterative procedure is necessary to restore an approximation of the sound wave from the spectrogram. When applied to actual sounds (i.e., not reconstructed from fMRI responses), these algorithms provide reconstructions that, although not perfect, are still intelligible (21).
We used customized MATLAB code to implement a direct projection algorithm for an approximate reconstruction of the auditory spectrogram from the fMRI-based prediction of the modulation representation. The algorithm can be summarized as follows (21):
-
i)
Interpolate the predicted magnitude representation to the original temporal resolution (magnitude information had been predicted at 10 temporal points (discussed above).
-
ii)
Initialize a random, nonnegative auditory spectrogram.
-
iii)
Compute magnitude and phase of the modulation representation of the spectrogram.
-
iv)
Replace the magnitude from step iii with the magnitude predicted from the fMRI activity patterns.
-
v)
Invert the complex-valued modulation representation to the spectrogram domain.
-
vi)
Half-wave rectify the spectrogram, and repeat from step iii until a predefined number of iterations is reached.
Finally, the sound waveform is obtained by inverting the estimated spectrogram. Because of the nonlinear operations in the early stage of the auditory model, the reconstruction from the spectrogram is only an approximation. Here, we used the iterative reconstruction algorithm implemented in the NSL Tools package.
For experiment 1, we applied the iterative procedure (10 iterations) to the predicted modulation representation of subject S3 (data from this subject yielded the highest reconstruction quality). To reduce noise in the reconstruction, we included only features whose predicted amplitude was above 0.2 in all subjects. For experiment 2, the iterative reconstruction algorithm (10 iterations) was applied to each subject independently. A threshold of 0.2 was imposed on the predicted modulation representation of the subject under consideration. We performed an identification analysis to assess the degree of matching between reconstructed and observed spectrograms (as discussed for identification accuracy). To account for errors related to temporal down-sampling (to 10 time bins) and iterative projection algorithms, the reference spectrograms for the identification analysis were obtained by inverting the down-sampled magnitude modulation representation of the original sounds (10 iterations). We computed the null distribution of the identification accuracy by randomly permuting (P = 200 permutations) the test sounds and computing the identification accuracy for each permutation.
Definition of Anatomical ROIs.
We defined six ROIs: HG, PP, PT, aSTG, mSTG, and pSTG. ROIs were manually labeled on each subject’s cortical surface mesh representation according to the criteria defined by Kim et al. (55). The HG is the most anterior transverse gyrus on the superior temporal plane. Its anteromedial border was defined by the first transverse sulcus (FTS), and its posterolateral border was defined by the Heschl’s sulcus (HS), or by the sulcus intermedius (SI) in case it was present. Medially, the HG was confined by the circular sulcus of the insula (CSI). The PP is a region on the superior temporal plane anterior to the HG. Medially, the PP was confined by the CSI. The lateral border was defined following the FTS until the anterior end of the HS or the SI; here, the lateral border was changed to the lateral rim of the superior temporal plane. The PT is a triangular region posterior to the HG on the superior temporal plane. Its anteromedial border was defined by the HS, or by the SI when it was present. The lateral rim of the superior temporal plane confined the PT laterally; the medial border was defined as the deepest point of the Sylvian fissure from the medial origin of the HS until the posterior point of the STG at the temporal parietal junction.
The STG constitutes the lower bank of the Sylvian fissure and runs parallel to the STG. It was traced from its anterior border at the temporal pole to the posterior end of the Sylvian fissure at the temporal parietal junction. The STG was additionally subdivided into aSTG, mSTG, and pSTG portions. The anterolateral and posteromedial ends of the HG were used as reference points to trace the borders of the mSTG.
Anatomical ROIs were manually outlined on the cortex reconstruction of each individual subject using BrainVoyager QX (Brain Innovations). We obtained 3D ROIs by projecting the selected regions into the volume space of the same subjects. To ensure that no overlap between distinct ROIs was present, all 3D ROIs were visually inspected and manually or automatically corrected. Customized MATLAB code was used for automatic corrections.
Estimation of ROI-Specific MTF.
We evaluated the distinct representation of sounds in each anatomical ROI by estimating ROI-specific reconstruction decoders for each feature. For each ROI, feature predictions from the k test sets (discussed above) were concatenated and decoders were assessed individually by computing the Pearson’s r between the predicted and actual stimulus features. This computation resulted in 3,600 correlation coefficients per ROI per hemisphere, which represented the MTFRH and MTFLH for a given ROI. For statistical testing, all correlation values were transformed into z-scores by applying the Fisher’s z-transform, and results from experiment 1 and experiment 2 were pooled together. We averaged the MTFs across hemispheres and implemented a nonparametric, random effects group analysis for every feature, as follows. First, for each stimulus feature, we computed the null distribution of correlation coefficients at the single-subject level. Null distributions were obtained by randomly permuting (500 times) the stimulus labels of the reconstructed features and computing the correlation coefficient for each permutation. The empirical chance level of correlation, rchance, was defined as the mean of the null distribution. Null distributions were estimated separately for MTFRH and MTFLH, and the empirical chance level for the average MTF was computed as the average between the chance levels of individual hemispheres.
For each feature, we then performed a random effects, one-tailed, nonparametric paired test (exact permutation test) to assess whether the correlation between a reconstructed feature and an original feature was significantly higher than chance at the group level (note that negative correlations are not meaningful because they indicate poor reconstruction). Our test statistic was the group average of the individual differences d = r − rchance. To obtain the null distribution of the group average difference, we changed the sign of d for a randomly selected subset of subjects and recomputed the group average (56). This procedure was repeated for all possible permutations of sign change (210 = 1,024), and the P value was computed as the proportion of permutations that yielded a test statistic equal to or more extreme than the observed one. To correct for multiple comparisons across stimulus features, we used a cluster-size threshold procedure (57). For this procedure, cluster-level false-positive rates were estimated for every permutation using an initial uncorrected threshold of 0.05. The minimum cluster-size threshold that yielded a cluster-level false-positive rate (alpha) of 5% was then applied to the MTFs. The statistical procedure described above was applied to all ROIs independently.
Analysis of Regional Differences.
In addition to the analysis conducted to characterize the accuracy of feature reconstruction in each region separately, we conducted further analyses of the MTFs (pooled for the two experiments) to test for statistical significance of pairwise differences between MTFs of different ROIs. To test regional differences between MTFs, we carried out all possible pairwise comparisons between ROIs. For every pair MTFi and MTFj, we performed the following conjunction analyses: (MTFi > MTFj) ∩ (MTFi > chance) and (MTFj > MTFi) ∩ (MTFj > chance). We assessed the statistical significance of the contrasts MTFi > MTFj and MTFj > MTFi by performing a random effects, one-tailed, nonparametric paired test (exact permutation test) for each contrast. For every feature, we computed the group average of the individual difference d, which was defined as d = ri − rj for the contrast MTFi > MTFj and d = rj − ri for the contrast MTFj > MTFi. To obtain the null distribution of the group average difference, we changed the sign of d for a randomly selected subset of subjects and recomputed the group average. This procedure was repeated for all possible permutations of sign change (210 = 1,024), and the P value was computed as the proportion of null values equal to or more extreme than the observed group average difference. To correct for false-positive results, we used a cluster-sized threshold procedure. For every permutation, we estimated cluster-level false-positive rates using an initial uncorrected threshold of 0.05. Finally, we applied the minimum cluster-size threshold that yielded a cluster-level false-positive rate (alpha) of 5%. The results of the pairwise comparisons between ROIs are illustrated in Fig. S3.
Post Hoc Statistical Analysis of MTFs’ Marginal Profiles.
MTFs’ marginal profiles (Fig. 5 and Fig. S6B) were obtained by averaging the group-averaged MTFs along irrelevant dimensions [e.g., along frequency (f) and temporal modulation (ω) for the spectral modulation (Ω) profile]. To assess the statistical significance of the observations on MTFs’ marginal profiles, we performed the following post hoc analyses. For the spectral modulation profile, we compared the reconstruction accuracy at 0.5 cyc/oct (r0.5) with the accuracy at 4 cyc/oct (r4). Our test statistic was the average across frequency and temporal modulations of the differences d = r0.5 − r4. To obtain the null distribution of the average difference, we changed the sign of d for a randomly selected subset of points and recomputed the average. This procedure was repeated 2,000 times, and the P value was computed as the proportion of permutations that yielded a test statistic equal to or more extreme than the observed one (in absolute values). A similar statistical procedure was applied to all post hoc tests of the MTFs’ profiles.
Data and Methods Sharing.
Anonymized fMRI data and stimuli are available at Dryad (dx.doi.org/10.5061/dryad.np4hs). The customized MATLAB code used for the analyses is available upon request to the authors.
SI Discussion
Model-Based fMRI Analysis of Natural Sounds (Single-Voxel Encoding and Multivariate Decoding).
In a previous study (14), we had examined the tuning of cortical locations and the topographical organization for spectrotemporal modulations using real-life sounds and single-voxel encoding (20). In that case, the assumption is that the stimulus features that maximally contribute to a voxel response are also the stimulus features encoded with the greatest fidelity. However, even on the level of single neurons, higher responses might not necessarily mean better encoding (58). By contrast, the approach used here characterizes the various auditory cortical regions in terms of how informative their response patterns are with respect to the stimulus features. By relying on measures of information rather than activation levels, the results of the multivoxel approach complement and enrich the results of single-voxel encoding. Within the decoding framework, data from individual voxels are jointly modeled, which removes the need to integrate post hoc results derived from the modeling of individual voxels. The combined analysis of signals from multiple voxels increases the sensitivity for information that may be represented in spatial patterns of activity rather than activation levels. Furthermore, the number of model features can be much larger in the case of decoding analysis; thus, this latter approach can be used for examining richer sound representation models, as has been done in the present work. However, the fact that the relation to each feature of the representation model is learned separately, as well as the high sensitivity for spatially distributed effects, makes multivariate decoding susceptible to the effects of the correlation among model features and complicates interpretation of the decoding results in terms of neuronal tuning. On the contrary, single-voxel encoding models can account for the linear relation among model features (depending on the type of regularization used), and thus is better suited for investigating the tuning properties of a cortical location. Importantly, the results of both single-voxel encoding (14) and multivoxel decoding (this study) support the hypothesis that the human auditory cortex performs a spectrotemporal modulation analysis of the sounds and entails modulation-based neural sound representations.
Choosing the Range and Resolution of the Sound Representation Model.
In the present study, the range and resolution of the sound representation model were chosen based on several considerations. The upper limits of modulation frequencies were chosen on the basis of psychophysically derived detection thresholds, which show that human sensitivity to spectrotemporal modulations is highest below Ω = 4 cyc/oct and ω = 32 Hz (4). The range used is comparable to the range considered in two previous human neuroimaging studies investigating neuronal tuning for combined spectrotemporal modulations with dynamic ripples (14, 15). Because a model is learned independently for each feature with the proposed multivariate decoding approach, the choice of model resolution was constrained by considerations of computational time and statistical power. In the modulation-based sound representations, rate and scale values are replicated for each frequency, and in the time-resolved analysis, they are replicated for each time bin. Increasing the modulation resolution further would increase the computational times considerably. Additionally, increasing the model resolution (and/or range) may decrease the overall statistical sensitivity, because there would be a larger number of tests to correct for (e.g., when assessing the significance of single-feature reconstruction accuracy). For further applications, it would be important to develop methods enabling an objective selection of the “optimal” resolution and range of the sound representation model. These methods should consider the discussed constraints as well as the acoustic properties of the stimulus set, the specific task (e.g., sound identification, categorization), and the resolution and sensitivity of the brain measurements (fMRI), which should allow resolution of the contribution of the distinct filters.
Discussion
We applied an approach to embed models of neural sound representations in the analysis of fMRI response patterns, and thereby showed that it is feasible to reconstruct, with significant accuracy and specificity, the spectrotemporal modulation content of real-life sounds from fMRI signals. Successful decoding of the (time-averaged) spectral components of sounds could be expected based on the spatial organization of frequency in the auditory cortex (29, 30). Our current findings indicate that spectrotemporal sound modulations also map into distinct and reproducible spatial fMRI response patterns. This result is consistent with the hypothesis of a spatial representation of acoustic features besides frequency in primate (31) and human (14, 15, 32) auditory cortex.
The temporal specificity of obtained predictions indicated that not only the time-averaged modulation content of sounds but also modulation changes on the order of about 200 ms could be decoded from fMRI response patterns. Although consistent with recent reports of speech spectrogram reconstruction from ECoG recordings (12), this result is surprising, given the low temporal resolution of fMRI and the coarse temporal sampling [repetition time (TR) = 2.6 s] of brain responses. How is our result possible? We trained many (n = 153,600) multivariate decoders based on the same estimates of fMRI responses to the sounds. For each feature and for each time window, training resulted in a unique weighting of voxels’ responses (i.e., the weights Ci). In other words, different sets of voxels were weighted relatively high or low for predictions corresponding to different features and time windows. This result suggests a mechanism by which spatial fMRI patterns are informed by temporal aspects of the sounds (also ref. 33). This effect can occur, for example, if the activity of spatially separated neuronal populations is both specific to (combinations of) frequencies and modulations and time-dependent (10). However, many other neuronal and hemodynamic mechanisms likely contribute to our observations (34).
The ROI-based analyses revealed a number of interesting effects. In regions on the superior temporal plane (HG, PP, and PT), we observed a decrease in reconstruction accuracies for frequencies around 0.8 kHz, which corresponds to the frequency of peak energy for the scanner noise generated by our fMRI sequence (Fig. S5). In our clustered fMRI acquisition, sounds were presented during silent gaps between scans. It is thus possible that, similar to streaming paradigms (35), subjects modulated their attention to filter out the frequencies in the range of the scanner acoustic noise. Furthermore, the scanner noise between stimuli presentations might have affected the response to the auditory stimulation through, for example, adaptation of the neuronal population of interest or saturation of the BOLD response (36).
In the HG [the likely site of the primary auditory cortex (29)] and adjacent regions in the PP and PT, reconstruction accuracy for temporal modulation rates presented a clear dependency on frequency. For higher frequencies (>∼2 kHz), accuracy was highest for faster modulation rates (6.6–30 Hz), which was not observed in the more lateral regions on the STG. For lower frequencies, the reconstruction accuracy profile for temporal modulation rates was highest in the range of 2–4 Hz, with a peak around 3 Hz. This finding is consistent with previous fMRI studies that examined cortical responses to temporal modulation rates with broadband noise (37, 38), and especially with those studies using narrow-band sounds (39, 40). However, these previous studies did not report the interdependency between sound carrier frequency and temporal modulations as observed in our study. Such interdependency may relate to the psychoacoustic observation that for higher frequency carriers, detection of temporal modulation changes is poorest at slower rates (41).
In STG regions, the reconstruction accuracy profiles for temporal modulations were highest in the range of 2–4 Hz, which is in agreement with most previous fMRI studies (37–40). Under the assumption that the observed reconstruction accuracy reflects the tuning properties of neuronal populations, our discriminability analysis suggested that such an amplification of acoustic components may lead to sound representations optimized for the fine-grained discrimination of speech (and voices) rather than for natural sounds per se (28). This interpretation is consistent with the hypothesis that neuronal populations in higher level auditory cortex are preferentially “tuned” to acoustic components relevant for the analysis of speech (23, 42). For human listeners, speech is arguably the class of natural sounds with the highest behavioral relevance, and it is thus reasonable that the human brain has developed mechanisms to analyze speech optimally. Importantly, the discriminability effects were significant already in the HG (Fig. S7). Furthermore, neither in primary regions nor in STG regions were the profiles of reconstruction accuracy for temporal modulations affected by the removal of speech/voice sounds (Fig. S6B). Together, these findings put forward the hypothesis that, in the human brain, even the properties of neuronal populations in early auditory cortical areas and the general purpose mechanisms involved in the analysis of any sound have been shaped by the characteristic acoustic properties of speech. This hypothesis is consistent with psychoacoustic investigations showing that human listeners have highest sensitivity in detecting temporal modulations changes in the range of 2–4 Hz, even when tested with broadband noise and tones (43, 44). Finally, the tight link between these mechanisms and speech predicts that these properties are specific to the human brain, which could be tested by performing the same (fMRI) experiments and analyses in nonhuman species.
Our study extends ECoG investigations on the representation of speech (12, 13, 35) to fMRI and to sounds other than speech. Although lacking the exquisite temporal resolution of ECoG, fMRI is noninvasive, enables large brain coverage, and approaches a spatial resolution in the submillimeter range (45). Together with the results of single-voxel encoding (14) (SI Discussion), the present study supports the hypothesis that the human auditory cortex analyzes the spectrotemporal content of complex sounds through frequency-specific modulation filters. Our proposed framework can be used to address relevant questions, for example, on how such processing changes due to ongoing task demands or to specific skill acquisitions (e.g., musical training, reading acquisition), brain development and aging, or hearing loss. Furthermore, in combination with submillimeter fMRI, it can be used to analyze the transformation of sound representations across cortical layers (45).
Whereas we choose to model the responses to real-life sounds, the MTF of a given region could be more simply estimated using synthetic sounds (e.g., dynamic ripples), with each one designed to include a unique combination of modulations (15). Compared with using synthetic stimuli, however, real-life stimuli appear advantageous for two reasons. First, they engage the auditory cortex in meaningful processing and, especially in nonprimary areas, they evoke larger responses compared with synthetic stimuli. Second, each stimulus contains a different combination of features of interest, such that the entire set of stimuli efficiently covers a wide range for each feature. The MTF of a region is then estimated by assessing which feature is accurately reconstructed from fMRI response patterns. This procedure allows estimating a region’s reconstruction accuracy profile at the resolution of the representation model (discussed further in SI Discussion). With separately presented synthetic stimuli, obtaining such a resolution would involve the presentation of 15,360 different conditions, which is not practically feasible. Evidence from animal (46) and human (13, 47) electrophysiology indicates that spectrotemporal receptive fields and MTFs estimated using synthetic sounds are poor predictors of responses to natural sounds. In further studies, it would be relevant to investigate whether and to what extent this observation also applies to neuronal population responses as measured with fMRI.
Although efficient, the combination of real-life stimuli and model-based fMRI to study acoustic processing in auditory cortical regions has inherent caveats. Beyond the acoustic analysis, fMRI response patterns in the superior temporal cortex relate to higher levels of sound processing, as required, for example, for the perceptual and cognitive processing of speech (24, 25), voice (26, 48), or music (49, 50). These higher processing levels are not explicitly accounted for in the current sound representation model and may involve complex (nonlinear) transformations of the elementary acoustic features, which are the actual targets of the decoding. This simplified modeling may give rise to the possibility that a feature is successfully decoded only by virtue of its complex interrelation with other factors affecting the fMRI signal. The results of the analysis excluding speech and voice sounds confirmed that the tested model describes the processing of sounds in early auditory regions (HG, PT, and PP) as well as in STG regions well. These latter regions, however, were affected more by the exclusion of speech and voice sounds from the training set. Most likely, this finding reflects the fact that these regions are the sites of relevant (nonlinear) transformations of the acoustic input into higher level neural representations. The results of our discriminability analysis (Figs. S7 and S8) put forward the “zooming in” into an informative but limited subset of frequency/modulations as a mechanism that is potentially useful at the input stages of this transformation. Developing and testing computational descriptions of the full transformation chain, however, remain a challenge for future modeling and functional neuroimaging studies.
Materials and Methods
The Institutional Review Board for human subject research at the University of Minnesota (experiment 1) and the Ethical Committee of the Faculty of Psychology and Neuroscience at Maastricht University (experiment 2) granted approval for the study. Procedures followed the principles expressed in the Declaration of Helsinki. Informed consent was obtained from each participant before conducting the experiments. Anatomical MRI and fMRI data were collected at 7 T and preprocessed using BrainVoyager QX (Brain Innovations). Auditory spectrograms and modulation content of the stimuli, as well as fMRI-based reconstruction of spectrograms and waveforms, were obtained using “NSL Tools” (www.isr.umd.edu/Labs/NSL/Software.htm) and customized MATLAB code (The MathWorks, Inc.). Methods for estimating fMRI response patterns, for training and testing of the multivariate decoders, and for the statistical assessment of the results were developed and implemented using MATLAB (SI Materials and Methods).
Supplementary Material
Acknowledgments
This work was supported by Maastricht University, the Dutch Province of Limburg, and the Netherlands Organization for Scientific Research (Grants 453-12-002 to E.F., 451-15-012 to M.M., and 864-13-012 to F.D.M.); the NIH (Grants P41 EB015894, P30 NS076408, and S10 RR26783); and the W. M. Keck Foundation.
Footnotes
The authors declare no conflict of interest.
This article is a PNAS Direct Submission. D.P. is a guest editor invited by the Editorial Board.
Data deposition: The fMRI data and stimuli have been deposited in Dryad (dx.doi.org/10.5061/dryad.np4hs).
This article contains supporting information online at www.pnas.org/lookup/suppl/doi:10.1073/pnas.1617622114/-/DCSupplemental.
References
- 1.Theunissen FE, Elie JE. Neural processing of natural sounds. Nat Rev Neurosci. 2014;15:355–366. doi: 10.1038/nrn3731. [DOI] [PubMed] [Google Scholar]
- 2.Singh NC, Theunissen FE. Modulation spectra of natural sounds and ethological theories of auditory processing. J Acoust Soc Am. 2003;114:3394–3411. doi: 10.1121/1.1624067. [DOI] [PubMed] [Google Scholar]
- 3.Fukushima M, Doyle AM, Mullarkey MP, Mishkin M, Averbeck BB. Distributed acoustic cues for caller identity in macaque vocalization. R Soc Open Sci. 2015;2:150432. doi: 10.1098/rsos.150432. [DOI] [PMC free article] [PubMed] [Google Scholar]
- 4.Chi T, Gao Y, Guyton MC, Ru P, Shamma S. Spectro-temporal modulation transfer functions and speech intelligibility. J Acoust Soc Am. 1999;106:2719–2732. doi: 10.1121/1.428100. [DOI] [PubMed] [Google Scholar]
- 5.Drullman R, Festen JM, Plomp R. Effect of temporal envelope smearing on speech reception. J Acoust Soc Am. 1994;95:1053–1064. doi: 10.1121/1.408467. [DOI] [PubMed] [Google Scholar]
- 6.Elliott TM, Theunissen FE. The modulation transfer function for speech intelligibility. PLOS Comput Biol. 2009;5:e1000302. doi: 10.1371/journal.pcbi.1000302. [DOI] [PMC free article] [PubMed] [Google Scholar]
- 7.Shannon RV, Zeng FG, Kamath V, Wygonski J, Ekelid M. Speech recognition with primarily temporal cues. Science. 1995;270:303–304. doi: 10.1126/science.270.5234.303. [DOI] [PubMed] [Google Scholar]
- 8.Rodríguez FA, Read HL, Escabí MA. Spectral and temporal modulation tradeoff in the inferior colliculus. J Neurophysiol. 2010;103:887–903. doi: 10.1152/jn.00813.2009. [DOI] [PMC free article] [PubMed] [Google Scholar]
- 9.Miller LM, Escabí MA, Read HL, Schreiner CE. Functional convergence of response properties in the auditory thalamocortical system. Neuron. 2001;32:151–160. doi: 10.1016/s0896-6273(01)00445-7. [DOI] [PubMed] [Google Scholar]
- 10.deCharms RC, Blake DT, Merzenich MM. Optimizing sound features for cortical neurons. Science. 1998;280:1439–1443. doi: 10.1126/science.280.5368.1439. [DOI] [PubMed] [Google Scholar]
- 11.Kowalski N, Depireux DA, Shamma SA. Analysis of dynamic spectra in ferret primary auditory cortex. II. Prediction of unit responses to arbitrary dynamic spectra. J Neurophysiol. 1996;76:3524–3534. doi: 10.1152/jn.1996.76.5.3524. [DOI] [PubMed] [Google Scholar]
- 12.Pasley BN, et al. Reconstructing speech from human auditory cortex. PLoS Biol. 2012;10:e1001251. doi: 10.1371/journal.pbio.1001251. [DOI] [PMC free article] [PubMed] [Google Scholar]
- 13.Hullett PW, Hamilton LS, Mesgarani N, Schreiner CE, Chang EF. Human superior temporal gyrus organization of spectrotemporal modulation tuning derived from speech stimuli. J Neurosci. 2016;36:2014–2026. doi: 10.1523/JNEUROSCI.1779-15.2016. [DOI] [PMC free article] [PubMed] [Google Scholar]
- 14.Santoro R, et al. Encoding of natural sounds at multiple spectral and temporal resolutions in the human auditory cortex. PLOS Comput Biol. 2014;10:e1003412. doi: 10.1371/journal.pcbi.1003412. [DOI] [PMC free article] [PubMed] [Google Scholar]
- 15.Schönwiesner M, Zatorre RJ. Spectro-temporal modulation transfer function of single voxels in the human auditory cortex measured with high-resolution fMRI. Proc Natl Acad Sci USA. 2009;106:14611–14616. doi: 10.1073/pnas.0907682106. [DOI] [PMC free article] [PubMed] [Google Scholar]
- 16.Bialek W, Rieke F, de Ruyter van Steveninck RR, Warland D. Reading a neural code. Science. 1991;252:1854–1857. doi: 10.1126/science.2063199. [DOI] [PubMed] [Google Scholar]
- 17.Mesgarani N, David SV, Fritz JB, Shamma SA. Influence of context and behavior on stimulus reconstruction from neural activity in primary auditory cortex. J Neurophysiol. 2009;102:3329–3339. doi: 10.1152/jn.91128.2008. [DOI] [PMC free article] [PubMed] [Google Scholar]
- 18.Miyawaki Y, et al. Visual image reconstruction from human brain activity using a combination of multiscale local image decoders. Neuron. 2008;60:915–929. doi: 10.1016/j.neuron.2008.11.004. [DOI] [PubMed] [Google Scholar]
- 19.Naselaris T, Prenger RJ, Kay KN, Oliver M, Gallant JL. Bayesian reconstruction of natural images from human brain activity. Neuron. 2009;63:902–915. doi: 10.1016/j.neuron.2009.09.006. [DOI] [PMC free article] [PubMed] [Google Scholar]
- 20.Kay KN, Naselaris T, Prenger RJ, Gallant JL. Identifying natural images from human brain activity. Nature. 2008;452:352–355. doi: 10.1038/nature06713. [DOI] [PMC free article] [PubMed] [Google Scholar]
- 21.Chi T, Ru P, Shamma SA. Multiresolution spectrotemporal analysis of complex sounds. J Acoust Soc Am. 2005;118:887–906. doi: 10.1121/1.1945807. [DOI] [PubMed] [Google Scholar]
- 22.Moerel M, et al. Processing of natural sounds: Characterization of multipeak spectral tuning in human auditory cortex. J Neurosci. 2013;33:11888–11898. doi: 10.1523/JNEUROSCI.5306-12.2013. [DOI] [PMC free article] [PubMed] [Google Scholar]
- 23.Poeppel D. The analysis of speech in different temporal integration windows: Cerebral lateralization as ‘asymmetric sampling in time’. Speech Commun. 2003;41:245–255. [Google Scholar]
- 24.Binder JR, et al. Human temporal lobe activation by speech and nonspeech sounds. Cereb Cortex. 2000;10:512–528. doi: 10.1093/cercor/10.5.512. [DOI] [PubMed] [Google Scholar]
- 25.Overath T, McDermott JH, Zarate JM, Poeppel D. The cortical analysis of speech-specific temporal structure revealed by responses to sound quilts. Nat Neurosci. 2015;18:903–911. doi: 10.1038/nn.4021. [DOI] [PMC free article] [PubMed] [Google Scholar]
- 26.Belin P, Zatorre RJ, Lafaille P, Ahad P, Pike B. Voice-selective areas in human auditory cortex. Nature. 2000;403:309–312. doi: 10.1038/35002078. [DOI] [PubMed] [Google Scholar]
- 27.Woolley SM, Fremouw TE, Hsu A, Theunissen FE. Tuning for spectro-temporal modulations as a mechanism for auditory discrimination of natural sounds. Nat Neurosci. 2005;8:1371–1379. doi: 10.1038/nn1536. [DOI] [PubMed] [Google Scholar]
- 28.Machens CK, Gollisch T, Kolesnikova O, Herz AVM. Testing the efficiency of sensory coding with optimal stimulus ensembles. Neuron. 2005;47:447–456. doi: 10.1016/j.neuron.2005.06.015. [DOI] [PubMed] [Google Scholar]
- 29.Formisano E, et al. Mirror-symmetric tonotopic maps in human primary auditory cortex. Neuron. 2003;40:859–869. doi: 10.1016/s0896-6273(03)00669-x. [DOI] [PubMed] [Google Scholar]
- 30.Moerel M, De Martino F, Formisano E. Processing of natural sounds in human auditory cortex: Tonotopy, spectral tuning, and relation to voice sensitivity. J Neurosci. 2012;32:14205–14216. doi: 10.1523/JNEUROSCI.1388-12.2012. [DOI] [PMC free article] [PubMed] [Google Scholar]
- 31.Baumann S, et al. The topography of frequency and time representation in primate auditory cortices. eLife. 2015;4:4. doi: 10.7554/eLife.03256. [DOI] [PMC free article] [PubMed] [Google Scholar]
- 32.Barton B, Venezia JH, Saberi K, Hickok G, Brewer AA. Orthogonal acoustic dimensions define auditory field maps in human cortex. Proc Natl Acad Sci USA. 2012;109:20738–20743. doi: 10.1073/pnas.1213381109. [DOI] [PMC free article] [PubMed] [Google Scholar]
- 33.Nishimoto S, et al. Reconstructing visual experiences from brain activity evoked by natural movies. Curr Biol. 2011;21:1641–1646. doi: 10.1016/j.cub.2011.08.031. [DOI] [PMC free article] [PubMed] [Google Scholar]
- 34.Kriegeskorte N, Cusack R, Bandettini P. How does an fMRI voxel sample the neuronal activity pattern: Compact-kernel or complex spatiotemporal filter? Neuroimage. 2010;49:1965–1976. doi: 10.1016/j.neuroimage.2009.09.059. [DOI] [PMC free article] [PubMed] [Google Scholar]
- 35.Mesgarani N, Chang EF. Selective cortical representation of attended speaker in multi-talker speech perception. Nature. 2012;485:233–236. doi: 10.1038/nature11020. [DOI] [PMC free article] [PubMed] [Google Scholar]
- 36.Gaab N, Gabrieli JD, Glover GH. Assessing the influence of scanner background noise on auditory processing. I. An fMRI study comparing three experimental designs with varying degrees of scanner noise. Hum Brain Mapp. 2007;28:703–720. doi: 10.1002/hbm.20298. [DOI] [PMC free article] [PubMed] [Google Scholar]
- 37.Giraud AL, et al. Representation of the temporal envelope of sounds in the human brain. J Neurophysiol. 2000;84:1588–1598. doi: 10.1152/jn.2000.84.3.1588. [DOI] [PubMed] [Google Scholar]
- 38.Harms MP, Melcher JR. Sound repetition rate in the human auditory pathway: Representations in the waveshape and amplitude of fMRI activation. J Neurophysiol. 2002;88:1433–1450. doi: 10.1152/jn.2002.88.3.1433. [DOI] [PubMed] [Google Scholar]
- 39.Overath T, Zhang Y, Sanes DH, Poeppel D. Sensitivity to temporal modulation rate and spectral bandwidth in the human auditory system: fMRI evidence. J Neurophysiol. 2012;107:2042–2056. doi: 10.1152/jn.00308.2011. [DOI] [PMC free article] [PubMed] [Google Scholar]
- 40.Boemio A, Fromm S, Braun A, Poeppel D. Hierarchical and asymmetric temporal sensitivity in human auditory cortices. Nat Neurosci. 2005;8:389–395. doi: 10.1038/nn1409. [DOI] [PubMed] [Google Scholar]
- 41.Moore BC, Sek A. Effects of carrier frequency, modulation rate, and modulation waveform on the detection of modulation and the discrimination of modulation type (amplitude modulation versus frequency modulation) J Acoust Soc Am. 1995;97:2468–2478. doi: 10.1121/1.411967. [DOI] [PubMed] [Google Scholar]
- 42.Giraud AL, Poeppel D. Cortical oscillations and speech processing: Emerging computational principles and operations. Nat Neurosci. 2012;15:511–517. doi: 10.1038/nn.3063. [DOI] [PMC free article] [PubMed] [Google Scholar]
- 43.Bacon SP, Viemeister NF. Temporal modulation transfer functions in normal-hearing and hearing-impaired listeners. Audiology. 1985;24:117–134. doi: 10.3109/00206098509081545. [DOI] [PubMed] [Google Scholar]
- 44.Edwards E, Chang EF. Syllabic (∼2-5 Hz) and fluctuation (∼1-10 Hz) ranges in speech and auditory processing. Hear Res. 2013;305:113–134. doi: 10.1016/j.heares.2013.08.017. [DOI] [PMC free article] [PubMed] [Google Scholar]
- 45.De Martino F, et al. Frequency preference and attention effects across cortical depths in the human primary auditory cortex. Proc Natl Acad Sci USA. 2015;112:16036–16041. doi: 10.1073/pnas.1507552112. [DOI] [PMC free article] [PubMed] [Google Scholar]
- 46.Theunissen FE, Sen K, Doupe AJ. Spectral-temporal receptive fields of nonlinear auditory neurons obtained using natural sounds. J Neurosci. 2000;20:2315–2331. doi: 10.1523/JNEUROSCI.20-06-02315.2000. [DOI] [PMC free article] [PubMed] [Google Scholar]
- 47.Bitterman Y, Mukamel R, Malach R, Fried I, Nelken I. Ultra-fine frequency tuning revealed in single neurons of human auditory cortex. Nature. 2008;451:197–201. doi: 10.1038/nature06476. [DOI] [PMC free article] [PubMed] [Google Scholar]
- 48.Formisano E, De Martino F, Bonte M, Goebel R. 2008. “Who” is saying “what”? Brain-based decoding of human voice and speech. Science 322:970–973 10.1126/science.1164318. [DOI] [PubMed]
- 49.Zatorre RJ, Chen JL, Penhune VB. When the brain plays music: Auditory-motor interactions in music perception and production. Nat Rev Neurosci. 2007;8:547–558. doi: 10.1038/nrn2152. [DOI] [PubMed] [Google Scholar]
- 50.Norman-Haignere S, Kanwisher NG, McDermott JH. Distinct cortical pathways for music and speech revealed by hypothesis-free voxel decomposition. Neuron. 2015;88:1281–1296. doi: 10.1016/j.neuron.2015.11.035. [DOI] [PMC free article] [PubMed] [Google Scholar]
- 51.Van de Moortele P-F, et al. T1 weighted brain images at 7 Tesla unbiased for Proton Density, T2* contrast and RF coil receive B1 sensitivity with simultaneous vessel visualization. Neuroimage. 2009;46:432–446. doi: 10.1016/j.neuroimage.2009.02.009. [DOI] [PMC free article] [PubMed] [Google Scholar]
- 52.Goebel R, Esposito F, Formisano E. Analysis of functional image analysis contest (FIAC) data with brainvoyager QX: From single-subject to cortically aligned group general linear model analysis and self-organizing group independent component analysis. Hum Brain Mapp. 2006;27:392–401. doi: 10.1002/hbm.20249. [DOI] [PMC free article] [PubMed] [Google Scholar]
- 53.Bishop CM. Pattern Recognition and Machine Learning. Springer; New York: 2006. [Google Scholar]
- 54.Golub G, Heath M, Wahba G. Generalized cross-validation as a method for choosing a good ridge parameter. Technometrics. 1979;21:9. [Google Scholar]
- 55.Kim JJ, et al. An MRI-based parcellation method for the temporal lobe. Neuroimage. 2000;11:271–288. doi: 10.1006/nimg.2000.0543. [DOI] [PubMed] [Google Scholar]
- 56.Good PI. 2005. Permutation, Parametric and Bootstrap Tests of Hypotheses, Springer Series in Statistics (Springer, New York)
- 57.Forman SD, et al. Improved assessment of significant activation in functional magnetic resonance imaging (fMRI): Use of a cluster-size threshold. Magn Reson Med. 1995;33:636–647. doi: 10.1002/mrm.1910330508. [DOI] [PubMed] [Google Scholar]
- 58.Butts DA, Goldman MS. Tuning curves, neuronal variability, and sensory coding. PLoS Biol. 2006;4:e92. doi: 10.1371/journal.pbio.0040092. [DOI] [PMC free article] [PubMed] [Google Scholar]
Associated Data
This section collects any data citations, data availability statements, or supplementary materials included in this article.


