Significance
Carotenoids play essential roles in protecting plants from photodamage. In particular, zeaxanthin is synthesized in high light, and it is important for the fast response of plants to high-light stress. The role of zeaxanthin in photosystem II fluorescence quenching has been extensively studied, but a recent report has shown that it can also be involved in photosystem I (PSI) quenching. However, these results have been obtained using a mutant of the higher plant Arabidopsis thaliana, which contains zeaxanthin constitutively. Here, we have tested this suggestion in biologically relevant conditions. We show that zeaxanthin does not lead to PSI quenching, but it is probably involved in PSI protection indirectly. Our findings highlight the fact that two photosystems possess fundamentally different photoprotective mechanisms.
Keywords: photosystem I, NPQ, time-resolved fluorescence, LHCI, light stress
Abstract
Nonphotochemical quenching (NPQ) is the process that protects the photosynthetic apparatus of plants and algae from photodamage by dissipating as heat the energy absorbed in excess. Studies on NPQ have almost exclusively focused on photosystem II (PSII), as it was believed that NPQ does not occur in photosystem I (PSI). Recently, Ballottari et al. [Ballottari M, et al. (2014) Proc Natl Acad Sci USA 111:E2431–E2438], analyzing PSI particles isolated from an Arabidopsis thaliana mutant that accumulates zeaxanthin constitutively, have reported that this xanthophyll can efficiently induce chlorophyll fluorescence quenching in PSI. In this work, we have checked the biological relevance of this finding by analyzing WT plants under high-light stress conditions. By performing time-resolved fluorescence measurements on PSI isolated from Arabidopsis thaliana WT in dark-adapted and high-light–stressed (NPQ) states, we find that the fluorescence kinetics of both PSI are nearly identical. To validate this result in vivo, we have measured the kinetics of PSI directly on leaves in unquenched and NPQ states; again, no differences were observed. It is concluded that PSI does not undergo NPQ in biologically relevant conditions in Arabidopsis thaliana. The possible role of zeaxanthin in PSI photoprotection is discussed.
Photosystem I (PSI) is a crucial pigment-binding protein complex for oxygenic photosynthetic organisms. It absorbs sunlight and uses its energy to drive electron transport from plastocyanin to ferredoxin. In higher plant, PSI comprises a core complex that holds P700, the reaction center (RC), and four light-harvesting complexes (Lhca 1–4), and coordinates a total of 155 chlorophylls (Chls) (1, 2). PSI has a very fast (<100-ps) excited-state energy relaxation (3, 4), and it can generate electron–hole pair with near-unity quantum yield (5, 6). Its decay kinetics is virtually independent of the redox state of the RC as both P700 and P700+ are equally good quenchers (4). The rapid kinetics dramatically reduces the yield of Chl triplet states, and then the production of reactive oxygen species, one of the main causes of photodamage (7). This makes PSI a very robust complex and the favorite system for biohybrid applications (e.g., refs. 8 and 9). PSI is also resistant to high-light (HL) stress. In vivo, it is only damaged at low temperature and in the presence of an active PSII (10, 11). In contrast, PSII is sensitive to strong sunlight (7, 12).
Higher plants have evolved several strategies to avoid photodamage (13, 14). Among these, the process of nonphotochemical quenching (NPQ) is active in seconds/minutes and leads to a strong decrease of the excited-state population in the membrane. It depends on the presence of the protein PsbS (15) and the carotenoid zeaxanthin (16). Both induce fluorescence quenching, but their molecular mechanisms are still under debate (13). Until recently, it was believed that both PsbS and zeaxanthin only act at the level of PSII, whereas PSI does not require any additional photoprotection because P700+ is an excellent quencher (4). It was even proposed that P700+ could act as a quencher of the PSII excitation after association of PSII to PSI, in a process known as spillover (17). Ballottari et al. (18) have challenged this view by reporting that zeaxanthin-dependent quenching leads to a 30% reduction of the PSI functional antenna size. Considering the very fast PSI kinetics, this would require a strong quencher providing a quenching rate more than twice that observed for PSII (19). In addition, the presence of quenching on PSI would have implications for the interpretation of fluorescence induction measurements, which are widely used to monitor photosynthesis in plants and algae and assume a constant fluorescence yield for PSI (20). However, the conclusion of Ballottari et al. is based on the study of a PSI complex purified from the Arabidopsis thaliana npq2 mutant, which contains a high level of zeaxanthin constitutively (16). We have recently demonstrated that, in the case of PSII, the constitutive presence of zeaxanthin leads to quenching effects that are not present under normal NPQ conditions (21). In this work, we have checked the presence of zeaxanthin and quenching in PSI from WT plants in stress conditions. Time-resolved fluorescence measurements performed on isolated PSI complexes as well as in intact leaves in normal and NPQ conditions, indicate that zeaxanthin-dependent quenching is not active in PSI.
Results and Discussion
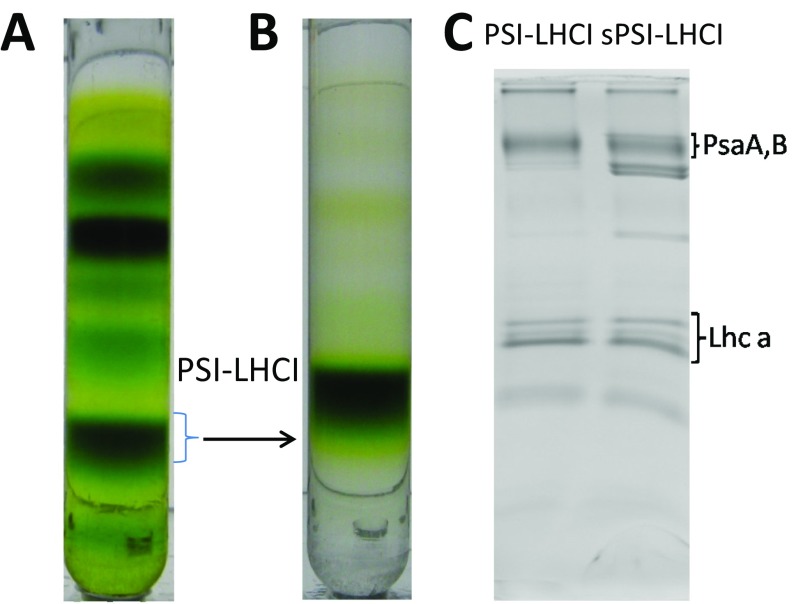
To check whether the quenching mechanism proposed for the npq2 mutant plays a role in WT plants under NPQ conditions, we have purified PSI from Arabidopsis thaliana WT plants grown in normal conditions (PSI-LHCI) or subjected to a short HL stress, which induces NPQ (21) (sPSI-LHCI). The thylakoid membranes were then mildly solubilized and the complexes purified by sucrose gradient ultracentrifugation (Fig. S1 A and B), a procedure that was shown to maintain the association of zeaxanthin with the PSII complexes (21). The protein composition of the purified complexes was analyzed by SDS/PAGE, which confirmed the presence of the main PSI subunits in both preparations (Fig. S1C).
Fig. S1.
Purification of the photosynthetic complexes (A) WT-thylakoid membrane as an example of sucrose gradient. (B) The band of PSI-LHCI complex was collected and used to run a second sucrose gradient; (C) SDS/PAGE shows the protein composition of the purified PSI-LHCI supercomplexes from control and stressed (s) plants. The additional bands observed in the sPSI-LHCI fraction belong to the ATP synthase, which does not contain pigments and then does not influence the spectroscopic characterization of the complex (C).
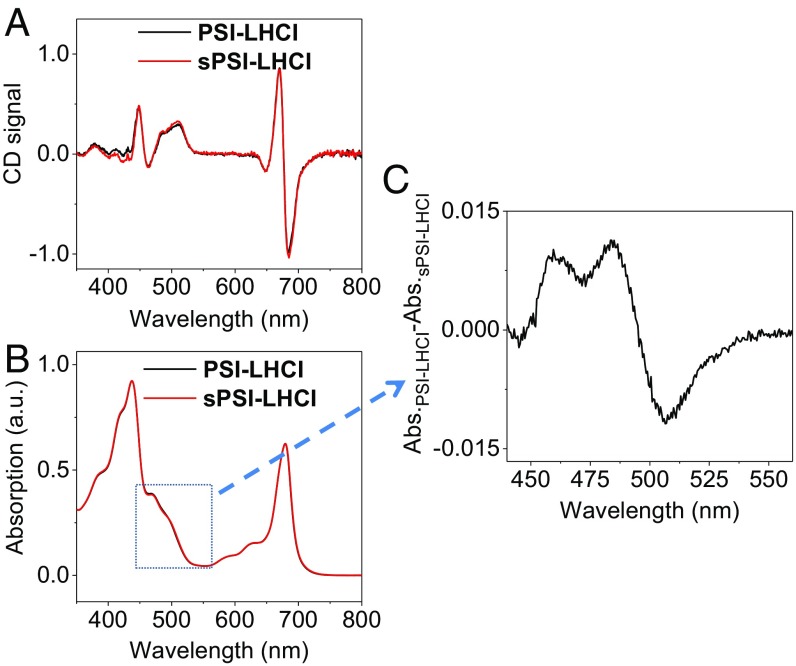
Fig. 1A shows that the circular dichroism (CD) and absorption spectra of the two complexes are virtually identical in the red region of the spectrum (Fig. 1B), indicating that the Chl composition and organization of the two PSI-LHCI are the same. Pigment analysis shows that their Chl a/b ratio (8.4) is also identical (Table 1), and that sPSI-LHCI contains zeaxanthin (1.65 molecule per complex), whereas this xanthophyll is absent in PSI-LHCI, which instead contains a higher amount of violaxanthin, in line with previous results (22, 23). This difference in carotenoid composition is reflected by the small differences in the blue region of their absorption spectra. The PSI-LHCI minus sPSI-LHCI spectrum (Fig. 2C) is positive at 490 nm, where violaxanthin absorbs, and negative at 505 nm, where zeaxanthin absorbs (24).
Fig. 1.
Steady-state characterization of isolated PSI-LHCI (black) and sPSI-LHCI (red). (A) CD spectra and (B) absorption spectra. In C, the absorbance difference spectrum (PSI-LHCI minus sPSI-LHCI) in the carotenoid region is shown.
Table 1.
Pigment compositions of isolated PSI from WT, HL-stressed WT Arabidopsis thaliana
| Sample | Chl a/b | Chls/cars | N | V | L | Z | β-C | Chl b | Chl a | Tot_Chl* | Tot_car |
| PSI-LHCI | 8.39 ± 0.04 | 4.49 ± 0.01 | 0.70 ± 0.11 | 4.60 ± 0.11 | 10.11 ± 0.00 | N.D. | 19.09 ± 0.13 | 16.51 ± 0.08 | 138.49 ± 0.08 | 155 | 34.50 ± 0.35 |
| sPSI-LHCI | 8.41 ± 0.06 | 4.33 ± 0.03 | 0.56 ± 0.02 | 2.81 ± 0.09 | 10.12 ± 0.22 | 1.65 ± 0.03 | 19.94 ± 0.53 | 16.47 ± 0.11 | 138.53 ± 0.11 | 155 | 35.08 ± 0.89 |
β-C, β-carotene; L, lutein; N, neoxanthin; V, violaxanthin; Z, zeaxanthin. Shown is ±SD. n = 3.
Based on the latest crystal structure (1).
Fig. 2.
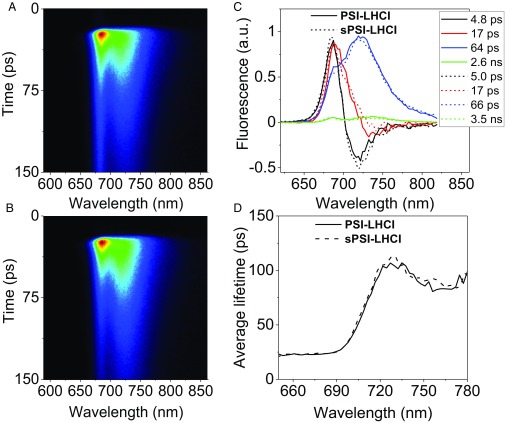
Time-resolved fluorescence measurements of isolated PSI complexes. (A) Streak camera image of isolated PSI from dark-adapted Arabidopsis thaliana (PSI-LHCI) and (B) the one of PSI from HL-stressed Arabidopsis thaliana (sPSI-LHCI). (C) Decay-associated spectra (DAS), which are normalized to their time 0 emission. The corresponding lifetimes are indicated in the figure. (D) Wavelength dependence of the average lifetime calculated excluding the nanosecond process (see main text for explanation).
PSI-LHCI has a very fast excited-state energy relaxation, typically <100 ps, as pointed out by many time-resolved fluorescence studies (e.g., refs. 3, 25, and 26). In higher plants, the overall trapping in PSI cores takes place in ∼18 ps (25, 27), whereas the peripheral antennae slow this process down to ∼48 ps (28, 29). The presence of efficient quenching processes would lead to both a decrease in the excited-state lifetime and to a change in the spectra.
To test the effect of the presence of zeaxanthin on the kinetics of isolated complexes, we performed picosecond time-resolved fluorescence measurement with a streak camera setup on PSI-LHCI and sPSI-LHCI. A broad red emission spectrum (λmax = 735 nm) was recorded for each sample. The images, presented in Fig. 2 A and B, are virtually identical, which indicates the high similarity of the fluorescence kinetics of the two complexes.
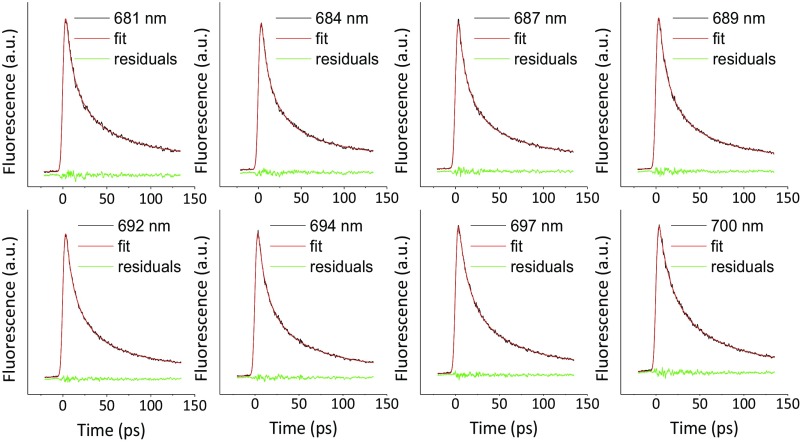
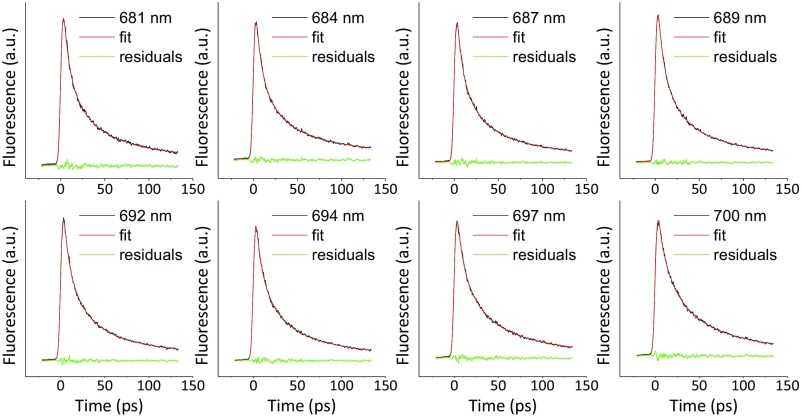
To get more detailed information, the fluorescence decay kinetics of PSI-LHCI and sPSI-LHCI were analyzed globally. Four components with lifetimes of 4.8–5, 17, and 64–66 ps, and a very small amplitude of a nanosecond component, describe the data of both complexes (for the quality of the fitting, see Figs. S2 and S3). The resulting decay-associated spectra (DAS) are shown in Fig. 2C. The results are consistent with previous reports in terms of both spectra and lifetimes (27, 30).
Fig. S2.
Fitting qualities of global analysis for time-resolved fluorescence of PSI-LHCI (measured with streak camera): the decay traces and fittings were shown on top of each other in the same color.
Fig. S3.
Fitting qualities of global analysis for time-resolved fluorescence of sPSI-LHCI (measured with streak camera): the decay traces and fittings were shown on top of each other in the same color.
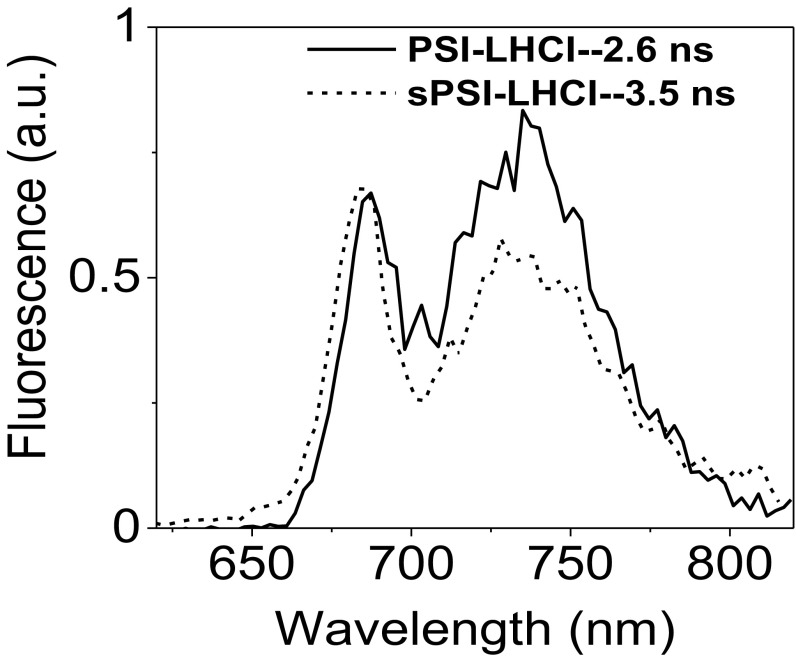
The fast (4.8- to 5.0-ps) component has a conserved DAS with a positive peak around 690 nm and a negative one around 710 nm and to a large extent reflects the energy equilibration between the core complex and antennae. The DAS of 17 ps is positive overall, but it has a dip in the far-red part of the spectrum (∼730 nm). It corresponds to an overall charge separation process from the core pigments (positive peak at 690 nm) at an early stage before the complete equilibration of the system, mixed with a slow (>5-ps) energy transfer from high-energy to low-energy Chl species. The DAS of the 64- to 66-ps component is positive and shows two main peaks at 690 and 723 nm. It represents the main trapping component from the equilibrated system. The nanosecond component, which has a very small amplitude (<3%), has spectra (Fig. S4) and lifetime similar to those of LHCI (28), and it is thus attributed to the presence of a small population of disconnected antenna in the preparation. This is consistent with the change in the relative amplitude of this component in different preparations (27, 28). The average PSI lifetimes are calculated as , and are plotted in Fig. 2D showing that also the wavelength dependence of the average lifetime is identical for the two complexes. In conclusion, both lifetimes and spectra are indistinguishable for PSI-LHCI and sPSI-LHCI, indicating that zeaxanthin does not induce quenching in PSI-LHCI isolated from stressed plants.
Fig. S4.
The DAS of nanosecond component in PSI-LHCI and sPSI-LHCI.
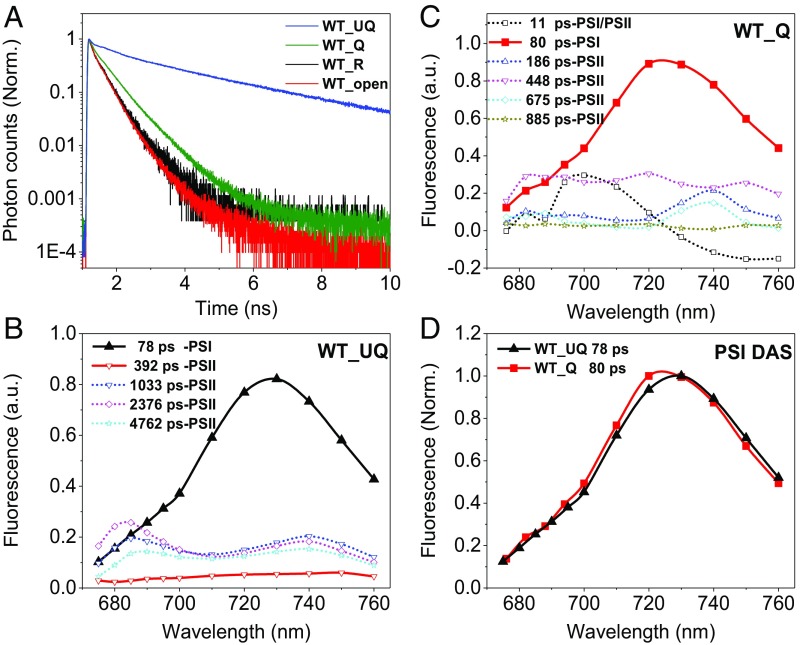
To check whether the same is true in vivo, or whether the presence of other components/factors, especially the protein PsbS, could activate PSI quenching, we measured the PSI kinetics directly on intact leaves under conditions in which the RC of PSII is fully oxidized (closed) but in the absence of NPQ (dark-adapted state WT_UQ, unquenched) or in its presence (actinic light on, WT_Q, quenched) (Fig. 3). These two states correspond to the maximal fluorescence (Fm) measured with PAM in dark (Fm) and light (Fm′), respectively (20). An example of traces detected at 680 nm is shown in Fig. 3A. Clearly, the fluorescence of leaves in quenched state decays much faster than that of the unquenched leaves when PSII is closed. To check the presence of possible photoinhibitory effects induced by the actinic light used to induce quenching, we recorded the kinetics of the leaves when the RCs are reduced (open states corresponding to F0), before (WT_open) and after (WT_R, recovery) the induction of quenching. The overlap between the decay curves indicates that the actinic light did not induce any visible damage.
Fig. 3.
Results of time-resolved fluorescence of leafs from Arabidopsis thaliana in different fluorescence states. (A) Decay-associated spectra (DAS) of leaves in unquenched state (WT_UQ), with the PSII RC closed by DCMU. (B) DAS of leaves in NPQ state (WT_Q). (C) The normalized decay traces at 680 nm and (D) the PSI DAS of 80 ps for the unquenched and quenched states, normalized to their maximum.
The DAS resulting from the global analysis of the data collected at 11 wavelengths in the 675- to 760-nm range (for the quality of the fits, see Fig. S5) are shown in Fig. 3B for the unquenched leaves and in Fig. 3C for the quenched ones. Five components, with lifetimes ranging from 78 ps to 4.8 ns, were resolved for the unquenched leaves, whereas six components with lifetimes from 11 ps to 0.89 ns were needed to achieve a satisfactory fitting for leaves in quenched state. Assignments of these components to PSI or PSII (indicated in the figures) were made based on their spectra and lifetimes as previously reported (19, 31). Unambiguously, the PSI kinetics is reflected by the 80-ps component, which is a typical lifetime for PSI in vivo (31) and has the typical PSI spectrum, characterized by a strong far-red emission especially pronounced because of the unavoidable reabsorption when measuring leaves (32). In both WT_UQ and WT_Q states, the spectra and the lifetimes are virtually identical (Fig. 3D). This would not be the case if the quenching process proposed by Ballottari et al. (18), which occurs at the level of the Lhcas antenna, would be active in leaves as it would lead to a shortening of the lifetime and a blue shift of the spectrum. The results thus clearly indicate that not only zeaxanthin-dependent quenching is not occurring in PSI, but also that PsbS-dependent quenching, which is active in vivo in the conditions used for the measurements, does not affect the lifetime of PSI. NPQ selectively targets PSII, as shown by the dramatic quenching effect on the PSII-related lifetimes (Fig. 3 A–C). Our results are in agreement with previous in vivo measurements (19) that could be satisfactorily fitted without introducing PSI quenching.
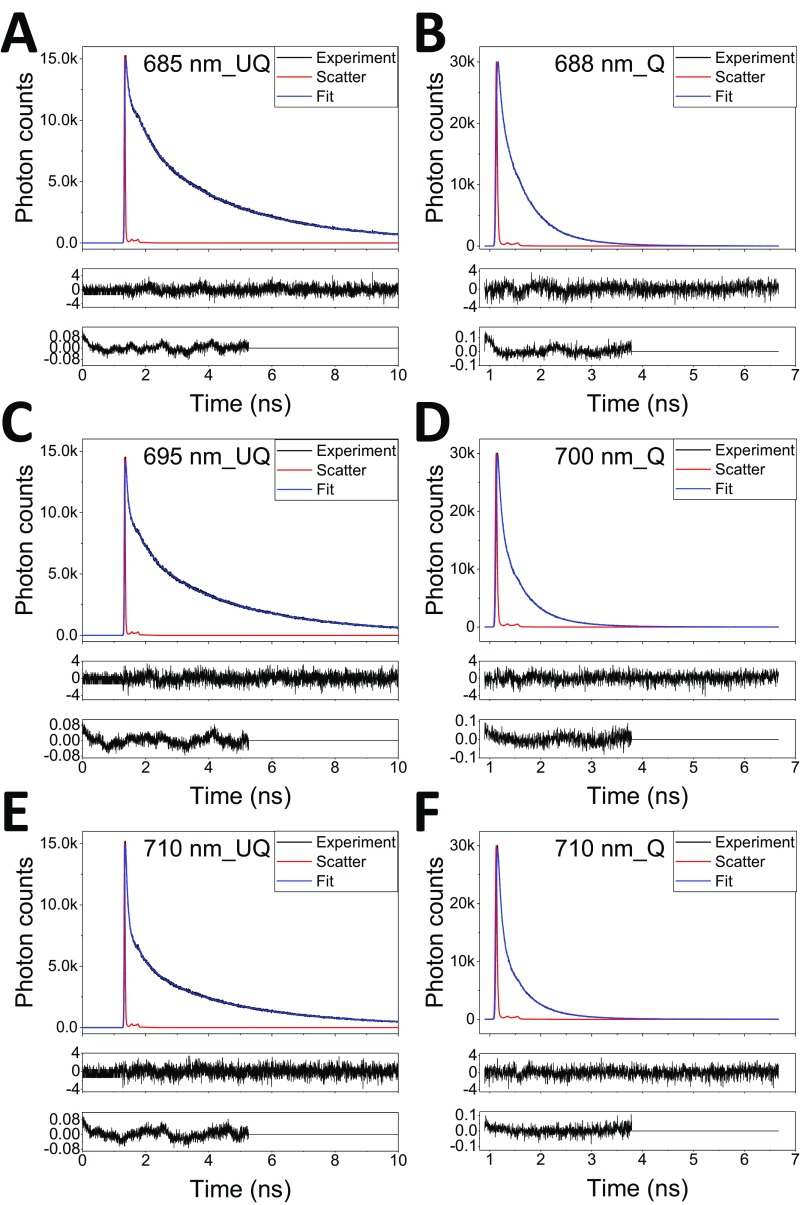
Fig. S5.
The fluorescence decay traces (measured with TCSPC) of intact leaves under UQ (A, C, E) and Q (B, D, F) states and their fits. Three wavelengths were shown as examples; also shown are the residuals and autocorrelations of the fit (see the middle and lowest panel in each subfigure).
If the zeaxanthin quenching in PSI is negligible as shown here, how can the observed sensitivity to HL of PSI in vivo in the absence of this xanthophyll (18) be explained? One possibility is the effect of an unregulated electron flow coming from PSII. NPQ in the npq1 mutant is largely suppressed (16); therefore, an overflow of electrons to PSI might take place, resulting in a damage of its Fe–S centers (10). This is in line with the recent proposal that NPQ and photoinhibition of PSII protect PSI (33). A second possibility is related to the larger antioxidant capacity of zeaxanthin compared with other xanthophylls (34). Indeed, it is known that zeaxanthin accumulated under HL in WT can dramatically reduce photooxidation of proteins and lipids (35) and thus also protect PSI.
In summary, we show that neither in vitro nor in vivo the presence of Zea directly influences the fluorescence kinetics of PSI in HL-exposed WT plants. In addition, the absence of PSI quenching observed in leaves, under conditions in which the PsbS-dependent quenching is active at the level of PSII, also indicates that PSI is not the direct target of this type of quenching.
Materials and Methods
Sample Preparation.
The PSI-LHCI complexes from Arabidopsis thaliana were purified from thylakoid membranes by following the standard methods as described previously (21) (see an example in Fig. S1A). The light stress was performed in the same way as in ref. 21. Both samples were further purified by a second sucrose density gradient, as shown in Fig. S1B. After purification, SDS/PAGE stained with Coomassie brilliant blue was performed as described in ref. 36 to confirm the presence of antennas (Fig. S1C).
Pigment Analysis.
Pigments were extracted from the purified PSI-LHCI complexes with 80% acetone. Chl a/b and Chls/carotenoid ratios were calculated by fitting the absorption spectrum of the pigment extract with the spectra of the individual pigments, and the relative amount of carotenoids was determined by HPLC (details can be found in ref. 21).
CD and Absorption Measurement.
The CD spectra were recorded using a Chirascan-Plus spectropolarimeter (Applied Photophysics) at 20 °C. The OD of the samples was around 0.8 at the maximum of the Qy band with 1-cm light path. Absorption spectra were collected with a Varian Cary 4000 UV-Vis spectrophotometer at room temperature.
In Vitro Time-Resolved Fluorescence Measurement.
Time-resolved fluorescence decay of PSI-LHCI supercomplexes were recorded with a Hamamatsu C5680 synchroscan streak camera, combined with a Chromex 250IS spectrograph. A grating of 50 grooves per mm and blazed wavelength of 600 nm was used with the central wavelength set at 720 nm during the measurement. Each image covers a spectral width of 260 nm (for details, see ref. 37). Excitation light was vertically polarized, the spot size diameter was typically ∼100 μm, and the laser repetition rate was tunable from 10 to 300 kHz.
Excitation wavelength of 400 nm was chosen. The laser repetition rate was set to 250 kHz, and the laser power was set to 100 μW. A time window 1 (∼160 ps) was used. Each measurement contains 25-min CCD exposure time in total. Approximately 1-mL samples with optical density of 2 at 677 nm was measured, which was magnetically stirred in a cuvette (1 cm × 1 cm × 4 cm) with speed of 1,500 rpm.
The averaged image was corrected for background and shading, and then sliced into traces of ∼3-nm width.
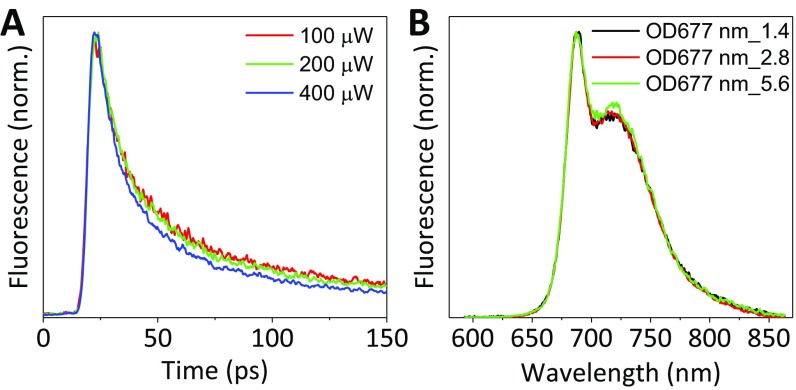
About the time-resolved fluorescence measurement, it is known that annihilation can dramatically accelerate the quenching kinetics (38, 39). Therefore, in our measurements, excitation intensity lower than the annihilation threshold was used (see power-dependent studies in Fig. S6A). Additionally, care was taken to avoid significant reabsorption in the measurements (Fig. S6B).
Fig. S6.
(A) Laser power-dependent decay curves of PSI-LHCI at 680 nm upon 400-nm excitation; (B) reconstructed steady-state fluorescence from streak images of PSI-LHCI that collected with three different concentrations; power-dependent study shows that our measuring conditions are annihilation free (A) and that there is no visible reabsorption (B).
In Vivo Time-Resolved Fluorescence Measurement.
Time-resolved fluorescence measurements on leaves was made using a time-correlated single photon counting (TCSPC) setup as described previously (40) with modifications as described below. The setup consisted of a CW frequency-doubled Nd:YVO4 laser (Verdi V-10; Coherent), which pumped a Ti:sapphire oscillator (Tsunami; Spectra Physics) to produce ultrashort pulses (80 fs) at 820 nm (repetition rate of ∼81 MHz). These pulses were fed into a synchronously pumped Ring-OPO (APE OPO), where parametric amplification and second harmonic generation occurred to deliver 300-fs pulses of a tunable wavelength (530–750 nm). Excitation at 650 nm was used for these measurements to excite Chl b preferentially. The repetition rate was then reduced by a Pulse Picker (Spectra Physics) to 4 MHz. The measurements were done for open (F0, WT_open), closed (Fm, WT_UQ), quenched state (Fm′, WT_Q), and recovered states (WT_R). Detached plant leaves were placed between two glass plates and mounted in the rotation cuvette (diameter, 10 cm; thickness, 1 mm). The cuvette was rotating at 760 rpm and oscillating sideways (78 rpm). Fluorescence was measured in a front-face arrangement from the upper side of the leaves.
-
i)
To measure on leaves with closed PSII RCs (closed state), the leaves were incubated for 12 h in sucrose (0.3 M) with addition of 50 μM 3-(3,4-dichlorophenyl)-1,1-dimethylurea (DCMU). Time-resolved fluorescence decays were measured at 12 detection wavelengths (between 675 and 700 nm with wavelength step of 5 nm, and between 710 and 760 nm with wavelength step of 10 nm). To achieve full closure of the PS II RCs during the measurement, an additional blue LED light of very low intensity (∼50 μmol photons·m−2·s−1) was used to preilluminate leaves just before detection of the signal.
-
ii)
Light adaptation for the Fm′ state was carried out using a mixed array plate of red high-intensity LEDs providing 700 μmol photons·m−2·s−1. Measurements were started after 60 min of illumination after quenching level was stabilized. For closing all PSII RCs under quenched conditions before entering the measuring light an additional blue high-intensity LED was focused on a 1-cm-diameter spot right above the fluorescence excitation laser light pulses (1.5-mm diameter). Time-resolved fluorescence decays were measured at 11 detection wavelengths (between 676 and 700 nm with wavelength step of 6 nm, and between 710 and 760 nm with wavelength step of 10 nm).
-
iii)
To confirm that there was no strong effect of photoinhibition in quenched state, control measurements in open (F0) and recovered (WT_R) states were also done on the leaves used for the Fm′ experiment at PSII emission maxima (682 nm). F0 was measured in complete darkness after dark adaptation overnight before the Fm′ experiment. The excitation power was 20 μW. Preliminary checks with different powers and repetition rates were done to ensure that the PSII RCs were indeed open. The measurements in recovered state were done on the same leaves with the same settings after 1 h in darkness after Fm′ measurement.
To measure DAS for one state per sample took 2–3 h. The measurement time at a single wavelength was limited maximally to 15 min, to avoid changes in the leaves due to prolonged measurement in the rotating cuvette. All in vivo measurements were performed at 20 °C.
Global Analysis of the Time-Resolved Fluorescence Traces.
All time-resolved fluorescence data were globally analyzed with either the R package TIMP-based Glotaran (41) or the “TRFA Data Processing Package” of the Scientific Software Technologies Center (Belarusian State University, Minsk, Belarus) (42). The methodology of global analysis is described in ref. 43. In short, a number of parallel, noninteracting kinetic components was used as a kinetic model, so the total dataset was fitted with function f (t, λ) as follows:
where decay-associated spectra (DASi) is the amplitude factor associated with a decay component i having a decay lifetime τi, and irf(t, ) is estimated during the fitting in the case of streak camera measurement and measured by scattering light in case of TCSPC. Typical FWHM values of the irf were 4.0 ± 0.6 ps for streak and 28 ± 2 ps for TCSPC.
Acknowledgments
This work was supported by De Nederlandse Organisatie voor Wetenschappelijk Onderzoek, Earth and Life Sciences, through a Vici grant and by the European Research Council through European Research Council Consolidator Grant 281341 (to R.C.).
Footnotes
The authors declare no conflict of interest.
This article is a PNAS Direct Submission.
This article contains supporting information online at www.pnas.org/lookup/suppl/doi:10.1073/pnas.1621051114/-/DCSupplemental.
References
- 1.Qin X, Suga M, Kuang T, Shen JR. Photosynthesis. Structural basis for energy transfer pathways in the plant PSI-LHCI supercomplex. Science. 2015;348:989–995. doi: 10.1126/science.aab0214. [DOI] [PubMed] [Google Scholar]
- 2.Mazor Y, Borovikova A, Nelson N. The structure of plant photosystem I super-complex at 2.8 Å resolution. eLife. 2015;4:e07433. doi: 10.7554/eLife.07433. [DOI] [PMC free article] [PubMed] [Google Scholar]
- 3.Croce R, van Amerongen H. Light-harvesting in photosystem I. Photosynth Res. 2013;116:153–166. doi: 10.1007/s11120-013-9838-x. [DOI] [PMC free article] [PubMed] [Google Scholar]
- 4.Savikhin S. Ultrafast optical spectroscopy of photosystem I. In: Golbeck JH, editor. Photosystem I: The Light-Driven Plastocyanin: Ferredoxin Oxidoreductase. Vol 24. Springer; Dordrecht, The Netherlands: 2006. pp. 155–175. [Google Scholar]
- 5.Amunts A, Nelson N. Plant photosystem I design in the light of evolution. Structure. 2009;17:637–650. doi: 10.1016/j.str.2009.03.006. [DOI] [PubMed] [Google Scholar]
- 6.Le Quiniou C, et al. PSI-LHCI of Chlamydomonas reinhardtii: Increasing the absorption cross section without losing efficiency. Biochim Biophys Acta. 2015;1847:458–467. doi: 10.1016/j.bbabio.2015.02.001. [DOI] [PMC free article] [PubMed] [Google Scholar]
- 7.Vass I. Molecular mechanisms of photodamage in the photosystem II complex. Biochim Biophys Acta. 2012;1817:209–217. doi: 10.1016/j.bbabio.2011.04.014. [DOI] [PubMed] [Google Scholar]
- 8.Lubner CE, et al. Solar hydrogen-producing bionanodevice outperforms natural photosynthesis. Proc Natl Acad Sci USA. 2011;108:20988–20991. doi: 10.1073/pnas.1114660108. [DOI] [PMC free article] [PubMed] [Google Scholar]
- 9.Krassen H, et al. Photosynthetic hydrogen production by a hybrid complex of photosystem I and [NiFe]-hydrogenase. ACS Nano. 2009;3:4055–4061. doi: 10.1021/nn900748j. [DOI] [PubMed] [Google Scholar]
- 10.Sonoike K. Photoinhibition of photosystem I. Physiol Plant. 2011;142:56–64. doi: 10.1111/j.1399-3054.2010.01437.x. [DOI] [PubMed] [Google Scholar]
- 11.Scheller HV, Haldrup A. Photoinhibition of photosystem I. Planta. 2005;221:5–8. doi: 10.1007/s00425-005-1507-7. [DOI] [PubMed] [Google Scholar]
- 12.Aro EM, Virgin I, Andersson B. Photoinhibition of photosystem II. Inactivation, protein damage and turnover. Biochim Biophys Acta. 1993;1143:113–134. doi: 10.1016/0005-2728(93)90134-2. [DOI] [PubMed] [Google Scholar]
- 13.Duffy CD, Ruban AV. Dissipative pathways in the photosystem-II antenna in plants. J Photochem Photobiol B. 2015;152(Pt B):215–226. doi: 10.1016/j.jphotobiol.2015.09.011. [DOI] [PubMed] [Google Scholar]
- 14.Rochaix JD. Regulation and dynamics of the light-harvesting system. Annu Rev Plant Biol. 2014;65:287–309. doi: 10.1146/annurev-arplant-050213-040226. [DOI] [PubMed] [Google Scholar]
- 15.Li XP, et al. A pigment-binding protein essential for regulation of photosynthetic light harvesting. Nature. 2000;403:391–395. doi: 10.1038/35000131. [DOI] [PubMed] [Google Scholar]
- 16.Niyogi KK, Grossman AR, Björkman O. Arabidopsis mutants define a central role for the xanthophyll cycle in the regulation of photosynthetic energy conversion. Plant Cell. 1998;10:1121–1134. doi: 10.1105/tpc.10.7.1121. [DOI] [PMC free article] [PubMed] [Google Scholar]
- 17.Slavov C, et al. “Super-quenching” state protects Symbiodinium from thermal stress—implications for coral bleaching. Biochim Biophys Acta. 2016;1857:840–847. doi: 10.1016/j.bbabio.2016.02.002. [DOI] [PubMed] [Google Scholar]
- 18.Ballottari M, et al. Regulation of photosystem I light harvesting by zeaxanthin. Proc Natl Acad Sci USA. 2014;111:E2431–E2438. doi: 10.1073/pnas.1404377111. [DOI] [PMC free article] [PubMed] [Google Scholar]
- 19.Holzwarth AR, Miloslavina Y, Nilkens M, Jahns P. Identification of two quenching sites active in the regulation of photosynthetic light-harvesting studied by time-resolved fluorescence. Chem Phys Lett. 2009;483:262–267. [Google Scholar]
- 20.Baker NR. Chlorophyll fluorescence: A probe of photosynthesis in vivo. Annu Rev Plant Biol. 2008;59:89–113. doi: 10.1146/annurev.arplant.59.032607.092759. [DOI] [PubMed] [Google Scholar]
- 21.Xu P, Tian L, Kloz M, Croce R. Molecular insights into zeaxanthin-dependent quenching in higher plants. Sci Rep. 2015;5:13679. doi: 10.1038/srep13679. [DOI] [PMC free article] [PubMed] [Google Scholar]
- 22.Verhoeven AS, Adams III, Demmig-Adams B, Croce R, Bassi R. Xanthophyll cycle pigment localization and dynamics during exposure to low temperatures and light stress in Vinca major. Plant Physiol. 1999;120:727–738. doi: 10.1104/pp.120.3.727. [DOI] [PMC free article] [PubMed] [Google Scholar]
- 23.Morosinotto T, Baronio R, Bassi R. Dynamics of chromophore binding to Lhc proteins in vivo and in vitro during operation of the xanthophyll cycle. J Biol Chem. 2002;277:36913–36920. doi: 10.1074/jbc.M205339200. [DOI] [PubMed] [Google Scholar]
- 24.Croce R, Weiss S, Bassi R. Carotenoid-binding sites of the major light-harvesting complex II of higher plants. J Biol Chem. 1999;274:29613–29623. doi: 10.1074/jbc.274.42.29613. [DOI] [PubMed] [Google Scholar]
- 25.Engelmann E, et al. Influence of the photosystem I-light harvesting complex I antenna domains on fluorescence decay. Biochemistry. 2006;45:6947–6955. doi: 10.1021/bi060243p. [DOI] [PubMed] [Google Scholar]
- 26.van Oort B, et al. Picosecond fluorescence of intact and dissolved PSI-LHCI crystals. Biophys J. 2008;95:5851–5861. doi: 10.1529/biophysj.108.140467. [DOI] [PMC free article] [PubMed] [Google Scholar]
- 27.Slavov C, Ballottari M, Morosinotto T, Bassi R, Holzwarth AR. Trap-limited charge separation kinetics in higher plant photosystem I complexes. Biophys J. 2008;94:3601–3612. doi: 10.1529/biophysj.107.117101. [DOI] [PMC free article] [PubMed] [Google Scholar]
- 28.Wientjes E, Croce R. The light-harvesting complexes of higher-plant photosystem I: Lhca1/4 and Lhca2/3 form two red-emitting heterodimers. Biochem J. 2011;433:477–485. doi: 10.1042/BJ20101538. [DOI] [PubMed] [Google Scholar]
- 29.Ihalainen JA, et al. Kinetics of excitation trapping in intact photosystem I of Chlamydomonas reinhardtii and Arabidopsis thaliana. Biochim Biophys Acta. 2005;1706:267–275. doi: 10.1016/j.bbabio.2004.11.007. [DOI] [PubMed] [Google Scholar]
- 30.Wientjes E, van Stokkum IH, van Amerongen H, Croce R. The role of the individual Lhcas in photosystem I excitation energy trapping. Biophys J. 2011;101:745–754. doi: 10.1016/j.bpj.2011.06.045. [DOI] [PMC free article] [PubMed] [Google Scholar]
- 31.Miloslavina Y, de Bianchi S, Dall’Osto L, Bassi R, Holzwarth AR. Quenching in Arabidopsis thaliana mutants lacking monomeric antenna proteins of photosystem II. J Biol Chem. 2011;286:36830–36840. doi: 10.1074/jbc.M111.273227. [DOI] [PMC free article] [PubMed] [Google Scholar]
- 32.Gitelson AA, Buschmann C, Lichtenthaler HK. Leaf chlorophyll fluorescence corrected for re-absorption by means of absorption and reflectance measurements. J Plant Physiol. 1998;152:283–296. [Google Scholar]
- 33.Tikkanen M, Mekala NR, Aro EM. Photosystem II photoinhibition-repair cycle protects photosystem I from irreversible damage. Biochim Biophys Acta. 2014;1837:210–215. doi: 10.1016/j.bbabio.2013.10.001. [DOI] [PubMed] [Google Scholar]
- 34.Havaux M, Dall’osto L, Bassi R. Zeaxanthin has enhanced antioxidant capacity with respect to all other xanthophylls in Arabidopsis leaves and functions independent of binding to PSII antennae. Plant Physiol. 2007;145:1506–1520. doi: 10.1104/pp.107.108480. [DOI] [PMC free article] [PubMed] [Google Scholar]
- 35.Johnson MP, et al. Elevated zeaxanthin bound to oligomeric LHCII enhances the resistance of Arabidopsis to photooxidative stress by a lipid-protective, antioxidant mechanism. J Biol Chem. 2007;282:22605–22618. doi: 10.1074/jbc.M702831200. [DOI] [PubMed] [Google Scholar]
- 36.Schägger H. Tricine-SDS-PAGE. Nat Protoc. 2006;1:16–22. doi: 10.1038/nprot.2006.4. [DOI] [PubMed] [Google Scholar]
- 37.Van Stokkum IH, van Oort B, van Mourik F, Gobets B, van Amerongen H. Biophysical Techniques in Photosynthesis. Springer; Dordrecht, The Netherlands: 2008. (Sub)-picosecond spectral evolution of fluorescence studied with a synchroscan streak-camera system and target analysis; pp. 223–240. [Google Scholar]
- 38.Barzda V, et al. Singlet-singlet annihilation kinetics in aggregates and trimers of LHCII. Biophys J. 2001;80:2409–2421. doi: 10.1016/S0006-3495(01)76210-8. [DOI] [PMC free article] [PubMed] [Google Scholar]
- 39.Gruber JM, Chmeliov J, Krüger TP, Valkunas L, van Grondelle R. Singlet-triplet annihilation in single LHCII complexes. Phys Chem Chem Phys. 2015;17:19844–19853. doi: 10.1039/c5cp01806d. [DOI] [PMC free article] [PubMed] [Google Scholar]
- 40.Muller MG, Griebenow K, Holzwarth AR. Primary processes in isolated bacterial reaction centers from Rhodobacter sphaeroides studied by picosecond fluorescence kinetics. Chem Phys Lett. 1992;199:465–469. [Google Scholar]
- 41.Snellenburg JJ, Laptenok SP, Seger R, Mullen KM, van Stokkum IHM. Glotaran: A Java-based graphical user interface for the R package TIMP. J Stat Softw. 2012;49:1–22. [Google Scholar]
- 42.Chukhutsina VU, Büchel C, van Amerongen H. Disentangling two non-photochemical quenching processes in Cyclotella meneghiniana by spectrally-resolved picosecond fluorescence at 77K. Biochim Biophys Acta. 2014;1837:899–907. doi: 10.1016/j.bbabio.2014.02.021. [DOI] [PubMed] [Google Scholar]
- 43.van Stokkum IH, Larsen DS, van Grondelle R. Global and target analysis of time-resolved spectra. Biochim Biophys Acta. 2004;1657:82–104. doi: 10.1016/j.bbabio.2004.04.011. [DOI] [PubMed] [Google Scholar]


