Significance
Cells use chemical signals for intracellular communication in our bodies. Inositol 1,4,5-trisphosphate (IP3) is a chemical signal that binds to the IP3 receptor (IP3R) to release calcium ions from the endoplasmic reticulum. The distance from ligand-binding sites to the channel within IP3R is the longest among known ligand-gated ion channels, and the fundamental question of how IP3-binding physically opens the channel remains unanswered. Here, we solved IP3-bound and unbound structures of large cytosolic domains of the IP3R by X-ray crystallography and clarified the IP3-dependent gating mechanism through a unique leaflet structure. These findings reveal a principle of long-range allosteric coupling in ligand-gated ion channels and provide drug targets for IP3R-regulated events, including autophagy, apoptosis, cancers, and brain disorders.
Keywords: allosteric regulation, calcium channel, IP3 receptor, X-ray crystallography, gating mechanism
Abstract
The inositol 1,4,5-trisphosphate (IP3) receptor (IP3R) is an IP3-gated ion channel that releases calcium ions (Ca2+) from the endoplasmic reticulum. The IP3-binding sites in the large cytosolic domain are distant from the Ca2+ conducting pore, and the allosteric mechanism of how IP3 opens the Ca2+ channel remains elusive. Here, we identify a long-range gating mechanism uncovered by channel mutagenesis and X-ray crystallography of the large cytosolic domain of mouse type 1 IP3R in the absence and presence of IP3. Analyses of two distinct space group crystals uncovered an IP3-dependent global translocation of the curvature α-helical domain interfacing with the cytosolic and channel domains. Mutagenesis of the IP3R channel revealed an essential role of a leaflet structure in the α-helical domain. These results suggest that the curvature α-helical domain relays IP3-controlled global conformational dynamics to the channel through the leaflet, conferring long-range allosteric coupling from IP3 binding to the Ca2+ channel.
A large variety of extracellular signals bind to evolutionarily diverse plasma membrane receptors and converge into the formation of intracellular chemical signals acting on only a few types of intracellular transmembrane receptors. One of these major intracellular receptors is the inositol 1,4,5-trisphosphate (IP3) receptor (IP3R) in the endoplasmic reticulum (ER), which releases calcium ions (Ca2+) from the ER into the cytosol in response to the second messenger IP3 cleaved from phosphatidylinositol 4,5-bisphosphates on G protein-coupled receptor stimulation (1–3). A full-length IP3R gene has been cloned from mouse Purkinje neurons (4), and three isoforms have been identified (2). The brain-dominant type 1 IP3R (IP3R1) regulates long-term potentiation/depression (2, 5–7) and spinogenesis (8), is genetically causative for spinocerebellar ataxia 15 (9, 10) and is implicated in the etiology of Alzheimer’s disease (11, 12) and Huntington’s disease (13, 14). Despite these important roles of IP3R in normal and disease conditions, the basic gating mechanism of how IP3 opens the Ca2+ channel remains elusive.
IP3R genes encode a large cytosolic domain and a small Ca2+ channel domain (2–4). The cytosolic domain contains all of the key functional sites that confer receptor function and regulation, including an IP3-binding core (IBC) (15) and an adjacent amino (N)-terminal suppressor domain (SD) (16) that reduces the affinity of IP3 binding and large regulatory domains responsible for intracellular effector molecules including Ca2+ (17). There have been two proposed models for channel gating by IP3R: direct binding of the IBC/SD domains to the channel domain for gating (18), and long-distance coupling from IBC to the channel, which we proposed in previous structural studies (19, 20). Recent cryo-electron microscopy (cryo-EM) analysis of IP3R (21, 22) has demonstrated that the IBC is ∼70 Å apart from the Ca2+ conducting pore and directly contacts to the C-terminal tail through a long helical bundle connecting to the pore forming the sixth transmembrane helix (S6). How IP3-binding sites physically communicate with the channel at a long distance remains unknown, however.
An early gel filtration study of overexpressed rat IP3R1 cytosolic domain detected an IP3-dependent shift of elution volumes (23), and X-ray crystallography of the IP3-binding domain provided the first glimpse of IP3-dependent conformational changes (24). However, the largest IP3R1 fragment solved to date by X-ray crystallography is limited to the IP3-binding domain including ∼580 residues in IP3R1 (24, 25); thus, the major residual part of the receptor containing more than 1,600 residues in the IP3R cytosolic domain remains unsolved by crystallography, and our understanding of the global conformational changes elicited by IP3 remains incomplete. In the present study, we performed X-ray crystallography of the cytosolic domain and functional analyses of the IP3R channel to explore the long-range allosteric mechanism for channel gating.
Results
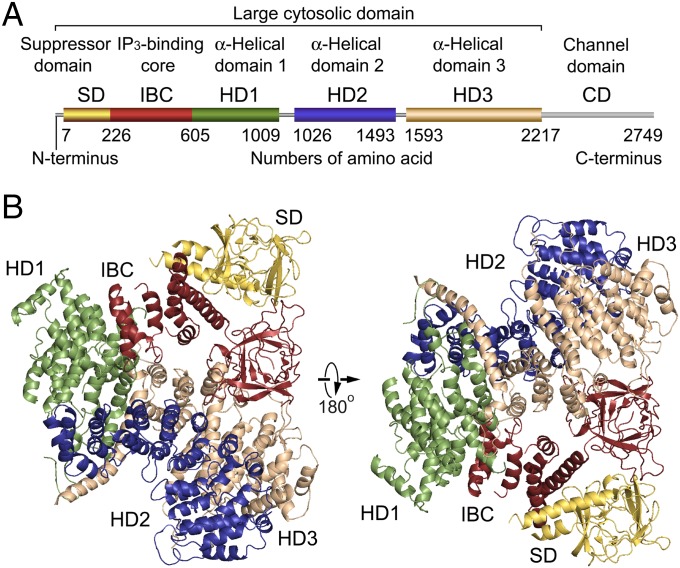
To unveil the structure of the massive cytosolic domain of the IP3R constituting 2,217 amino acid residues, we expressed recombinant IP3R1 truncated with the C-terminal transmembrane domain in insect cells (Fig. 1A) using a baculovirus system (19). The size and monodisperse distributions of purified proteins were determined by size exclusion chromatography and dynamic light scattering (DLS) measurements. A truncated construct produced small crystals in an initial screening, but the resolution of diffraction was insufficient, so we constructed various baculoviruses with other truncations or mutations and subsequently optimized the crystallization conditions. A truncated IP3R1 including 2,217 residues with an R937G mutation (IP3R2217) produced diffracting crystals with a rod shape, and another crystal derived from a truncated IP3R1 including 1,585 residues with an R922G mutation (IP3R1585) formed bipyramidal crystals (Fig. S1). These rod-shaped and bipyramidal crystals were also grown in the presence of IP3. For structure determination, the Cα model by cryo-EM (22) did not provide a definitive solution of molecular replacement using any datasets, indicating differences between the crystal structures and the cryo-EM structure; therefore, the divided domains of the cryo-EM model and the published X-ray structures (25) were used as search models, which allowed phasing of the diffraction data of crystals grown under four different conditions, and X-ray structures of the mouse IP3R1cytosolic domain were obtained using 5.8–7.4 Å datasets (Table S1 and Fig. S2).
Fig. 1.
Global architecture of the IP3R large cytosolic domain. (A) Domain organization. Each domain is depicted in a different color: yellow, suppressor domain (SD; 7–225 amino acid residues); red, IP3-binding core (IBC; 226–604 residues); green, α-helical domain 1 (HD1; 605–1,009 residues); blue, α-helical domain 2 (HD2; 1,026–1,493 residues); tan, α-helical domain 3 (HD3; residues 1,593–2,217); and gray, channel domain (CD; 2,218–2,749 residues). (B) Overall crystal structure of IP3R2217 viewed from two sides. The overall arrangement of domains is consistent with four crystal structures solved using C2221 and P42 crystals (5.8–7.4 Å datasets). The left corresponds to a top view from the cytosolic side with respect to the membrane in the tetrameric IP3R (Fig. S4F).
Fig. S1.
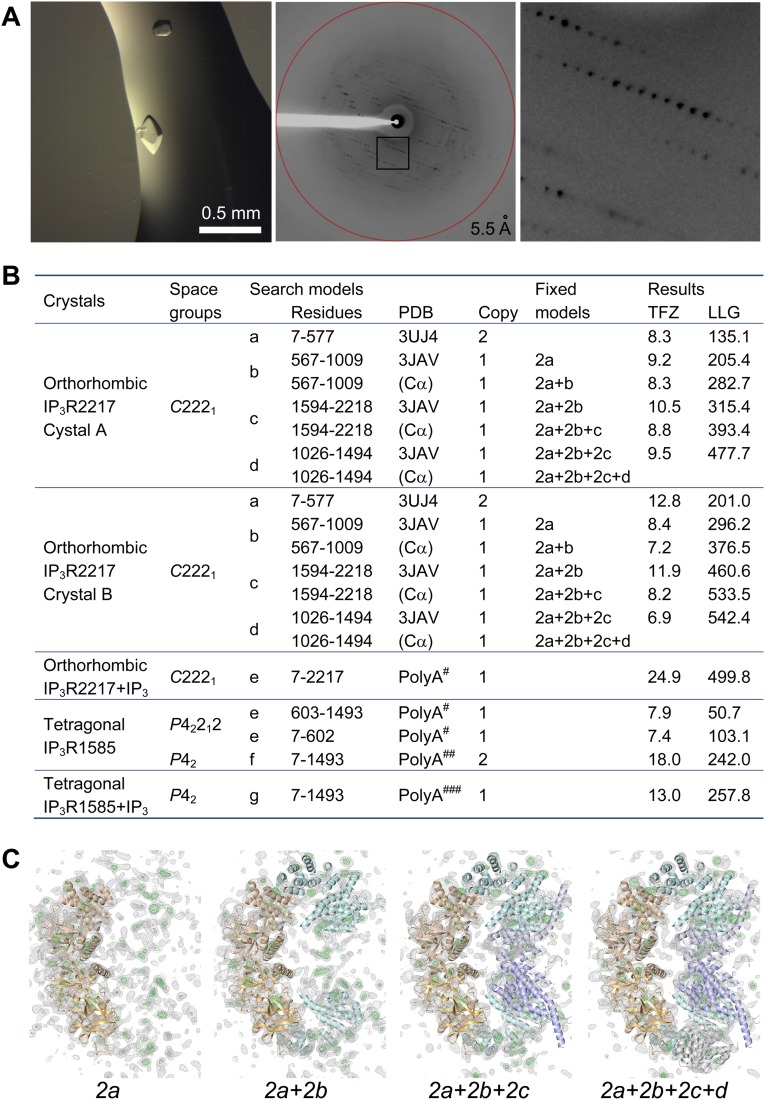
Crystallography of the large cytosolic domain of IP3R. (A) Bipyramidal crystals of IP3R1585 (Left) and an X-ray diffraction image measured from the crystal (Center). (Right) Magnification of the boxed area. (B) Structure determination statistics of IP3R2217 and IP3R1585 by molecular replacement. The polyalanine (PolyA) models refined in the C2221#, P42212##, and P42### crystal lattices were used as search models. (C) Electron density maps in gray (2Fo-Fc, contoured at 1.5 σ) or in green (Fo-Fc, contoured at 3.0 σ), calculated from molecular replacement of the C2221 dataset using each search model presented in the upper table. Note that the residual electron density outside the search model was visible in 2Fo-Fc and Fo-Fc maps. LLG, log-likelihood gain; TFZ, translation function z-score.
Table S1.
Data collection and refinement statistics
| Statistic | IP3R1585 | IP3R1585 + IP3 | IP3R2217 | IP3R2217 + IP3 |
| Data collection | ||||
| Space group | Tetragonal P42 | Tetragonal P42 | Orthorhombic C2221 | Orthorhombic C2221 |
| Cell dimensions | ||||
| a, b, c, Å | 128.16, 128.16, 369.48 | 126.80 126.80 367.78 | 212.50, 221.72, 318.45 | 211.98, 223.48, 319.86 |
| α, β, γ,° | 90.0, 90.0, 90.0 | 90.0, 90.0, 90.0 | 90.0, 90.0, 90.0 | 90.0, 90.0, 90.0 |
| Resolution, Å | 48.81–5.81 (6.02–5.81) | 48.54–6.21 (6.43–6.21) | 49.1–7.31 (7.57–7.31) | 49.43–7.40 (7.66–7.40) |
| Rmerge | 0.17 (0.57) | 0.19 (0.57) | 0.20 (0.57) | 0.29 (0.57) |
| Total reflections | 171,665 (12,882) | 138,503 (10,144) | 120,772 (8,365) | 111,355 (8,282) |
| Unique reflections | 16,347 (1,614) | 13,068 (1,269) | 10,668 (1030) | 10,397 (1,023) |
| Completeness, % | 99.8 (99.3) | 99.6 (97.0) | 99.4 (98.7) | 99.4 (98.8) |
| Multiplicity | 10.5 (8.0) | 10.6 (8.0) | 11.3 (8.1) | 10.7 (8.1) |
| Mean <I/σ(I)> | 9.27 (2.22) | 8.21 (2.18) | 10.50 (2.31) | 6.94 (2.17) |
| Wilson B-factor, Å2 | 59.41 | 56.26 | 162.72 | 106.52 |
| CC1/2 | 0.997 (0.167) | 0.971 (0.154) | 0.993 (0.141) | 0.978 (0.258) |
| CC* | 0.999 (0.537) | 0.993 (0.517) | 0.998 (0.498) | 0.994 (0.641) |
| Refinement | ||||
| Resolution, Å | 48.81–5.81 (6.18–5.81) | 48.54–6.20 (6.70–6.22) | 49.15–7.31 (8.04–7.31) | 49.49–7.40 (8.01–7.40) |
| No. of reflections | 16,347 (2,562) | 13,069 (2,491) | 10,669 (2,487) | 10,397 (2,414) |
| Completeness, % | 99.9 (94.8) | 99.6 (94.9) | 99.9 (99.5) | 99.9 (99.5) |
| Rwork | 0.289 (0.215) | 0.360 (0.268) | 0.317 (0.331) | 0.353 (0.373) |
| Rfree | 0.347 (0.271) | 0.382 (0.311) | 0.394 (0.410) | 0.415 (0.398) |
| No. of atoms | 14,983 | 15,198 | 16,948 | 17,307 |
| Protein | 14,983 | 15,150 | 16,948 | 17,259 |
| Ligand/ion | 48 | 48 | ||
| Protein residues | 2,504 | 2,514 | 3,418 | 3,441 |
| B factors, Å2 | 23.7 | 174.1 | 170.7 | 52.1 |
| Protein | 23.7 | 174.1 | 170.7 | 52.0 |
| Ligands | 174.1 | 72.2 | ||
| rmsd | ||||
| Bond lengths, Å | 0.017 | 0.019 | 0.009 | 0.015 |
| Bond angles, ° | 1.86 | 1.98 | 1.50 | 2.29 |
| Ramachandran plot* | ||||
| Allowed/outliers, % | 92.6/7.4 | 91.2/8.8 | 91.9/8.1 | 92.9/7.1 |
Molprobity statistics were calculated using the Phenix refinement program.
The highest-resolution shell is shown in parentheses.
Fig. S2.
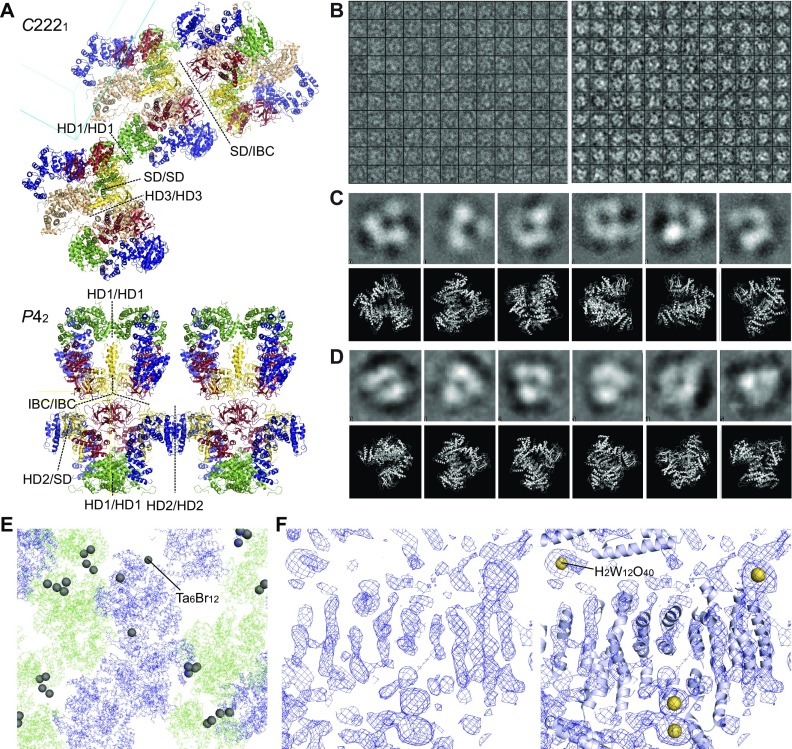
Crystallographic analyses and validations of IP3R2217 and IP3R1585. (A) Ribbon representations of IP3R2217 in the C2221 crystal lattice (Upper) and IP3R1585 in the P42 crystal lattice (Lower). The contacts between adjacent molecules are shown by dotted lines. Cyan and yellow lines indicate axes of unit cells. (B) Boxes (180 Å × 180 Å) showing the IP3R2217 particles picked from a cryo-EM micrograph obtained on a JEM-2100F microscope (Left) and micrograph of negative-stained IP3R obtained on an FEI Tecnai 12 electron microscope (Right). The mean particle diameter of negatively stained particles was 140 ± 13 Å (n = 19). (C and D) Characteristic class averages of cryo-EM images (C) and negative-stained particles (D) are shown in the upper rows, and the lower rows show obtained crystal structures, manually fitted to each class average. (E) Experimental phasing using heavy atom clusters. Heavy atom sites (Ta6Br12) in the C2221 crystal determined by SAD. (F) A density modified map solved by MR-SAD experimental phasing with H2W12O40 tungsten clusters (Left), and our model superimposed with the map as a reference (Right).
The crystal structure of the large cytosolic domain of IP3R2217 is composed of five domains: an N-terminal SD, IBC, and three curvature α-helical domains 1–3 (HD1–3) (Fig. 1B). The distance from the IP3-binding site, to the edge of HD3 domain was ∼70 Å, consistent with previous reports (19, 22, 26). The α-helices of the C-terminal side of IBC continues to the HD1 domain, and interfaces formed with 737–748 residues of the HD1 domain made a contact with proximal edge of HD2, and another interface consisting of 749–791 residues in the HD1 domain contiguously connected with the N-terminal side of HD3 of 1,593–1,687 residues. The packing of the IP3R2217 and IP3R1585 in the crystal showed several contacts between adjacent molecules through each domain in the asymmetric unit (Fig. S2A). The overall structure spanning ∼120 Å in diameter is consistent with electron microscopy findings for negatively stained and ice-embedded IP3R2217 (Fig. S2 B–D), and similar to a large protruding domain in negative-staining EM observations of tetrameric IP3R (19, 26). Experimental phasing with heavy atom clusters also support our IP3R2217 model (Fig. S2 E–F).
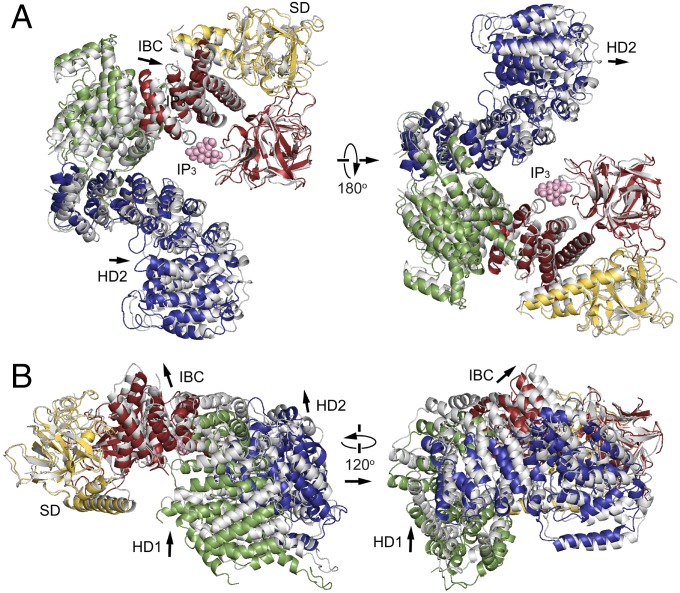
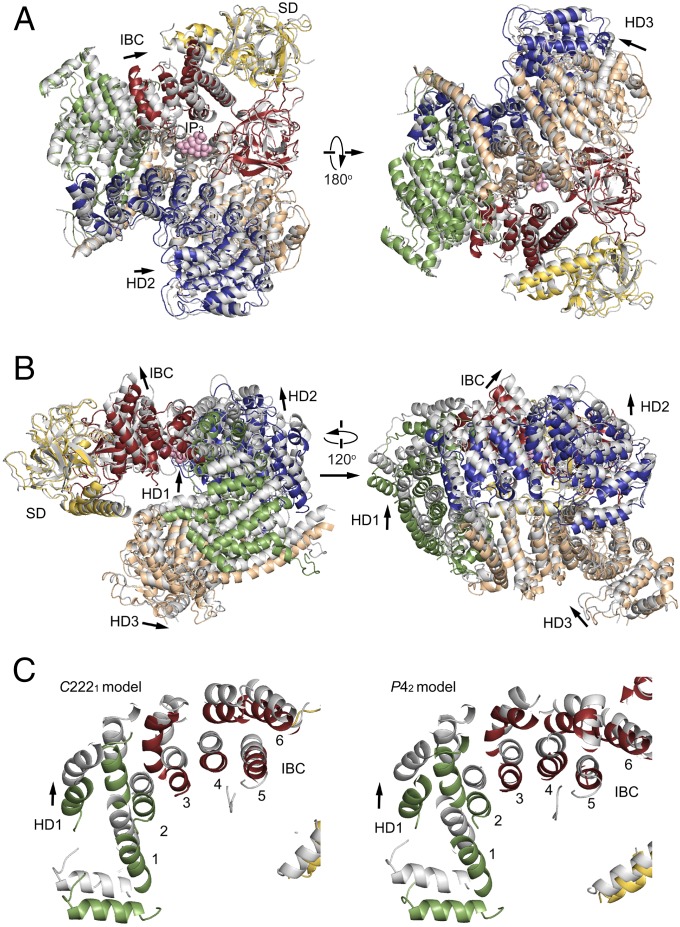
To investigate the effect of IP3 on global receptor conformation, we solved structures using both IP3R1585 and IP3R2217crystals grown in the absence or presence of IP3 (Figs. 2 and 3 and Figs. S3 and S4). A comparison of IP3R1585 structures in the absence and the presence of IP3 reveals significant changes in the domain arrangements; thus, we measured the rotational angle and shift of HD1 and HD2 in the IP3R1585 crystal structures (Fig. 2 A and B). Superposition by fitting two β domains (7–430 residues) shows that the HD1 domain was rotated ∼9° about a P437 residue (8.7° in chain A of two chains in the asymmetry unit, 9.1° in chain B of two chains in the asymmetry unit) and the resultant shift was ∼10 Å (10.0 Å in chain A, 10.4 Å in chain B) as measured by L670 residues. The HD2 domain also rotated 3–4° (3.1° in chain A, 3.9° in chain B), and the shift was ∼5 Å (4.7 Å in chain A, 5.1Å in chain B) as measured by L1449 residues.
Fig. 2.
IP3-mediated rotation of HD1 about the IP3-binding site. (A) Comparison of IP3R1585 structures in the absence of IP3 (colored) with one in the presence of IP3 (gray). Two structures were superposed by fitting of the N-terminal β-domain (7–-430 residues). (B) Side views of these two crystal structures. IP3 molecules are in pink, and arrows indicate the direction of domain relocations by IP3.
Fig. 3.
Long-range conformational changes in the large cytosolic domain by IP3. (A) Comparison of IP3R2217 structures in the absence of IP3 (colored) and in the presence of IP3 (gray). Two structures were superposed by fitting of the N-terminal β-domain (7-430 residues). (B) Side views of the two crystal structures. IP3 molecules are in pink, and arrows indicate the direction of domain relocations by IP3. (C) The helical arrangements (helices 1–6) at transitional regions from IBC to HD1 of IP3R2217 (Left) and IP3R1585 (Right) were viewed from an IP3-binding site.
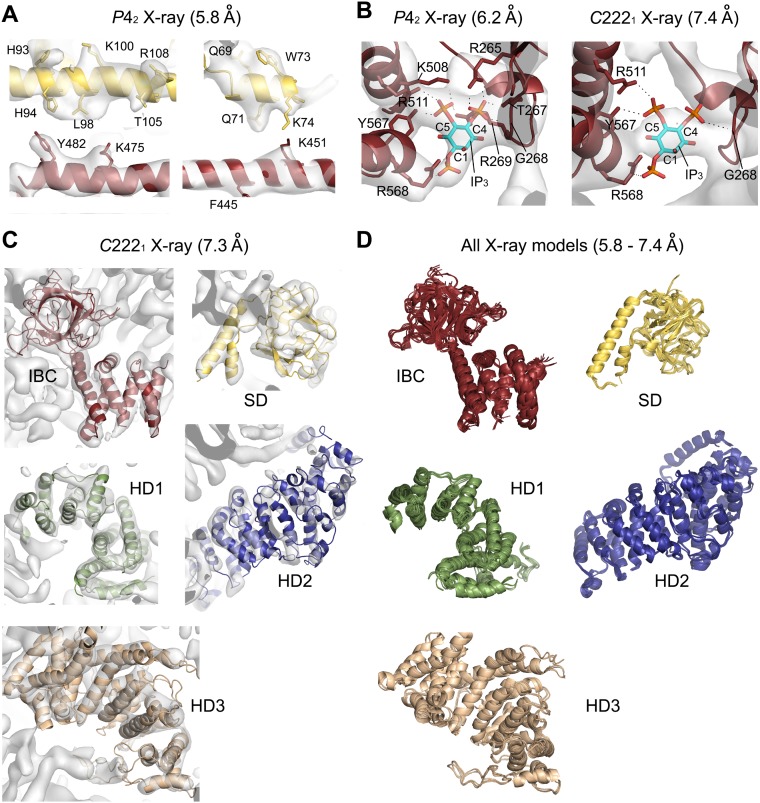
Fig. S3.
Representative electron density maps and models as revealed by X-ray crystallography using 5.8–7.4 Å datasets. (A) The phased 5.8 Å diffraction dataset showing a 2Fo-Fc map contoured at 1.5 σ fitted with amino acid side chains in four helices of SD and IBC domains. (B) The bound IP3 molecules and hydrogen bonds from surrounding amino acid residues in the IBC of the 6.2 Å model (chain B) and the 7.4 Å model (chain A). The real-space correlation coefficients (RSCCs) of IP3 in the chain A and B calculated from the 6.2 Å dataset were 0.72 and 0.87, respectively, and the RSCC sof IP3 in the chain A and B calculated from the 7.4 Å dataset were 0.76 and 0.71, respectively. The 2Fo-Fc map is contoured at 1.0 σ. (C) Ribbon models of IP3R2217determined with the 7.3 Å dataset superimposed on the corresponding 2Fo-Fc map (gray) contoured at 1.5 σ. (D) All eight ribbon models in both chain A and chain B refined with 5.8, 6.2, 7.3, and 7.4 Å datasets (IBC, SD, HD1, and HD2) and all HD3 models in the chain A and B superimposed. The color coding of domains is similar to that in Fig. 1.
Fig. S4.
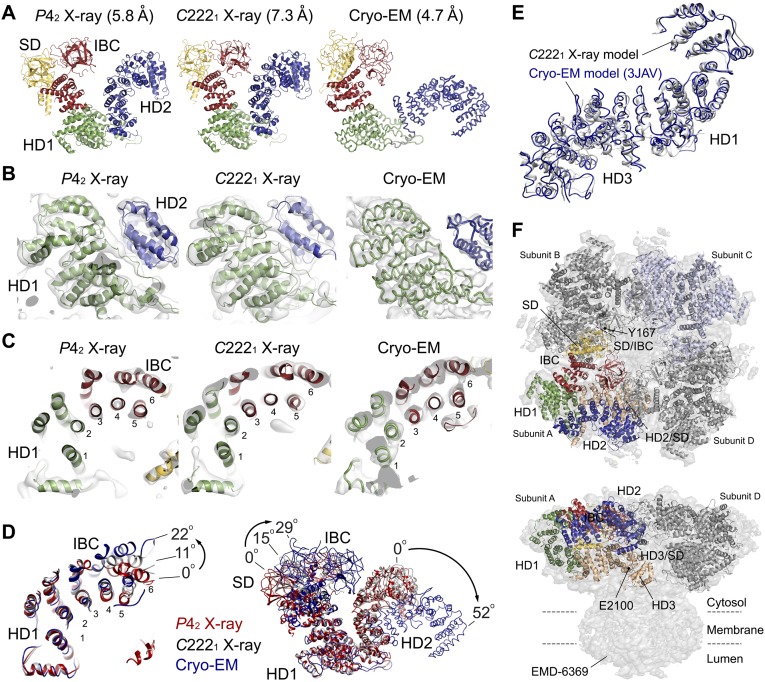
Comparison of domain arrangements in three models determined by X-ray crystallography and the cryo-EM analysis. (A) Arrangement of four domains in our models refined by P42 (5.8 Å) and C2221 (7.3 Å) datasets, and a cryo-EM model determined by 4.7 Å (PDB ID code 3JAV). Polyalanine or side chain-placed models are depicted in ribbon models, whereas the Cα modeled region in the cryo-EM model is presented in a cartoon loop model. (B) The electron density maps and models around a domain interface between HD1 and HD2 in P42 and C2221 models and the cryo-EM model. (C) The helices and corresponding maps in a continuous region between IBC and HD1 in P42 and C2221 models, and the cryo-EM model. The electron density map phased by X-ray models is presented by a 2Fo-Fc map contoured by 1.5 σ, and a cryo-EM map obtained by single-particle analysis (EMD-6369) is contoured by 5.0 σ. (D) Comparison of the helical regions in IBC and HD2 (Left) and four domains (Right) in X-ray models and the cryo-EM model. The P42 chain A (red), C2221 chain A (gray), and cryo-EM chain A (blue) models fitted by superimposing the HD1 domain. (Left) Angles of IBC rotation measured between two F445 residues in helix 6 of IBC about Y633. (Right) Angles of IBC rotation measured between two Y167 residues about Y633, and the rotation of HD2 measured between the L1449 (L1450 in the cryo-EM model) residues about Q749. The angle between HD2 domains of P42 and C2221 models was 2.9° about Q749. (E) The X-ray model of the large curvature helical domains comprising HD1 and HD3, which is refined with the 7.3 Å dataset, superimposed on a cryo-EM model (3JAV) determined at 4.7 Å. (F) Docking of IP3R2217 crystal structures into the IP3R1 tetramer IP3R2217 molecules superposed on the top (Upper) and side (Lower) views of the rat IP3R1 tetramer model constructed by cryo-EM using the Coot program package. Critical residues (Y167 and E2100) are dotted, and subunit interfaces are indicated by dotted lines.
To further confirm the IP3-mediated conformational changes, we compared crystal structures of IP3R2217 in the absence and presence of IP3 (Fig. 3 A and B). Superposition by fitting two β domains (7–430 residues) shows that the HD1 domain rotated ∼7° (7.2° in chain A, 6.8° in chain B) about P437, and the resultant shift was 8–9 Å (8.8 Å in chain A, 8.5 Å in chain B) as measured by L670 residues. The HD3 domain also rotated 3–5° (5.0° in chain A, 3.9° in chain B) about P437, as measured by I1600 residues, and shifted 4–7 Å by IP3 (6.8 Å in chain A, 4.9 Å in chain B). The HD2 domain rotated 1–2° (2.3° in chain A, 1.4° in chain B) about P437 and shifted 2–3 Å (3.1 Å in chain A, 2.0 Å in chain B) as measured by L1449 residues. The direction of HD1 rotation by IP3 in the IP3R2217 was clockwise as viewed from the IP3-binding site, and this rotation occurred with holding helical arrangements (helices 1–6) within the transitional region between IBC and HD1, in which rotational direction was consistent with that in IP3R1585 (Fig. 3C). The difference around the IP3-binding site of IP3R1585 (Fig. 2) from IP3R2217 (Fig. 3) could be interpreted by domain relocations (Fig. S4D) without changes in the core conformation of each structural domain (Fig. S3D).
To assess an important region for IP3R function, we estimated interfaces of domains and subunits using our crystal structure and the previous cryo-EM model (22). The subunit interface was formed between SD and IBC, and a critical tyrosine residue (Y167) (27), which is required for IP3R function but not for IP3-binding, faced to the interface, suggesting that the subunit interface should be essential for IP3R function (Fig. S4F). The SD also formed subunit interfaces with HD2 and HD3, suggesting that these could have some functional roles as well. The HD3 domain contains an α-helical repeat structure including a putative Ca2+ sensor glutamate residue (E2100) (28) located at the loop in a helix–loop–helix fold, consistent with the structure including a conserved glutamate residue (E4032) in the rabbit RyR1 (29, 30). This glutamate residue was located near the interface (Fig. S4F), which is formed by the characteristic long helix of SD. However, our previous study showed that deletion of this helix (67–108 residues) had no effect on IP3R function (27), indicating that this interface contributes a structural rather than functional role, and thus other interfaces should be considered.
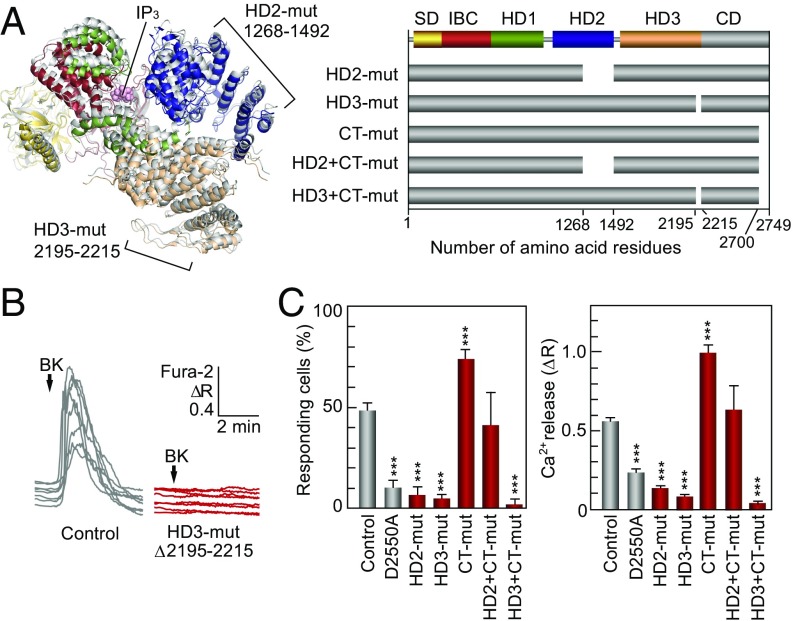
To search for a new structural pathway involved in channel gating, we analyzed the Ca2+ release activity of full-length mouse IP3R1 mutants lacking the parts of the HD2 and HD3 domains (HD2-mut: Δ1,268–1,492, and HD3-mut: Δ2,195–2,215) that are most distal from IBC and proximal to the domain/subunit interfaces (Fig. 4A), and C-terminal 50 residues that directly bind to IBC unveiled by cryo-EM (CT-mut: Δ2700–2749). The HD2 and HD3 mutant receptors (HD2- and HD3-mut) showed a significant loss of function as judged by a positive and a negative control (Fig. 4 B and C). This finding is in sharp contrast with the deletion of CT-mut, which showed no decrease but instead a significant increase of IP3R function at low concentrations of bradykinin (BK) (Fig. 4C and Fig. S5C). Furthermore, we constructed double mutants (HD2+CT-mut and HD3+CT-mut in Fig. 4A) to further examine the functions of these regions. The double mutation with HD2 and CT showed intact IP3R function, whereas the double mutation with HD3 and CT resulted in complete loss of function (Fig. 4C). These results clearly indicate that HD3 is the most essential of these three regions for IP3R function. Our results also suggest that HD2 and CT have regulatory roles, but not essential roles, in line with previous data for a mutant lacking 249 residues in HD2 of mouse IP3R1 (31) or a mutant lacking 33 residues in CT of rat IP3R1 (32). These domains likely can facilitate isoform-specific regulation because of the low sequence homology in these areas among IP3R isoforms.
Fig. 4.
Essential role of HD3 on IP3R channel gating. (A) Two regions deleted in mutants lacking1,268-1,492 residues in HD2 domain and 2,195–2,215 residues in HD3 domain are depicted in the IP3R2217 crystal structure (Left), and our prepared deletion mutants are schematized (Right). (B) The 0.3-nM BK-evoked Ca2+ release from the ER was measured in Neuro2a cells under a nominally Ca2+-free condition. Typical responses of eight cells transfected with full length IP3R1 (control) or with HD3-mut (Δ2195–2215) were presented in the differences of Fura-2 ratio. (C) Bar charts summarizing the relative population ± SEM (%) of 0.3 nM BK responding cells calculated from data of more than four independent experiments (Left) and the amplitude of [Ca2+]i increase ± SEM (ΔR) calculated from data of more than 30 cells in (Right) (control, n = 326; D2550A, n = 183; HD2-mut, n = 121; HD3-mut, n = 228; CT-mut, n = 244; HD2+CT-mut, n = 35; HD3+CT-mut, n = 96). A Ca2+-conducting pore mutant (D2550A) served as a negative control (50). The significance of multiple comparisons was estimated by Dunnett’s method. ***P < 1 × 10⁻⁵.
Fig. S5.
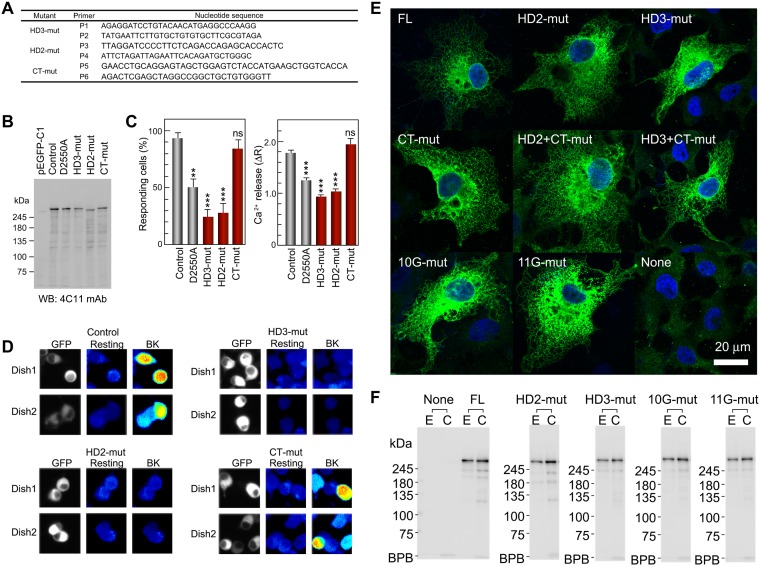
Construction and expression/function analyses of truncated IP3R channels. (A) Primers for construction of IP3R1 mutants. Table lists forward primers (P1, P3, and P5) and reverse primers for the amplification of inserts as described in Methods. (B) Expression of recombinant IP3R1 in Neuro2a cells. Each lane of a 5% SDS/PAGE gel was applied with lysate of cells transfected with pEGFP-C1, EGFP-IP3R1 (control), EGFP-IP3R1Δ2195–2215 (HD3-mut), EGFP-IP3R1Δ1268–1492 (HD2-mut), and EGFP-IP3R1Δ2700–2749 (CT-mut). The relative amount of endogenous IP3R1was negligible compared with overexpressed IP3R1. (C) The 1 nM BK-evoked Ca2+ release from the ER was measured in Neuro2a cells under nominal Ca2+ free conditions. The bar charts summarize the relative population ± SEM (%) of 1 nM BK-responding cells calculated from the data of more than four independent experiments (Left) and the amplitude of [Ca2+]i increase ± SEM (ΔR) calculated from the data of more than 40 cells (Right). The significance of multiple comparisons was estimated by Dunnett’s method. ***P < 0.001; **P = 0.0017. (D) Typical images of [Ca2+]i measurements of control (Upper Left), HD3-mut (Upper Right), HD2-mut (Lower Left), and CT-mut (Lower Right) using Neuro2a cells cultured in two different dishes (Dish1/2). In each panel, the left images show GFP fluorescence and the middle and right images show F340/F380 ratios, with thermal pseudocolor coding before and after stimulation with 0.3 nM BK, respectively. Note that [Ca2+]i in cells transfected with control or CT-mut plasmids was increased by 0.3 nM BK, but was not increased in cells transfected with HD3-mut or HD2-mut plasmids. (E) Confirmation of ER targeting of IP3R1 mutants carried out in accordance with our previous studies, using COS-7 cells. Note that characteristic reticular distribution support deletion and substitution mutants were suitably targeted to the ER. (F) Binding abilities with ConA-Sepharose, confirming that the deletion and substitution mutants should be glycosylated. Lane E, 1% Triton X-100 extracts of COS-7 cells; lane C, ConA-Sepharose–bound fractions. The IP3R was detected by 4C11.
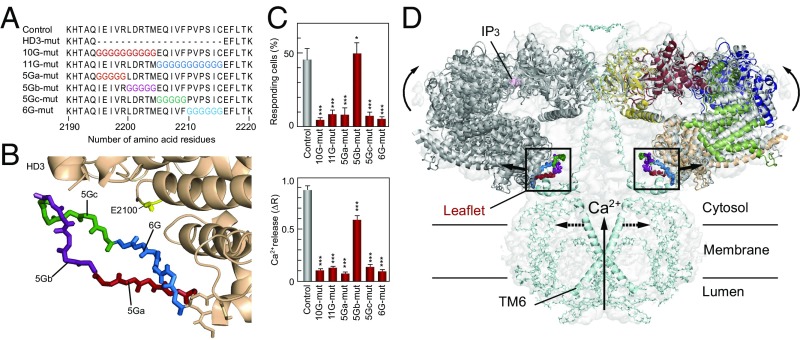
To verify our findings for the HD3 domain, we constructed six kinds of glycine substitution mutants (Fig. 5 A and B and Fig. S6). First, we divided the leaflet structure from 2,195–2,215 amino acid residues into the two parts (2,195–2,294 and 2,295–2,215 residues) and constructed 10 glycine substitutions (10G-mut) and 11 glycine substitutions (11G-mut) and examined their function. Both 10G-mut and 11G-mut activities were disrupted, confirming our conclusion that this leaflet structure is required for IP3R function (Fig. 5C). Next, we further divided the leaflet into five or six amino acid residues and constructed four glycine substitution mutants (Fig. 5 A and B). The IP3R activities of three of these mutants (5Ga-, 5Gc-, and 6G-mut) were significantly reduced, and only 5Gb-mut retained IP3R function (Fig. 5C). These data indicate two discontinuous sections, consisting of 2,195–2,199 residues and 2,205–2,215 residues, which are essential for IP3R function.
Fig. 5.
Critical sites in HD3 responsible for channel gating. (A) Amino acid sequences represent our mutated sites in which 10–11 amino acid residues (10G- and 11G-mut) or 5–6 amino acid residues (5Ga-, 5Gb-, 5Gc-, and 6G-mut) were substituted for glycine residues. (B) Mutated sites in the IP3R2217 crystal structure: 5Ga-mut, red; 5Gb-mut, purple; 5Gc-mut, green; and 6G-mut, blue. A critical glutamate residue, E2100, is shown in yellow. (C) Bar charts summarizing the relative population ± SEM (%) of 0.3 nM BK responding cells calculated from data of more than seven independent experiments (Left) and the amplitude of [Ca2+]i increase ± SEM (ΔR) calculated from data of more than 50 cells (Right) (control, n = 167; D2550A, n = 58; 10G-mut, n = 137; 11G-mut, n = 90; 5Ga-mut, n = 171; 5Gb-mut, n = 144; 5Gc-mut, n = 163; 6G-mut, n = 149). The significance of multiple comparisons was estimated by Dunnett’s method. *P = 0.0139; ***P < 0.001. (D) Model for IP3-dependent gating mechanism of IP3R. Two opposing IP3R2217 molecules are delineated by superimposing in the cryo-EM map (EMD-6369). Color codes of domains and critical sites in the leaflet structure are the same as in Figs. 1 and 3. The Ca2+ conducting pore formed with the transmembrane helix and the C-terminal region (light blue) were prepared according to coordinates of rat IP3R1 (PDB ID code 3JAV). We propose that IP3-dependent global conformational changes and gating transmission by the leaflet structure work in concert to open the channel pore (dotted lines).
Fig. S6.
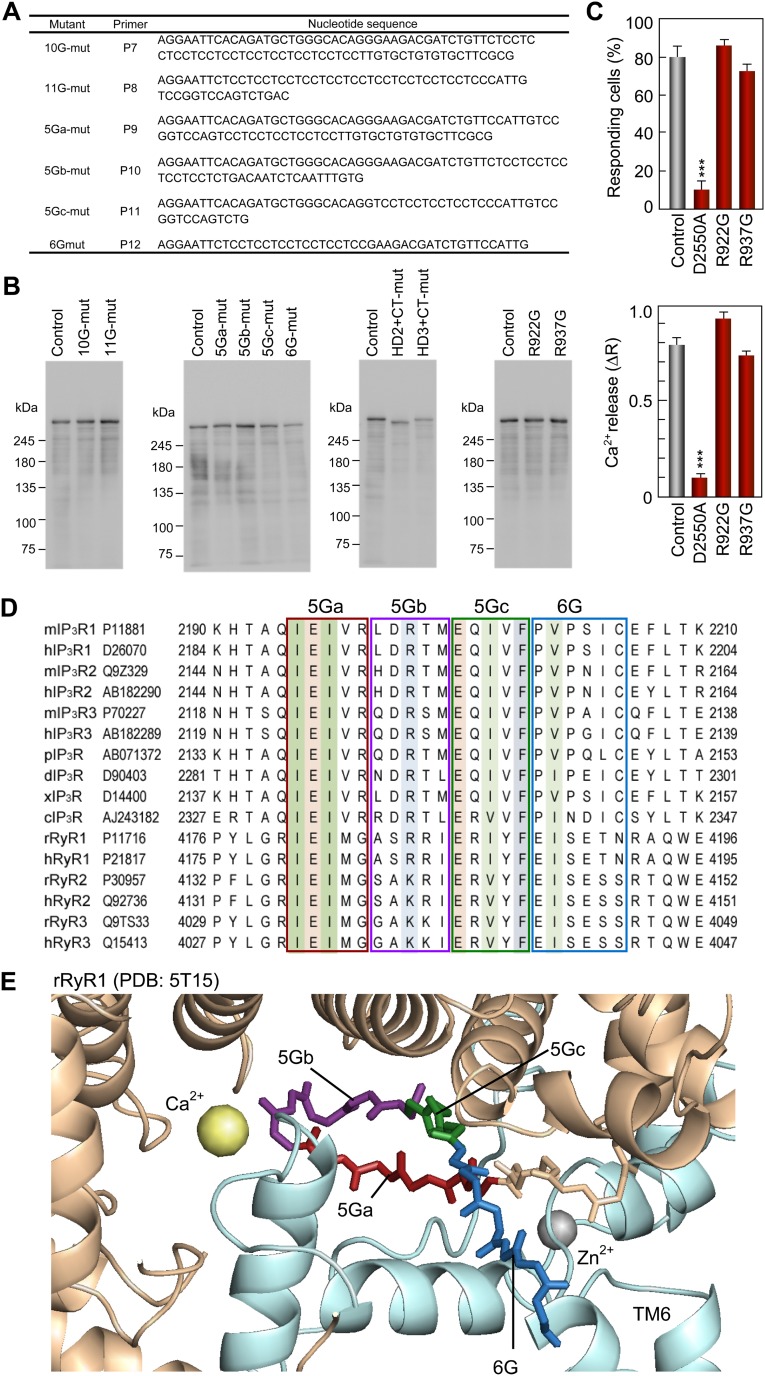
Construction and function/expression analyses of glycine substitution mutants, and highly conserved amino acid sequences in the leaflet structure. (A) Primers for construction of substitution mutants. The table lists forward primers (P7–P12). (B) Expression of recombinant IP3R1 mutants in Neuro2a cells confirmed by Western blot analysis using a 4C11 monoclonal antibody. (C) The 0.3 nM BK-evoked Ca2+ release from the ER measured in Neuro2a cells under nominal Ca2+-free conditions. The bar charts summarize the relative population ± SEM (%) of 0.3 nM BK-responding cells calculated from the data of more than six independent experiments (Left) and the amplitude of [Ca2+]i increase ± SEM (ΔR) calculated from the data of more than 100 cells (Right). The significance of multiple comparisons was estimated by Dunnett’s method. ***P < 0.0001. (D) Sequences of IP3R and RyR isoforms of mouse (m), human (h), Xenopus (x), Drosophila (d), starfish (p), and Caenorhabditis elegans (c) around the leaflet structure aligned using the Clustal X program. Conserved branched chain amino acids, glutamates, basic amino acids, and phenylalanine residues are colored in green, orange, blue, and gray, respectively. GenBank accession numbers and residue numbers of each sequence are shown. (E) Atomic structure around the leaflet region of rabbit RyR1 modeled by high-resolution cryo-EM analyses (PDB ID code 5T15). The amino acid residues corresponding to the 5Ga, 5Gb, 5Gc, and 6G regions mutated in this study are colored red, purple, green, and blue, respectively. The channel domain of rabbit RyR1 and the leaflet-containing helical domain are colored blue and tan, respectively.
Discussion
The mechanism of how IP3 opens the Ca2+ channel in the IP3R has remained elusive because of difficulties associated with the long distance between IP3-binding sites and the Ca2+ channel. Our present study reveals long-range conformation changes of the IP3R cytosolic domain from the IP3-binding site to the channel domain, consisting of more than 2,000 amino acid residues, in response to IP3, and also clarifies that IP3R function requires a small leaflet structure containing only 21 amino acid residues, located at the most distal location of the IP3-binding site. Therefore, we conclude that an IP3-dependent conformation change is transmitted from IBC to the channel through HD1 and HD3 containing the leaflet region (Fig. 5D). Mutation analyses of the leaflet region have unveiled essential roles not only of residues facing the cytosolic domain, but also of residues facing the channel domain; thus, the double-edged sides of the leaflet are involved in relaying IP3-dependent conformational status from the large cytosolic domain to the channel pore.
Our study is a crystallographic analysis demonstrating that a local IP3-binding event by several amino acid residues coordinating with IP3 molecule spreads to the entire large cytosolic architecture. The most conspicuous conformational change was caused by relocation of HD1 with respect to the N-terminal β-domains in both IP3R2217 and IP3R1585 crystals, and it is notable that this domain rotated about a transition point from the β-structure to the α-structure in the IBC. Furthermore, this rotation about the pivot point determines the position of the HD3 domain that connects to the Ca2+ channel domain. In SD/IBC domains, the α-helical region of IBC slightly moves closer to the β-domains by anticlockwise rotation as viewed from the top, and it rotates toward the top along a vertical axis in a clockwise direction as viewed from the IP3-binding site, in line with previous studies about the SD/IBC domains (24, 25). These two directions reflect the horizontal and vertical movement of HD1 in IP3R2217 and IP3R1585 (Figs. 2 and 3), which should affect HD3 relocation along the horizontal direction in which HD3 domains become more distal from the fourfold axis in the tetrameric IP3R (Fig. 5D). Consequently, the motion of leaflet region could shift the pore-forming TM6 helix to open the Ca2+ pore (dotted line in Fig. 5D).
In the tetrameric IP3R1, the globular β-domain of SD interacts with the β-domain of IBC of a neighboring subunit through the Y167-containing interface (Fig. S4F), which constructs the ring arrangement eight globular β-domains at the top of the IP3R (22, 25), consistent with the RyR (29, 33–35). We suggest that this β-domain ring serves as a fixed end of the large cytosolic domain to enable efficient gating transmission from IP3 to the channel. The reason why Y167 mutation can disrupt IP3R function despite its long distance from the channel may be elucidated by the instability of the β-domain ring and the resulting inaccuracy of gating transmission. Fan et al. (22) proposed that the channel activation by IP3 would occur by the direct coupling of the C terminus with IBC (N-C coupling) and by the coupling of SD to an armadillo repeat domain 3 (ARM3)/intervening lateral domain (ILD) of neighboring subunits (SD-ARM3-ILD). Our present functional data support the SD-ARM3-ILD pathway rather than N-C coupling; however, the SD long helix (67–108 residues) contacting with ARM3 is not essential for IP3R function, as revealed by our previous study (27). Therefore, we propose a new pathway from IBC to the leaflet/ILD regions through the HD1 and HD3 domains (IBC-HD1-HD3-leaflet). This pathway is structurally supported by IP3-dependent conformational changes (Fig. 5D). Our structural comparison with crystal structures and the cryo-EM structure revealed two aspects within the subunit conformation: an immobile arrangement of curvature helical structure consisting of the HD1 and HD3 domains, consistent with the cryo-EM model (Fig. S4E), and variable arrangements of HD2 in relation to HD1, shown by the large difference between our crystal structures and the cryo-EM structure (Fig. S4 A–D), and variable placements of IBC relative to HD1, shown by the difference between IP3R1585 and IP3R2217 (Fig. S4 A, C, and D). During IP3-dependent channel activation, the former architecture would act as a rigid body conducting a torque from IP3-binding sites to the channel domain, whereas the flexible regions would contribute to the dynamic properties of the IP3R. Despite the apo state of IP3R, the spatial relationship between IBC and HD1 was found to be variable; interestingly, this area contains a pivotal locus responsible for IP3-binding. Therefore, the dynamic nature around the IP3-binding site provides a plausible conformational landscape for ligand-dependent conformational selection.
The sequence alignment of IP3R and RyR indicates that the equivalent leaflet region in the RyR intervenes to the Ca2+- and Zn2+-binding sites in the 3D structure revealed by a recently reported cryo-EM study (36) (Fig. S6 D and E), suggesting integrative roles of this region underlying channel activation. Considering that the RyR Ca2+-binding pocket is common with IP3R (36), and that Ca2+ regulates IP3R (17) in a similar manner to RyR, the contact of the leaflet to the Ca2+-binding site suggests Ca2+-dependent activation of leaflet-mediated gating transmission and/or leaflet-mediated activation of Ca2+ binding. The functional role of Zn2+ ions in IP3R remains largely unknown, but our previous mutagenesis study demonstrated a complete loss of IP3R function with a C2610 or a C2613 mutation (31), corresponding to the zinc-finger motif of RyR2 (37); thus, the intervening leaflet presumably can mediate structural and functional coupling between the Ca2+- and Zn2+-binding sites. In particular, here we found that the 5Ga region, but not the 5Gb region, closely faces the helix bridging between these sites and contains highly conserved isoleucine (I2195), glutamate (E2196), and isoleucine (I2197) residues in IP3R of all isoforms and various animals (Fig. S6 D and E). Thus, these residues are candidates for mediating gating transmission to the channel domain. The deletion of the leaflet-containing region had no effect on IP3-binding affinity and cooperativity (31), thus the IP3-dependent conformational change should occur independently of the mutations within the leaflet. Therefore, the reason for defects in the IP3-mediated motion of TM6 helices in the mutants is that the leaflets of 5Ga and 5Gc/6G mutants could not physically connect with the helix bridging between the Ca2+- and Zn2+-binding sites and the helix in HD3, respectively. To our knowledge, this mechanistic insight is our original model of IP3-dependent long-range communication from the IP3-binding site to the channel through the large helical architecture including HD1, HD3, and the leaflet, providing strategies for further study and drug development of the IP3R.
Methods
Expression and Purification of IP3R1585 and IP3R2217.
All baculoviruses were amplified in Spodoptera frugiperda (Sf-9) insect cell lines, harvested, and infected into insect cells for expression as described previously (19), following the manufacturer’s protocol (Life Technologies). Insect cells were incubated at 27 °C for 2 d after being infected with IP3R1585- or IP3R2217-encoding baculoviruses and then harvested by centrifugation at 1,500 rpm in a table-top centrifuge (model 8420; Kubota), washed with 3 volumes of ice-cold PBS at least twice, frozen in liquid nitrogen, and stored at −80 °C in a Revco freezer (Thermo Fisher Scientific). The IP3R1585 and IP3R2217 proteins were purified as described previously (19, 38), with modifications. Baculovirus preparation and protein purification are described in more detail in SI Methods.
Crystallization and Data Collection.
Screening of crystallization conditions was performed with the CrystalPro protein crystal imaging system (TriTek). Initial crystals were obtained by 96-well sitting drop screens using several lines of screening kits (Qiagen). The first crystals of IP3R1585 and IP3R2217 obtained were ∼10 μm in size and had rice-like and rod-like shapes, respectively. For diffraction experiments, IP3R1585 was diluted with 10 mM Hepes buffer (pH 7.3) containing 150 mM NaCl, 1 mM TCEP, and 0.3 mM IP3 (or without IP3), and crystallization was carried out at 18 °C in hanging drops consisting of 1.5 μL of protein solution (20 mg/mL) and 1.5 μL of reservoir solution. Crystals appeared in the tetragonal space group P42 with two molecules of IP3R1585 in the asymmetric unit. The crystals were grown in lithium sulfate concentrations ranging from 1.45 to 1.8 M in 0.1 M Hepes buffer (pH 7.1–7.5). Crystals reached full size in 2 wk, at which point they were picked with a cryo loop, cryoprotected by increasing glycerol concentrations, and flash-frozen in a liquid nitrogen stream at 100 K. Crystals of IP3R2217 appeared in the orthorhombic space group C2221 with two molecules of IP3R2217 in the asymmetric unit. Cryoprotectants for IP3R2217 crystals were screened using CryoPro (Hampton Research), and glycerol was chosen as a suitable cryoprotectant. The crystals used for diffraction experiments were obtained from 7.5 mg/mL IP3R2217 and grown using sodium citrate as a precipitant at concentrations ranging from 0.5 to 0.7 M in 100 mM imidazole buffer (pH 6.9–8) and 12% (vol/vol) glycerol in the absence and presence of 0.1 mM IP3. Crystals reached full size in 1–4 wk at 22 °C, at which time they were picked with a cryo loop and flash-frozen in a liquid nitrogen stream at 100 K without additional cryoprotectant. Heavy atom derivatives were obtained by soaking crystals in precipitant solutions containing several heavy atoms using Heavy Atom Screens (Hampton Research) and Phasing Kits (Jena Bioscience), and the stability of crystals was evaluated by X-ray diffraction. Full datasets of IP3R2217 crystals soaked in solutions containing 1 mM tantalum bromide clusters (Ta6Br12) and 1 mM tungsten clusters (PW12O40 and H2W12O40) could be collected. Diffraction data were collected using a Mar225 CCD detector at the BL26B1/B2 stations in the RIKEN SPring-8 facility using a mail-in data collection system (39, 40).
Crystal quality was checked by measuring diffraction using a Rayonix MX226HE CCD detector at RIKEN SPring-8 station BL32XU. X-ray diffraction data were obtained from crystals of IP3R2217 (0.19 mm × 0.038 mm), IP3R1585 (0.34 mm × 0.14 mm), and IP3R1585 with IP3 (0.27 mm × 0.1 mm) using a 1.0-Å wavelength, and were processed using HKL2000 (41) and XDS (42). Exposure times were 20, 30, and 25 s/frame for IP3R2217, IP3R1585, and IP3R1585 with IP3, respectively, and the oscillation range was 1.0°.
Structure Determination of the Large Cytosolic Domain.
To prepare a search model for molecular replacement, a polyalanine model of the regulatory domain (585–2,217 amino acids) was built on Cα models of rat IP3R1 (3JAV) (22) using Coot (43). No definitive solution was obtained for either crystal form, however; thus, we divided the polyalanine model into four domains and searched for them or previously solved crystal structures by molecular replacement with the Phaser program (44) in the Phenix suite version 1.9, and obtained definitive solutions for two IBDs (25) and five regulatory domains in the asymmetric unit of the C2221 crystal lattice (Fig. S1B). In each step of molecular replacement, numerous rod-shaped electron densities appeared outside the model in which residual models were precisely placed after additional molecular replacements (Fig. S1C), indicating that the models were correctly placed. After placing seven domains, the resulting map also showed clear electron density in the Fo-Fc map, which allowed placing of the eighth domain. No domains ever clashed with neighboring domains (Fig. S2A), and the contiguous chain traces between domains as well as the electron density maps support the correct locations of the domains. Electron microscopy observation of IP3R2217 and its class average calculated with an EMAN2 program (45) also supported the size and shape of the large cytosolic domain determined by crystallographic analyses (Fig. S2 B–D).
To confirm our model built by molecular replacement, we performed experimental phasing (Fig. S2 E and F) as described in SI Methods. The crystallographic refinements (Table S1) were carried out using the phenix.refine program (46) in the Phenix 1.10 software package (47). This experiment is described in detail in SI Methods.
Ca2+ Imaging.
Neuro2a cells (American Type Culture Collection; CCL-131) were seeded in 3.5-cm glass-bottom dishes and cultivated for 1 d in 2 mL of DMEM containing 10% (vol/vol) FBS, 100 U/mL penicillin, and 100 μg/mL streptomycin, and then transfected with plasmids for wild-type or mutant full-length IP3R using FuGENE (Promega) as described previously (14, 48, 49). At 1 d after transfection, Fura 2-AM was loaded into Neuro2a cells by incubation with 5 μM Fura 2-AM in balanced salt solution containing 115 mM NaCl, 5.4 mM KCl, 2 mM CaCl2, 1 mM MgCl2, 20 mM Hepes, pH 7.4, and 10 mM glucose for 30 min at room temperature. Then Ca2+ imaging was performed using an inverted fluorescence microscope with a 20× objective lens (S Fluor 20×, NA 0.75; Nikon) and AQUACOSMOS (Hamamatsu Photonics) to obtain F340/F380 ratio images as described previously (14, 48, 49). To monitor Ca2+ release from the ER, Neuro2a cells were perfused with Ca2+-free BSS for 2 min immediately before [Ca2+]i measurements.
Recombinant IP3R1, which was expressed as an EGFP-fusion protein, was prepared using several primers (Figs. S5 and S6). The HD3-mut (Δ2,195–2,215) was constructed by replacing a PCR product amplified with P1 and P2 primers into the BamHI and EcoRI sites of pcDNA3.1/Zeo(+)/EGFP-IP3R1 (Fig. S5). The HD2-mut (Δ1,268–1,492) and CT-mut (Δ2,700–2,749) mutants were constructed by inserting a PCR product amplified with P3/P4 and P5/P6 primers into pcDNA3.1/Zeo(+)/EGFP-IP3R1 through the BamHI/BamHI and SbfI/XhoI sites, respectively (Fig. S5). Double mutants (HD2+CT- and HD3+CT-mut) were constructed by combining two mutants. All substitution mutants (10G-, 11G-, 5Ga-, 5Gb-, 5Gc-, and 6G-mut) were constructed by replacing PCR products amplified with P7–P12 primers into the BamHI and EcoRI sites of pcDNA3.1/Zeo(+)/EGFP-IP3R1 (Fig. S6).The pore mutant D2550A (50) was prepared using the Stratagene QuikChange Kit and used as a negative control. The deletion and point mutations were confirmed by sequence analysis using an ABI 3730xl automatic sequencer (Applied Biosystems). Expression of the full-length IP3R1 was confirmed by Western blot analysis and by the fluorescence of GFP in the living cells (Fig. S5 B and D). Also confirmed were the targeting and distribution of these mutants in the ER (Fig. S5E) and glycosylation using ConA-Sepharose (Fig. S5F). [Ca2+]i was measured in GFP+ Neuro2a cells stimulated with 0.3 nM (Figs. 4 and 5 and Fig. S6C) or 1 nM BK (Fig. S5C) under nominally Ca2+-free conditions to evaluate Ca2+ release from the ER through the recombinant IP3R1. The functions of the R922G and R937G mutants were confirmed by plasmids constructed with the mutated fragment and pcDNA3.1/Zeo(+)/EGFP-IP3R1 (Fig. S6 B and C).
SI Methods
Expression and Purification of IP3R1585 and IP3R2217.
The coding sequence of the mouse IP3R1 was cloned into the pFastbac1 baculovirus expression vector (Life Technologies) with a GST and 3C protease cleavage sequence (LEVLFQGP) at the amino terminus. For the construction of IP3R1585, a TGA stop codon was placed after the R1585 codon, terminating translation without the residual carboxyl-terminal domain. For the construction of IP3R2217, the coding sequence of the mouse IP3R1 was cloned into pFastbac1 via an EcoRI digestion site and a TAG stop codon. The ligation mixture was transformed into chemically competent DH5α Escherichia coli cells. Positive cells were selected in LB agar plates containing 100 μg/mL ampicillin, picked, and cultured overnight. We isolated plasmid DNA using NucleoBond plasmid DNA purification kits (Macherey-Nagel), selecting candidates by restriction digestion, and transformed the clones of interest into chemically competent DH10Bac E. coli cells (Life Technologies) for transposition into the bacmid, which was purified by the NucleoBond kit. To improve crystal quality, R922 and/or R937 were mutated to Gly using the QuikChange kit (Stratagene).
For the purification of IP3R1585, frozen cells were thawed at 37 °C in a water bath and mixed with Tris buffer (pH 7.5) containing 2 mM TCEP, 1 mM EGTA-2Na, and protease inhibitors (Roche) and then homogenized in a glass Teflon Potter homogenizer. For the purification of GST-fused IP3R1585, the homogenates were transferred to 50-mL conical tubes and centrifuged at 2,500 × g for 15–30 min at 4 °C in a Tomy MX-300 centrifuge system to remove cell debris and nuclei. The resulting supernatant was mixed with 5 M NaCl to a final concentration of 0.35 M NaCl, applied to glutathione-Sepharose resin (GE Healthcare), and incubated at 4 °C for 30 min on a Taitec RT-50 rotator. Glutathione-Sepharose resins were packed into an econo-column (Bio-Rad), washed with approximately five bed volumes of Tris buffer (pH 7.5) containing 1.0 M NaCl, 1 mM TCEP, 1 mM EGTA-2Na, and 5% (vol/vol) glycerol, and then treated with 2,000 U/mL PreScission protease (GE Healthcare) to remove the GST tag. After overnight incubation at 4 °C, we collected the eluates using two bed volumes of Tris buffer (pH 7.5). The combined eluates were applied onto a Tosoh TSK DEAE-5PW column (78 mm × 7.8 mm i.d.) using the ÄKTA liquid chromatography system (GE Healthcare). The DEAE-5PW column was pre-equilibrated with 20 mM Tris buffer (pH 7.5) containing 150 mM NaCl, 1 mM TCEP, and 5% (vol/vol) glycerol at a flow rate of 0.5 mL/min. The bound proteins were washed with 15 mL of Tris buffer, eluted by 20 column volumes of NaCl linear gradients (150–300 mM NaCl), and distributed into 0.5-mL aliquots into 96-well deep-well plates using a Frac-950 fraction collector (GE Healthcare). For the purification of IP3R2217, we performed DEAE and heparin column chromatography according to previous papers (38). IP3R2217 samples were applied onto a DEAE column (DEAE-650M; Tohso) pre-equilibrated with 50 mM Tris buffer containing 100 mM NaCl, 2 mM TCEP, and 5% glycerol at 4 °C. The IP3R2217-containing fractions were eluted using a linear gradient from 100 to 150 mM NaCl at a flow rate of 2 mL/min. The resultant eluates were applied to a heparin affinity column (GE Healthcare) and washed with Tris buffer and then eluted using a linear gradient from 250 to 600 mM NaCl at a flow rate of 1.5 mL/min. The combined fractions were concentrated by Vivaspin 6 or 20 membranes with a 100-kDa molecular weight cutoff (GE Healthcare), quick-frozen in liquid nitrogen, and stored at −80 °C in a Revco freezer.
Size Exclusion Chromatography and DLS.
We performed size exclusion chromatography on a Tosoh G3000SWXL column (300 mm × 8.0 mm i.d.) pre-equilibrated with 50 mM Tris buffer (pH 7.5) containing 150 mM NaCl and 1 mM EDTA-2Na at a flow rate of 0.4 mL/min using an Agilent HP1100 HPLC system. The samples were injected into the column via a 200-μL loop connected to a Rheodyne injector, and the size of the protein was estimated using gel filtration standard molecules (Bio-Rad). For DLS analysis, the purified IP3R was diluted with 50 mM Tris buffer (pH 7.5) containing 150 mM NaCl and 1 mM EDTA-2Na. The DLS of the resultant proteins (1 mg/mL) filtered by a 0.1-μm Ultrafree-MC filter (Millipore) was measured using a Wyatt DynaPro plate reader at 25 °C. The protein concentrations of the purified IP3R2217 were measured in a Hitachi U-0080D photodiode array spectrophotometer according to the Bradford method, using BSA as a standard.
Electron Microscopy.
Samples were applied onto freshly glow-discharged carbon coated copper grids and blotted off, and a 2% uranyl acetate solution was applied to them for staining and then blotted off and desiccated. All images of negative-stained IP3R2217 were obtained on a Tecnai 12 electron microscope (FEI) equipped with a LaB6 filament and operated at 80 kV using a CMOS camera (TemCam F416; TVIPS). The nominal size of a negatively stained particle was measured by the ImageJ software. For cryo-EM, IP3R2217 was vitrified in a buffer containing 50 mM Tris⋅HCl, pH 7.5, 150 mM KCl, and 1 mM DTT. The 3 μL of 1 mg/mL IP3R solution were applied to freshly glow-discharged holey carbon grids. After preincubation on the grids, samples were blotted with filter paper (Whatman) for 3–3.5 s and then flash-frozen in liquid ethane using a Leica EM GP automatic plunge freezer. The grids were transferred into a JEM-2100F HC scanning electron transmission microscope (JEOL) using a cryo-transfer holder (model 914; Gatan). Images were obtained using the JEM-2100F operated at 200 kV with the specimen maintained at liquid nitrogen temperature and recorded manually using an UltraScan 4K × 4K CCD camera (Gatan) at a nominal magnification of 100,000×. The contrast transfer function (CTF) was corrected, and particles were picked up on micrographs, and reference-free 2D averages were calculated using the EMAN2 software package (45).
Structure Determination of the Large Cytosolic Domain.
To confirm our model built by molecular replacement, we performed experimental phasing. Single-wavelength anomalous dispersion (SAD) method gave a solution with high figure of merit, and a representative result is shown in Fig. S2E. Despite the uninterpretable map, we confirmed that all heavy atom sites were located at the surface of the IP3R2217 proteins in the C2221 lattice, supporting our model. Another support was obtained by SAD combined with molecular replacement (MR-SAD). To avoid model bias, we calculated heavy atom sites using phenix.autosol with phaser_sites_then_phase = True, and we obtained heavy atom sites and an interpretable map, as shown in Fig. S2F. The resultant map shows the outline of two IP3R2217 molecules in the asymmetry unit, several rod-like densities corresponding to α-helices, and eight domains.
The crystallographic refinements were carried out using the phenix.refine program (46) in the Phenix 1.10 software package (47). All atomic B-factors of the polyalanine model were set to 40 Å2 before the first run of rigid body refinement, in which all eight domains were selected as the rigid-body group. The group-B refinement was performed using group selection to specify a group-B for each domain, and in the final step, the B-factor was refined for each residue. Under the refinement cycles, reference model restraints by IBD (PDB ID codes 3UJ4 and 3UJ0) and secondary structure restraints were used. For molecular replacement of tetragonal crystals, the refined model of the IP3R2217 structure was used. Definitive statistics were obtained using the polyalanine models obtained by C2221 datasets in both the P42212 and P42 crystal lattice using crystals grown in the absence or presence of IP3. Therefore, molecular replacement and refinement were initially performed to place domains in the P42212 lattice, in which three domains (IBD, HD1, and HD2) were selected as rigid-body and B-factor groups. The resulting models refined in P42212 were subjected to the P42 dataset and searched two chains by molecular replacement and then refined using a rigid-body group of IBD, HD1, and HD2, followed by refinement of the B-factor for each residue. The IBD region was corrected using published 3UJ4 or 3UJ0 models before the final steps of refinement.
After refinement, the structure was checked, validated, and modified using Coot (43), after which the model was finalized using the phenix refinement program. The IP3-binding pockets were corrected using Coot according to 3UJ0 and 1N4K models. The representative 2Fo-Fc maps of X-ray datasets show numerous well-fitted side chains (Fig. S3A), bound IP3 (Fig. S3B), and α-helices in each domain (Fig. S3C), and all domain structures in refined models of chains A and B were similar (Fig. S3D). Analysis of the P42 data by phenix.xtriage indicated merohedral twining with twin operators of h,-k,-l and twin fractions ranging from 0.38 to 0.48. Thus, twinning operations were used only in the last steps after several refinement cycles using the P42 dataset. The twin fraction was 0.5 for IP3R1585 or IP3R1585+IP3 crystals. The data collection and refinement statistics, including Rmerge, CC1/2, and CC* in Table S1, were calculated using the Phenix 1.10 software package (47).
Statistical Analysis.
The significance of multiple comparisons was estimated by Dunnett’s method using R version 2.11.1 (www.R-project.org). No statistics for predetermining the sample size, no randomization, and no blinding were used.
Acknowledgments
We thank Drs. Yuki Nakamura, Go Ueno, and Masaki Yamamoto for the X-ray diffraction data measurements using the mail-in data collection system at RIKEN SPring-8; Dr. Kyoko Nakamura (Juntendo University) for Ca2+ measurements; Dr. Charles Yokoyama (RIKEN) for editing the manuscript; Kazu Hoshi (JEOL) for performing cryo-EM; and the RIKEN Research Resources Center for the Tecnai12 electron microscope. This study was supported by the Japan Society for the Promotion of Science through Grant-in-Aid for Scientific Research C (Grant 15K06791, to K.H.), Innovative Areas (Brain Protein Aging and Dementia Control) (Grant 15H01572, to K.H.), Encouragement of Scientists (Grant 24926012, to A.T.), Scientific Research S (Grant 25221002, to K.M.), the Japan Science and Technology Agency’s International Cooperative Research Project–Solution-Oriented Research for Science and Technology (K.M.), and a RIKEN Brain Science Institute Grant and President's Fund (to K.M.). Supercomputing resources were provided by the Human Genome Center at Tokyo University and by the Advanced Center for Computing and Communication at RIKEN. Cryo-EM was supported by the Nanotechnology Platform (Project 12024046).
Footnotes
The authors declare no conflict of interest.
This article is a PNAS Direct Submission.
Data deposition: The atomic coordinates and structure factors have been deposited in the Protein Data Bank, www.pdb.org (PDB ID codes 5GUG, 5X9Z, 5XA0, and 5XA1).
This article contains supporting information online at www.pnas.org/lookup/suppl/doi:10.1073/pnas.1701420114/-/DCSupplemental.
References
- 1.Berridge MJ. Inositol trisphosphate and calcium signalling. Nature. 1993;361:315–325. doi: 10.1038/361315a0. [DOI] [PubMed] [Google Scholar]
- 2.Mikoshiba K. IP3 receptor/Ca2+ channel: From discovery to new signaling concepts. J Neurochem. 2007;102:1426–1446. doi: 10.1111/j.1471-4159.2007.04825.x. [DOI] [PubMed] [Google Scholar]
- 3.Patterson RL, Boehning D, Snyder SH. Inositol 1,4,5-trisphosphate receptors as signal integrators. Annu Rev Biochem. 2004;73:437–465. doi: 10.1146/annurev.biochem.73.071403.161303. [DOI] [PubMed] [Google Scholar]
- 4.Furuichi T, et al. Primary structure and functional expression of the inositol 1,4,5-trisphosphate-binding protein P400. Nature. 1989;342:32–38. doi: 10.1038/342032a0. [DOI] [PubMed] [Google Scholar]
- 5.Nishiyama M, Hong K, Mikoshiba K, Poo MM, Kato K. Calcium stores regulate the polarity and input specificity of synaptic modification. Nature. 2000;408:584–588. doi: 10.1038/35046067. [DOI] [PubMed] [Google Scholar]
- 6.Harnett MT, Bernier BE, Ahn KC, Morikawa H. Burst-timing-dependent plasticity of NMDA receptor-mediated transmission in midbrain dopamine neurons. Neuron. 2009;62:826–838. doi: 10.1016/j.neuron.2009.05.011. [DOI] [PMC free article] [PubMed] [Google Scholar]
- 7.Fujii S, Matsumoto M, Igarashi K, Kato H, Mikoshiba K. Synaptic plasticity in hippocampal CA1 neurons of mice lacking type 1 inositol-1,4,5-trisphosphate receptors. Learn Mem. 2000;7:312–320. doi: 10.1101/lm.34100. [DOI] [PMC free article] [PubMed] [Google Scholar]
- 8.Sugawara T, et al. Type 1 inositol trisphosphate receptor regulates cerebellar circuits by maintaining the spine morphology of Purkinje cells in adult mice. J Neurosci. 2013;33:12186–12196. doi: 10.1523/JNEUROSCI.0545-13.2013. [DOI] [PMC free article] [PubMed] [Google Scholar]
- 9.Di Gregorio E, et al. Two Italian families with ITPR1 gene deletion presenting a broader phenotype of SCA15. Cerebellum. 2010;9:115–23. doi: 10.1007/s12311-009-0154-0. [DOI] [PubMed] [Google Scholar]
- 10.Hara K, et al. Total deletion and a missense mutation of ITPR1 in Japanese SCA15 families. Neurology. 2008;71:547–551. doi: 10.1212/01.wnl.0000311277.71046.a0. [DOI] [PubMed] [Google Scholar]
- 11.Cheung KH, et al. Mechanism of Ca2+ disruption in Alzheimer’s disease by presenilin regulation of InsP3 receptor channel gating. Neuron. 2008;58:871–883. doi: 10.1016/j.neuron.2008.04.015. [DOI] [PMC free article] [PubMed] [Google Scholar]
- 12.Mattson MP. Pathways towards and away from Alzheimer’s disease. Nature. 2004;430:631–639. doi: 10.1038/nature02621. [DOI] [PMC free article] [PubMed] [Google Scholar]
- 13.Tang TS, et al. Huntingtin and Huntingtin-associated protein 1 influence neuronal calcium signaling mediated by inositol-(1,4,5) triphosphate receptor type 1. Neuron. 2003;39:227–239. doi: 10.1016/s0896-6273(03)00366-0. [DOI] [PMC free article] [PubMed] [Google Scholar]
- 14.Higo T, et al. Mechanism of ER stress-induced brain damage by IP(3) receptor. Neuron. 2010;68:865–878. doi: 10.1016/j.neuron.2010.11.010. [DOI] [PubMed] [Google Scholar]
- 15.Yoshikawa F, et al. Mutational analysis of the ligand binding site of the inositol 1,4,5-trisphosphate receptor. J Biol Chem. 1996;271:18277–18284. doi: 10.1074/jbc.271.30.18277. [DOI] [PubMed] [Google Scholar]
- 16.Yoshikawa F, Iwasaki H, Michikawa T, Furuichi T, Mikoshiba K. Cooperative formation of the ligand-binding site of the inositol 1,4, 5-trisphosphate receptor by two separable domains. J Biol Chem. 1999;274:328–334. doi: 10.1074/jbc.274.1.328. [DOI] [PubMed] [Google Scholar]
- 17.Finch EA, Turner TJ, Goldin SM. Calcium as a coagonist of inositol 1,4,5-trisphosphate-induced calcium release. Science. 1991;252:443–446. doi: 10.1126/science.2017683. [DOI] [PubMed] [Google Scholar]
- 18.Boehning D, Joseph SK. Direct association of ligand-binding and pore domains in homo- and heterotetrameric inositol 1,4,5-trisphosphate receptors. EMBO J. 2000;19:5450–5459. doi: 10.1093/emboj/19.20.5450. [DOI] [PMC free article] [PubMed] [Google Scholar]
- 19.Hamada K, Terauchi A, Mikoshiba K. Three-dimensional rearrangements within inositol 1,4,5-trisphosphate receptor by calcium. J Biol Chem. 2003;278:52881–52889. doi: 10.1074/jbc.M309743200. [DOI] [PubMed] [Google Scholar]
- 20.Hamada K, Mikoshiba K. Revisiting channel allostery: A coherent mechanism in IP3 and ryanodine receptors. Sci Signal. 2012;5:pe24. doi: 10.1126/scisignal.2003148. [DOI] [PubMed] [Google Scholar]
- 21.Ludtke SJ, et al. Flexible architecture of IP3R1 by cryo-EM. Structure. 2011;19:1192–1199. doi: 10.1016/j.str.2011.05.003. [DOI] [PMC free article] [PubMed] [Google Scholar]
- 22.Fan G, et al. Gating machinery of InsP3R channels revealed by electron cryomicroscopy. Nature. 2015;527:336–341. doi: 10.1038/nature15249. [DOI] [PMC free article] [PubMed] [Google Scholar]
- 23.Mignery GA, Südhof TC. The ligand binding site and transduction mechanism in the inositol-1,4,5-triphosphate receptor. EMBO J. 1990;9:3893–3898. doi: 10.1002/j.1460-2075.1990.tb07609.x. [DOI] [PMC free article] [PubMed] [Google Scholar]
- 24.Lin CC, Baek K, Lu Z. Apo and InsP3-bound crystal structures of the ligand-binding domain of an InsP3 receptor. Nat Struct Mol Biol. 2011;18:1172–1174. doi: 10.1038/nsmb.2112. [DOI] [PMC free article] [PubMed] [Google Scholar]
- 25.Seo MD, et al. Structural and functional conservation of key domains in InsP3 and ryanodine receptors. Nature. 2012;483:108–112. doi: 10.1038/nature10751. [DOI] [PMC free article] [PubMed] [Google Scholar]
- 26.Hamada K, Miyata T, Mayanagi K, Hirota J, Mikoshiba K. Two-state conformational changes in inositol 1,4,5-trisphosphate receptor regulated by calcium. J Biol Chem. 2002;277:21115–21118. doi: 10.1074/jbc.C200244200. [DOI] [PubMed] [Google Scholar]
- 27.Yamazaki H, Chan J, Ikura M, Michikawa T, Mikoshiba K. Tyr-167/Trp-168 in type 1/3 inositol 1,4,5-trisphosphate receptor mediates functional coupling between ligand binding and channel opening. J Biol Chem. 2010;285:36081–36091. doi: 10.1074/jbc.M110.140129. [DOI] [PMC free article] [PubMed] [Google Scholar]
- 28.Miyakawa T, et al. Ca(2+)-sensor region of IP(3) receptor controls intracellular Ca(2+) signaling. EMBO J. 2001;20:1674–1680. doi: 10.1093/emboj/20.7.1674. [DOI] [PMC free article] [PubMed] [Google Scholar]
- 29.Yan Z, et al. Structure of the rabbit ryanodine receptor RyR1 at near-atomic resolution. Nature. 2015;517:50–55. doi: 10.1038/nature14063. [DOI] [PMC free article] [PubMed] [Google Scholar]
- 30.Chen SR, Ebisawa K, Li X, Zhang L. Molecular identification of the ryanodine receptor Ca2+ sensor. J Biol Chem. 1998;273:14675–14678. doi: 10.1074/jbc.273.24.14675. [DOI] [PubMed] [Google Scholar]
- 31.Uchida K, Miyauchi H, Furuichi T, Michikawa T, Mikoshiba K. Critical regions for activation gating of the inositol 1,4,5-trisphosphate receptor. J Biol Chem. 2003;278:16551–16560. doi: 10.1074/jbc.M300646200. [DOI] [PubMed] [Google Scholar]
- 32.Schug ZT, Joseph SK. The role of the S4-S5 linker and C-terminal tail in inositol 1,4,5-trisphosphate receptor function. J Biol Chem. 2006;281:24431–24440. doi: 10.1074/jbc.M604190200. [DOI] [PubMed] [Google Scholar]
- 33.Efremov RG, Leitner A, Aebersold R, Raunser S. Architecture and conformational switch mechanism of the ryanodine receptor. Nature. 2015;517:39–43. doi: 10.1038/nature13916. [DOI] [PubMed] [Google Scholar]
- 34.Zalk R, et al. Structure of a mammalian ryanodine receptor. Nature. 2015;517:44–49. doi: 10.1038/nature13950. [DOI] [PMC free article] [PubMed] [Google Scholar]
- 35.Tung CC, Lobo PA, Kimlicka L, Van Petegem F. The amino-terminal disease hotspot of ryanodine receptors forms a cytoplasmic vestibule. Nature. 2010;468:585–588. doi: 10.1038/nature09471. [DOI] [PubMed] [Google Scholar]
- 36.des Georges A, et al. Structural basis for gating and activation of RyR1. Cell. 2016;167:145–157 e117. doi: 10.1016/j.cell.2016.08.075. [DOI] [PMC free article] [PubMed] [Google Scholar]
- 37.Peng W, et al. Structural basis for the gating mechanism of the type 2 ryanodine receptor RyR2. Science. 2016;354:aah5324. doi: 10.1126/science.aah5324. [DOI] [PubMed] [Google Scholar]
- 38.Maeda N, Niinobe M, Mikoshiba K. A cerebellar Purkinje cell marker P400 protein is an inositol 1,4,5-trisphosphate (InsP3) receptor protein: Purification and characterization of InsP3 receptor complex. EMBO J. 1990;9:61–67. doi: 10.1002/j.1460-2075.1990.tb08080.x. [DOI] [PMC free article] [PubMed] [Google Scholar]
- 39.Ueno G, et al. RIKEN structural genomics beamlines at the SPring-8: High-throughput protein crystallography with automated beamline operation. J Struct Funct Genomics. 2006;7:15–22. doi: 10.1007/s10969-005-9005-5. [DOI] [PubMed] [Google Scholar]
- 40.Okazaki N, et al. Mail-in data collection at SPring-8 protein crystallography beamlines. J Synchrotron Radiat. 2008;15:288–291. doi: 10.1107/S0909049507064679. [DOI] [PMC free article] [PubMed] [Google Scholar]
- 41.Otwinowski Z, Minor W. Processing of X-ray diffraction data collected in oscillation mode. Methods Enzymol Macromol Crystallogr A. 1997;276:307–326. doi: 10.1016/S0076-6879(97)76066-X. [DOI] [PubMed] [Google Scholar]
- 42.Kabsch W. XDS. Acta Crystallogr D Biol Crystallogr. 2010;66:125–132. doi: 10.1107/S0907444909047337. [DOI] [PMC free article] [PubMed] [Google Scholar]
- 43.Emsley P, Lohkamp B, Scott WG, Cowtan K. Features and development of Coot. Acta Crystallogr D Biol Crystallogr. 2010;66:486–501. doi: 10.1107/S0907444910007493. [DOI] [PMC free article] [PubMed] [Google Scholar]
- 44.McCoy AJ. Solving structures of protein complexes by molecular replacement with Phaser. Acta Crystallogr D Biol Crystallogr. 2007;63:32–41. doi: 10.1107/S0907444906045975. [DOI] [PMC free article] [PubMed] [Google Scholar]
- 45.Tang G, et al. EMAN2: An extensible image processing suite for electron microscopy. J Struct Biol. 2007;157:38–46. doi: 10.1016/j.jsb.2006.05.009. [DOI] [PubMed] [Google Scholar]
- 46.Afonine PV, et al. Towards automated crystallographic structure refinement with phenix.refine. Acta Crystallogr D Biol Crystallogr. 2012;68:352–367. doi: 10.1107/S0907444912001308. [DOI] [PMC free article] [PubMed] [Google Scholar]
- 47.Adams PD, et al. PHENIX: A comprehensive Python-based system for macromolecular structure solution. Acta Crystallogr D Biol Crystallogr. 2010;66:213–221. doi: 10.1107/S0907444909052925. [DOI] [PMC free article] [PubMed] [Google Scholar]
- 48.Hamada K, et al. Aberrant calcium signaling by transglutaminase-mediated posttranslational modification of inositol 1,4,5-trisphosphate receptors. Proc Natl Acad Sci USA. 2014;111:E3966–E3975. doi: 10.1073/pnas.1409730111. [DOI] [PMC free article] [PubMed] [Google Scholar]
- 49.Nakamura K, et al. Distinct roles of M1 and M3 muscarinic acetylcholine receptors controlling oscillatory and non-oscillatory [Ca2+]i increase. Cell Calcium. 2013;54:111–119. doi: 10.1016/j.ceca.2013.05.004. [DOI] [PubMed] [Google Scholar]
- 50.Boehning D, Mak DO, Foskett JK, Joseph SK. Molecular determinants of ion permeation and selectivity in inositol 1,4,5-trisphosphate receptor Ca2+ channels. J Biol Chem. 2001;276:13509–13512. doi: 10.1074/jbc.C100094200. [DOI] [PubMed] [Google Scholar]


