Significance
Hypoxia predisposes otherwise healthy individuals to venous thrombosis, but the underlying mechanism has been unclear. Our study revealed a causal role for nucleotide binding domain, leucine-rich-containing family, pyrin domain containing 3 (NLRP3) inflammasome and IL-1β during hypoxia-induced venous thrombosis. We further show a direct association between NLRP3 and hypoxia-inducible factor 1-alpha (HIF-1α) during these conditions. Specific interventions within the hypoxia–HIF-1α–NLRP3–IL-1β axis in the venous milieu significantly reduced venous thrombosis in our animal model. Notably, we also observed modulation of similar pathways in patients diagnosed with altitude-induced venous thrombosis. Our study thus revealed thrombosis at high altitude to be centrally regulated by a complex network of coagulatory and inflammatory processes, critically linked through HIF-1α.
Keywords: thrombosis, hypoxia, HIF-1α, NLRP3 inflammasome, IL-1β
Abstract
Venous thromboembolism (VTE), caused by altered hemostasis, remains the third most common cause of mortality among all cardiovascular conditions. In addition to established genetic and acquired risk factors, low-oxygen environments also predispose otherwise healthy individuals to VTE. Although disease etiology appears to entail perturbation of hemostasis pathways, the key molecular determinants during immediate early response remain elusive. Using an established model of venous thrombosis, we here show that systemic hypoxia accelerates thromboembolic events, functionally stimulated by the activation of nucleotide binding domain, leucine-rich-containing family, pyrin domain containing 3 (NLRP3) inflammasome complex and increased IL-1β secretion. Interestingly, we also show that the expression of NLRP3 is mediated by hypoxia-inducible factor 1-alpha (HIF-1α) during these conditions. The pharmacological inhibition of caspase-1, in vivo knockdown of NLRP3, or HIF-1α other than IL-1β-neutralizing antibodies attenuated inflammasome activation and curtailed thrombosis under hypoxic conditions. We extend the significance of these preclinical findings by studying modulation of this pathway in patients with altitude-induced venous thrombosis. Our results demonstrate distinctive, increased expression of NLRP3, caspase-1, and IL-1β in individuals with clinically established venous thrombosis. We therefore propose that an early proinflammatory state in the venous milieu, orchestrated by the HIF-induced NLRP3 inflammasome complex, is a key determinant of acute thrombotic events during hypoxic conditions.
Epidemiological studies during recent years have unprecedentedly highlighted venous thromboembolism (VTE) as a key comorbidity factor during several life-threatening medical conditions. In addition to clinical complications such as cancer (1), cardiovascular diseases (2), surgery (3), and trauma (4), hypoxia as experienced during ascent to high altitude has emerged as another predisposing factor for VTE (5–8). A significantly higher incidence of deep vein thrombosis and pulmonary embolism (8, 9), portal vein thrombosis (10), cerebral venous thrombosis (11), transient ischemic attacks, and stroke (12) has been observed at high to extreme altitude (13). Despite clinical relevance, a caveat in our basic understanding of early molecular events underlying hypoxia-induced venous thrombosis poses a major bottleneck for effective design of interventional approaches.
Recent studies have highlighted a strong link between hypoxia responses and inflammation, involving activation of multiple cell types including lymphocytes, platelets, and endothelium (14, 15). Plausibly, in addition to direct mechanism involving hypoxia-induced modulation of hemostasis and coagulation factors (5, 16), pleiotropic modalities such as sterile inflammation could be involved. The role of this axis and key mediators in hypoxia-induced hypercoagulation, however, remains to be experimentally validated. The activation of coagulation pathways per se has been shown to promote inflammation in the system (17, 18). This secondary inflammation can engage in a positive feed-forward loop to aggravate the prothrombotic phenotype. Thus, the cause or consequence relationship between inflammation and hypercoagulation during hypoxia remains far from being resolved.
We recently showed that hypobaric hypoxia promotes a prothrombotic propensity through the involvement of a crucial cysteine protease, calpain (19). In continuing work, we blended an unbiased systems-level approach with targeted pharmacological inhibition and in vivo siRNA-mediated knockdown strategies to show that the activation of nucleotide binding domain, leucine-rich-containing family, pyrin domain containing 3 (NLRP3) inflammasome complex augments thrombus formation in response to hypoxia. We reinforced significance of this key preclinical finding from the animal model by demonstrating the activation of the NLRP3 gene in patients, who developed thrombosis at high altitudes. We also present evidence that the activation of this complex is an early response to hypoxia and is critically regulated by hypoxia-inducible factor 1-alpha (HIF-1α).
Results
For all experiments described here, we have used uniform group nomenclature. After inferior vena cava (IVC) ligation (also refer to SI Materials and Methods), the group of animals kept in normal atmosphere conditions was designated as thrombotic (T), whereas the ligated ones kept under simulated hypobaric hypoxia were identified as hypoxia thrombotic (HT). Sham surgery controls kept under normal environmental conditions were designated as normoxic (N), and those kept in simulated hypoxia were identified as hypoxic (H).
Hypoxic Exposure Aggravates Venous Thrombosis, Leading to Fatal Thromboembolic Consequences.
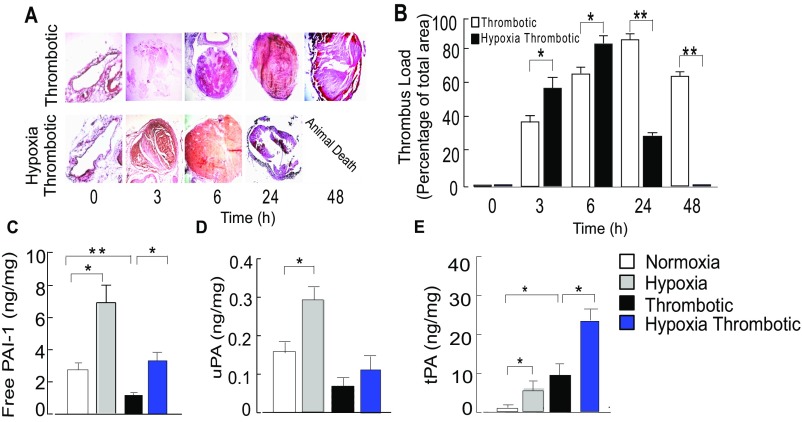
We first established temporal kinetics of thromboembolic events in four groups of animals. In situ examination at various intervals (3, 6, 24, and 48 h) revealed significantly larger thrombus in the HT group (Fig. 1 A and B). Further, thrombus weight peaked earlier in the HT group (6 h). We observed a reduction in thrombus weight (Fig. 1B) with extended hypoxic exposure (≥24 h), along with a higher mortality rate in this group (Fig. 1 C and Fig. S1A). The thrombus from the HT group was denser compared with that for the T group at early times, suggesting exaggerated thrombogenesis with hypoxia exposure (Fig. S1 A and B). Further, the lumen of IVC in the HT group appeared to be completely obstructed after 6 h of hypoxic exposure with prominent recanalization compared with the T group (Fig. S1A), suggesting an early onset of thrombolytic process as well. Thrombotic animals in normoxia (T) showed progressive increase in thrombus formation (until 24 h), but negligible mortality (Fig. 1 A–C and Fig. S1A and B).
Fig. 1.
Systemic hypoxia accelerates venous thromboembolism. (A) Representative heat maps representing IVC in situ. (B) Thrombus weight. (C) Percentage survival rate calculated using Log-rank (Mantel-Cox) test (P < .001). (D) Representative in situ images of gross lungs obtained from thrombotic (n = 5) and hypoxia thrombotic groups (n = 7). (E) Representative hematoxylin-eosin-stained cross-sectional images of IVC, lungs, and heart from indicated groups. Estimation of (F) clotting time, (G) secretory prothrombin fragment 1+2, and (H) D-dimer at the 6-h point. *P < 0.05 and **P < 0.01.
Fig. S1.
Systemic hypoxia accelerates venous thromboembolism. (A) Representative photomicrographs of H&E-stained sections of thrombus. (B) Quantitative thrombus load (percentage area of thrombus). Estimation of (C) free PAI-1 antigens, (D) uPA, (E) tPA at 6-h time. For each dataset, mean ± SEM from at least 7 animals is shown. *P < 0.05; **P < 0.01; ***P < 0.001.
Necroptic examination in the HT group suggested mortality to be associated with hemorrhagic lungs (Fig. 1D), whereas no sign of bleeding or thrombus could be noticed in the lungs of animals from the NT group. Thromboembolus was found in the heart and lungs of animals in the HT group (24 h), with concomitant evidence for resolution from the IVC (Fig. 1 D and E and Fig. S1A), suggesting a shift of hemostatic equilibrium toward fibrinolytic pathway at this point. We therefore investigated both thrombotic and fibrinolytic axes in these animals.
We recorded parameters associated with prothrombotic conditions, including clotting time, prothrombin fragment 1+2 (corresponding to cleavage of prothrombin by factor Xa), and D-dimers in all groups. The clotting time was significantly shortened in the HT group (Fig. 1F). Further, a higher level of prothrombin fragment 1+2 (20) and D-dimer (Fig. 1 G and H) supported an accelerated thrombogenic activity in this group.
We also observed increased expression of free plasminogen activation inhibitor-1 (PAI-1) (Fig. S1C) in HT animals. The levels of fibrinolytic enzyme urokinase plasminogen activator (uPA) decreased, whereas tissue plasminogen activator (tPA) levels (Fig. S1 D and E) increased in thrombotic animals. Fibrinolytic molecules were also elevated in the H group, suggesting that hypoxia per se could modulate hemostasis pathways. These results suggested that systemic hypoxia exacerbated hypercoagulation, with compensatory hyperfibrinolysis that likely culminated in disseminated intravascular coagulation, leading to sudden animal death.
Evidence for Modulation of Hypoxia Response Pathways During Pathogenesis of Venous Thrombosis.
Our observation that systemic hypoxia accelerated thrombotic cascade prompted us to investigate the functional involvement of hypoxia response pathways. As shown in Fig. 2 A–C, similar to nonligated animals exposed to hypoxia, the expression of HIF-1α and its target genes [vascular endothelial growth factor (VEGF) and erythropoietin (EPO)] was significantly increased in thrombotic groups (highest in HT group), supporting the possibility that the hypoxic milieu is an integral component involved during perturbation of hemostasis.
Fig. 2.
Functional role of hypoxia response pathways during thrombosis. Relative expression of HIF-1α (A), VEGF (B), and EPO (C) at the 6-h point. 18S rRNA was used as internal control, and expression was normalized to that of the normoxic group (N). Mean ± SEM (n = 6) is shown. *P < 0.05; ***P < 0.001.
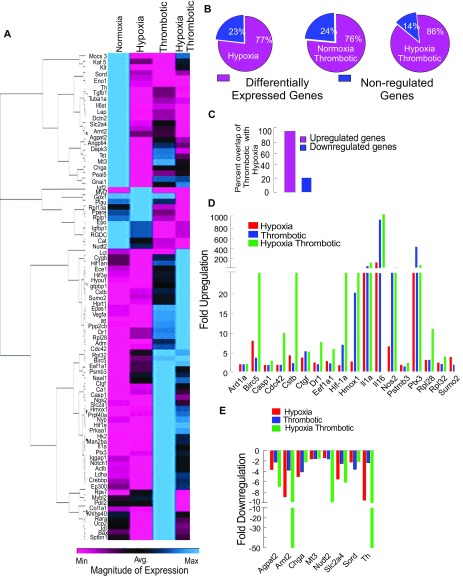
We studied the expression of 84 well-documented hypoxia-responsive genes, using real-time PCR analysis under specific conditions (Fig. S2A). We observed nearly 77% of these genes to be differentially expressed after 6 h of exposure to hypoxia (Fig. S2B); 76% of these genes were differentially regulated by IVC ligation alone (T), and 86% by IVC ligation followed by exposure to hypoxia (HT) (Fig. S2B). Further, the majority of genes up-regulated by hypoxia were present in the T dataset (Fig. S2C). The expression value of most of these genes was uniformly highest in the HT group, further suggesting exacerbation of responses by systemic hypoxia (Fig. S2 D and E).
Fig. S2.
Functional role of hypoxia response pathways in pathogenesis of thrombosis. (A) Heat map of relative changes in the expression of various hypoxia responsive genes in all four groups at 6-h point. Color key is shown. (B–E) The expression patterns for hypoxia-responsive genes. (B) Percentage of differentially expressed genes in H, T, and HT groups with respect to normoxia. (C) Percentage overlaps of up- and down-regulated genes between thrombotic and hypoxic group. Fold regulation pattern for common up-regulated (D) and down-regulated (E) genes.
Genome-Wide Expression Analysis Suggests Hierarchical Activation of Intense Inflammatory Response During Hypoxia-Induced Thrombus Formation.
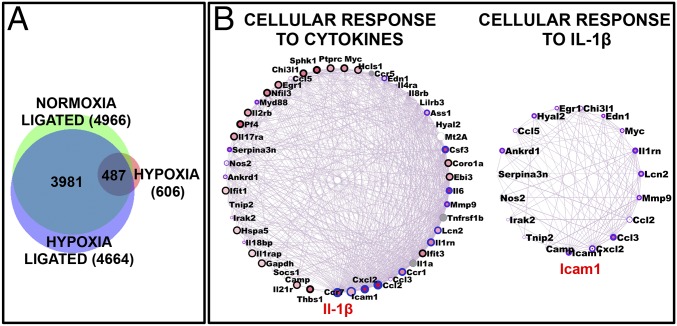
We next used RNA sequencing to obtain an unbiased cross-sectional snapshot of changes in gene expression in all groups. Nearly 606 unique transcripts (Entrez Gene) were significantly modulated by at least ±twofold in the H group (Dataset S1). The T and HT groups showed a much higher number of differentially expressed genes (4,966 and 4,664, Entrez Gene, respectively; Dataset S1). As evident from Fig. 3A, 487 hypoxia-specific genes (H) were also differentially expressed in thrombotic groups (T and HT). A significant number of differentially expressed genes were unique to T and HT groups (which did not appear in the H group), which was a clear indication that specific additional pathways were perturbed during thrombotic (T and HT) conditions (Fig. 3A and Fig. S3A).
Fig. 3.
Genome-wide expression and network analysis during thrombosis. Transcriptome sequencing was performed on RNA isolated from IVC of animals from all four groups, followed by data mining. (A) Intersection among differentially expressed genes, represented using Venn diagram. (B) Key networks (degree-sorted circle view) representative of inflammatory responses (significantly enriched from up-regulated genes in thrombotic group). Highest-degree nodes (IL-1β and ICAM 1) are indicated in red.
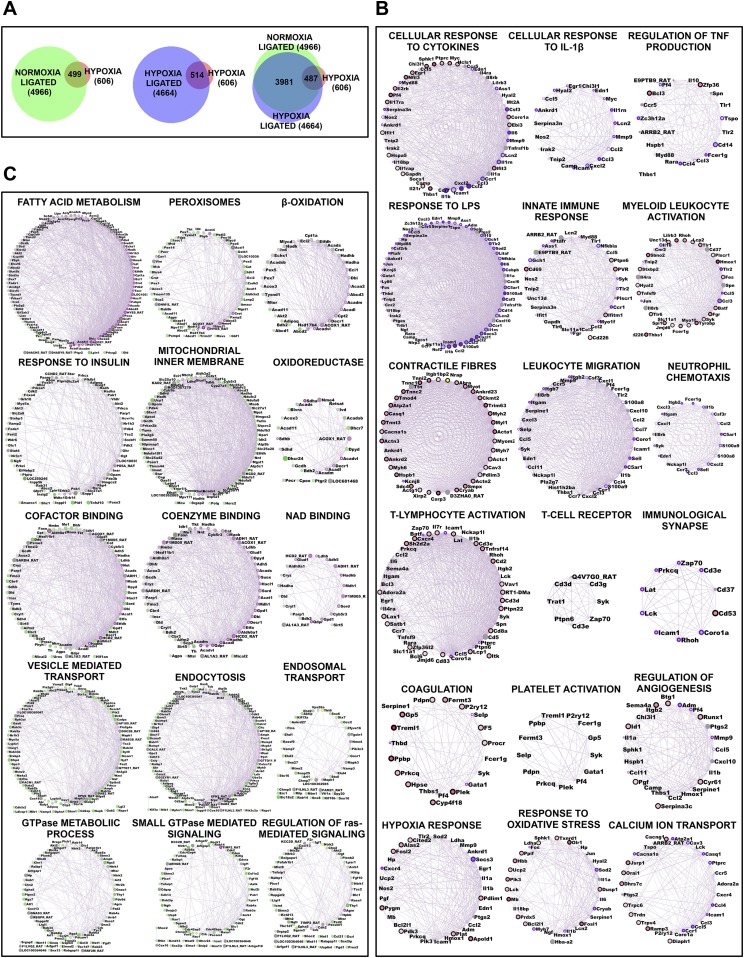
Fig. S3.
Global overview of transcriptome sequencing data performed using Illumina next-generation sequencing (NGS) platform. Transcriptome sequencing was performed on RNA isolated from IVC of animals from all four groups at 6 h. (A) Intersection among differentially expressed genes, represented using a Venn diagram. (B and C) Key networks, represented in a degree-sorted circle view, indicating nonredundant, statistically overexpressed biological processes enriched in up-regulated (B) and down-regulated (C) genes from HT animals. Respective network annotations have been indicated in the figures.
We extracted nonoverlapping biological processes, significantly modulated in the HT group, using GeneMania (21) (Fig. 3B and Fig. S3 B and C). The pathways enriched from the set of down-regulated genes principally indicated perturbation of metabolic processes characteristic of hypoxic stress (Fig. S3C). The processes enriched from up-regulated genes (Fig. S3B) suggested activation of angiogenesis, oxidative stress response, and calcium ion homeostasis in addition to other hypoxia response pathways. The dataset also revealed modulation of key processes regulating thrombotic propensity, including coagulation and platelet activation (Fig. S3B). We also observed processes representing strong and hierarchical activation of immune response in the HT group, as represented by networks related to early immune response such as cytokine signaling, activation of innate immune response, immunological synapse, and activation of adaptive immune system (involving T lymphocytes) (Fig. S3B). The subsequent analysis of these data yielded two lines of evidence suggesting that IL-1β could be the central regulator of such immune response in these animals. First, we observed a distinct network of genes regulating cellular responses to IL-1β (Fig. 3B). Second, multiple measures of centrality in immune response to specific subnetworks presented IL-1β as an important “bottleneck” gene, whose deletion led to collapse of the biological network. As can be readily observed from Fig. 3B, IL-1β is the most connected (highest degree) node or hub gene in the network related to cellular responses to cytokines.
Activation of NLRP3 Inflammasome in Response to Hypoxia-Induced Thrombosis.
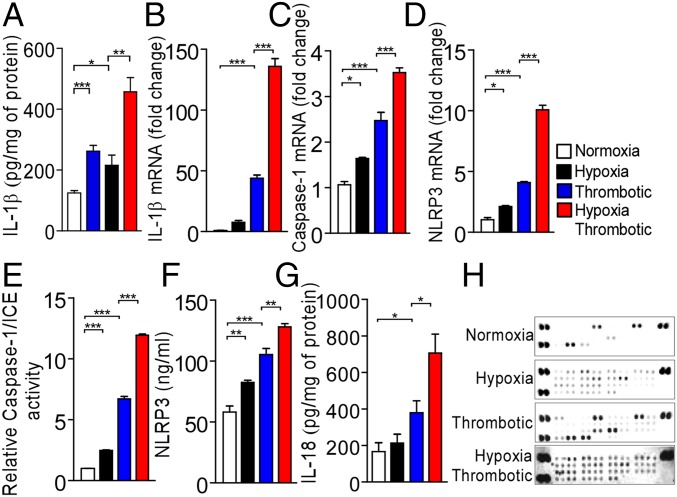
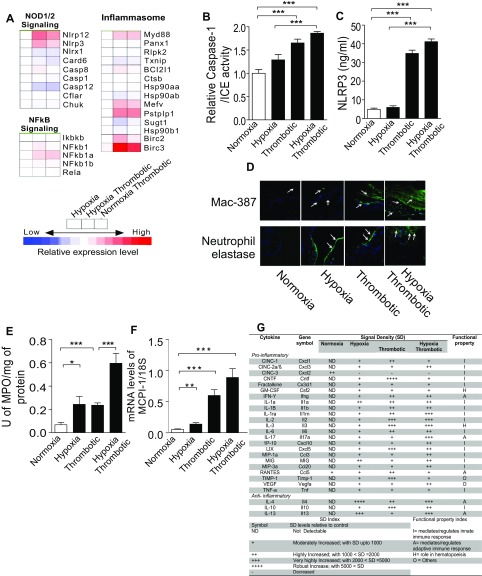
We next measured levels of IL-1β secreted in the localized IVC milieu after 6 h of hypoxia exposure and, in agreement with our transcriptome data, observed a significant increase in concentration of IL-1β in the T and HT groups (Fig. 4A). The concomitant activation of two signaling pathways is critical for the secretion of functionally active IL-1β: the first signal ensures transcriptional up-regulation of IL-1β, and the second leads to the assembly of a pro-IL-1β-processing inflammasome complex. Our transcriptome data (Fig. S4A) were distinctively evident for the activation of these arms in thrombotic groups. Real-time PCR analysis confirmed significant increase in the expression of IL-1β (Fig. 4B), caspase-1 (Fig. 4C), and NLRP3 (Fig. 4D) transcripts in the HT group. Further, caspase-1/ICE activity and NLRP3 expression were significantly elevated in the IVC milieu (tissue homogenate; Fig. 4 E and F) and plasma (Fig. S4 B and C) of animals under these conditions. Taken together, these data suggest an early activation of the NLRP3 inflammasome pathway in thrombotic animals. In addition to IL-1β, NLRP3 inflammasome also regulates IL-18 secretion. Consistent with this proposition, we also observed a significant increase in IL-18 levels (Fig. 4G) in IVC of animals in thrombotic groups (T and HT).
Fig. 4.
Activation of NLRP3 inflammasome during hypoxia-induced thrombosis. (A) Estimation of IL-1β by ELISA in tissue homogenates after 6 h of exposure. (B–D) Relative levels of expression of IL-1β (B), Caspase-1 (C), and NLRP3 (D) transcripts (real-time PCR) at indicated points in the HT group. 18S rRNA was used as an internal control, and expression was normalized to that of animals in normoxic group. (E) Relative Caspase-1/ICE activity in indicated groups. Estimation of NLRP3 (F) and IL-18 (G) levels by ELISA after 6 h exposure. (H) Estimation of cytokines (using cytokine arrays) from tissue homogenates from all four groups. The results are representative of a minimum of three independent experiments. *P < 0.05; **P < 0.01; ***P < 0.001.
Fig. S4.
Activation of NLRP3-Inflammasome during hypoxia-induced thrombosis. (A) Heat map of various genes related to inflammasome pathway. (B) Relative caspase-1/ICE activity in plasma indicated groups. (C) Estimation of NLRP3 levels in plasma by ELISA after 6 h exposure. (D) Photomicrographs of immunofluorescence staining with mac-387 and neutrophil elastase. Nucleated cells were stained with DAPI (200× magnification). Images are representative of at least three independent experiments. (E) Estimation of myeloperoxidase (MPO) activity in IVC lysates. (F) Relative changes in the expression of monocyte chemotactic protein-1 (MCP-1) transcript using RT-PCR. (G) Quantitative scoring of expression of respective cytokines. The broad functional role of each cytokine in the inflammatory cascade is listed as functional property. Representative cytokine array image is shown. Data presented as mean ± SEM. *P < 0.05; **P < 0.01; ***P < 0.001.
We observed increased recruitment of neutrophils (elastase-positive foci) and macrophages (mac-387–positive regions) in the IVC of animals from the HT group (Fig. S4D). The increase in myeloperoxidase activity and monocyte chemotactic protein-1 levels (Fig. S4 E and F) further supported recruitment of neutrophils and macrophages during thrombosis.
The secretion of IL-1β and activation of IL-1 receptor signaling initiates a cascade of events leading to modulation of expression of numerous other cytokines. We therefore investigated changes in the levels of cytokines, using cytokine-specific antibody arrays. We observed an increase in the secretion of proinflammatory cytokines in thrombotic animals (Fig. 4H and Fig. S4G). Taken together, we concluded that hypoxic signal culminates in the activation of NLRP3 inflammasome and active IL-1 signaling that eventually results in a prothrombotic state.
Hypoxia Response Pathways Functionally Regulate Expression of NLRP3 and IL-1β During Thrombosis.
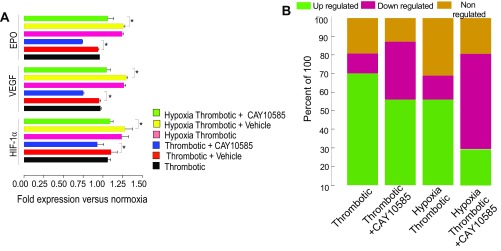
To investigate the relationship between hypoxia and inflammasome activation, we first used a pharmacological inhibitor of hypoxia response pathway, CAY10585, which inhibits accumulation and transcriptional activity of HIF-1α and thus, decreases the expression of HIF-1α target genes (22). As shown in Fig. S5A, CAY10585 treatment led to decreased expression of HIF-1α and its target genes (VEGF and EPO). We also observed conspicuous differences in the expression of 84 hypoxia pathway genes (modulated by hypoxia; Fig. S2 A–E) in CAY10585-treated groups (Fig. S5B).
Fig. S5.
Hypoxia-induced proinflammatory state is regulated by transcriptional activity of HIF-1α. (A) The relative expression patterns of HIF-1α, VEGF, and EPO with/without HIF-inhibitor (CAY10585) at 6 h. (B) Percentage of differentially expressed hypoxia responsive genes. *P < 0.05; **P < 0.01; ***P < 0.001.
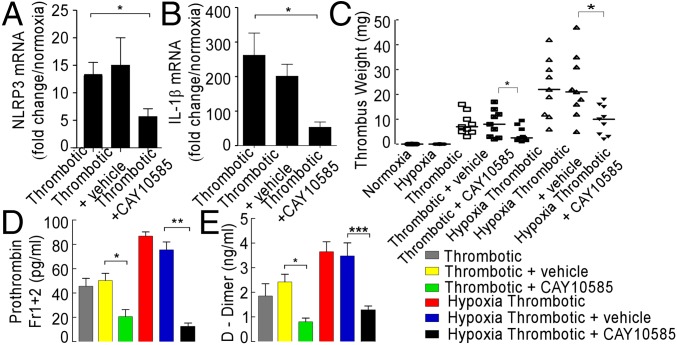
We next tested whether CAY10585 modulated expression of NLRP3 pathway genes in our model system. As shown in Fig. 5 A and B, the expression of NLRP3 and IL-1β transcripts was significantly lowered in the animals pretreated with this inhibitor. These observations suggested a key role of hypoxia in regulating the expression of NLRP3 inflammasome components.
Fig. 5.
Hypoxia-induced proinflammatory state is regulated by transcriptional activity of HIF-1α. HIF inhibitor, CAY10585 (100 μg/kg) was administered (intravenous) before IVC ligation and hypoxic challenge for 6 h. Relative expression of (A) NLRP3 and (B) 1L-1β transcripts (real-time PCR). (C) Dot plot showing medians of thrombus weight, (D) Levels of prothrombin fragment 1+2, (E) D-dimer (ELISA) estimation in plasma samples. Mean ± SEM is shown (n ≥ 6). *P < 0.05; **P < 0.01; ***P < 0.001.
To establish the functional relevance of inhibition by CAY10585, we next recorded thrombus weight, prothrombin fragment 1+2, and D-dimer in the presence of this inhibitor. We observed a reduction in thrombus weight (Fig. 5C), level of prothrombin fragment 1+2 (Fig. 5D), and D-dimer (Fig. 5E) in the HT group, pretreated with this inhibitor and thus clearly supporting a functional role of hypoxia response pathways in the activation of the NLRP3 inflammasome and thrombogenesis.
Evidence for a Functional Role of HIF-1α During Hypoxia-Induced NLRP3 Expression.
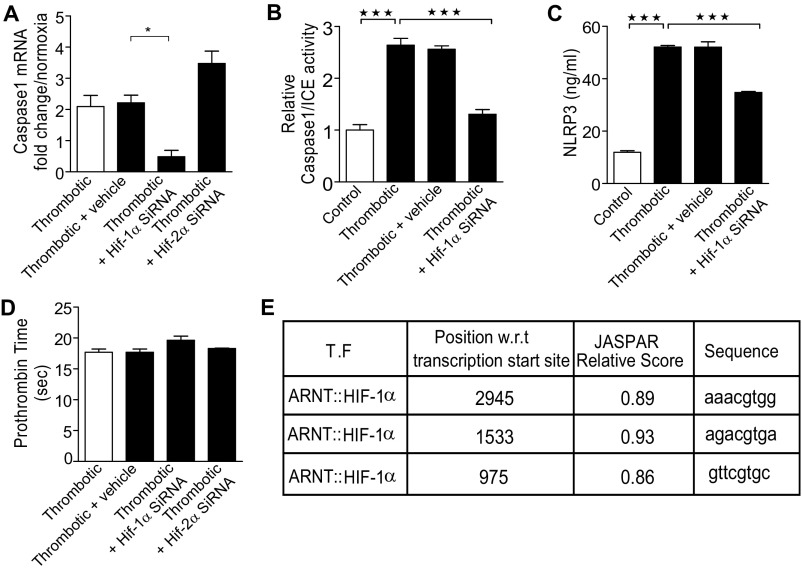
We next tested whether HIF-1α, the central regulator of hypoxia responses (23), was involved in hypoxia-induced expression of NLRP3 and thrombogenesis. We used an in vivo siRNA approach. As shown in Fig. 6A, animals in the HT group (6 h), treated with HIF-1α siRNA, showed a significant reduction in the accumulation of the HIF transcript. The expression of NLRP3 (Fig. 6B), IL-1β (Fig. 6C), and caspase-1 (Fig. S6A) transcripts was significantly reduced in these groups. Further, caspase-1/ICE activity (Fig. S6B) and NLRP3 protein levels (Fig. S6C) were also diminished in the plasma of these groups. The animals in siRNA-treated groups showed significant reduction in thrombus weight (Fig. 6D), with an increase in clotting (Fig. 6E) and prothrombin time (PT; Fig. S6D). The knock-down of HIF-2α in our experiments led to a significant increase in HIF-1α expression, a likely compensatory response (Fig. 6A). Concurrent with an increase in expression of HIF-1α, the expression of NLRP3, IL-1β, and caspase-1 was also elevated, along with increase in thrombus weight, clotting time, and PT (Fig. 6 A–E and Fig. S6D).
Fig. 6.
HIF-1α regulates NLRP3 expression and thrombogenesis. Animals were treated with in vivo grade HIF-1α and HIF-2α siRNA. After RNA isolation from indicated groups, real-time PCR was performed for (A) HIF-1α, (B) NLRP3, (C) IL-1β. Thrombus weight (D) and clotting time (E) were also recorded. (F) Chromatin immunoprecipitation with two different HIF-1α antibody (indicated) and primer pairs spanning putative sites (indicated). The enrichment of NLRP3 promoter region in chromatin immunoprecipitation experiments was quantitated and plotted to obtain the bar graph (mean ± SEM) shown in the figure. *P < 0.05; **P < 0.01; ***P < 0.001.
Fig. S6.
HIF-1α regulates NLRP3 expression and thrombogenesis. (A) Caspase-1 mRNA expression (B) Relative caspase-1/ICE activity (in plasma). (C) NLRP3 protein level (in plasma; using ELISA). (D) PT at 6 h. (E) NLRP3 promoter analysis: sequences closely matching canonical HIF-responsive elements are shown. Data presented as mean ± SEM. *P < 0.05; **P < 0.01; ***P < 0.001.
We next analyzed the NLRP3 promoter for putative HIF-responsive elements/sites. Our in silico analysis returned three sequences closely matching HIF-responsive element consensus (Fig. S6E). We therefore performed chromatin immunoprecipitation experiments, using two different HIF-1α antibody clones and probes spanning NLRP3 promoter. As shown in Fig. 6F, we consistently observed recruitment of HIF-1α at one of these sites [−975 w.r.t transcription start site (TSS)], implicating functional involvement of HIF-1α in regulating NLRP3 expression during HT conditions.
NLRP3 Inflammasome Axis Inhibition Curtails Hypoxia-Induced Thrombosis.
To establish whether the activation of NLRP3 inflammasome played a causal role in the initiation and propagation of thrombosis in our model system, we used three different inhibition strategies and, subsequently, performed in situ thrombus examination, recorded thrombus weight and length, and checked in vivo levels of prothrombin fragment 1+2 and D-dimer, in addition to monitoring the aggregation of platelets isolated from these animals.
We first knocked down NLRP3 transcript in the animals, using in vivo grade siRNA (10 mg/kg body weight), aiming to check the assembly of the NLRP3 inflammasome complex. We observed a significant reduction in caspase-1/ICE activity (Fig. S7A), in addition to reduced thrombus (Fig. 7 A–C), in IVC of the HT group treated with NLRP3 siRNA. We also observed a significant reduction in the levels of prothrombin fragment 1+2 and the D-dimer (Fig. 7 D and E, respectively). These results suggested a causal role for NLRP3 during thrombosis. The platelets isolated from animals pretreated with NLRP3 siRNA, before IVC ligation, also showed reduced aggregation in response to ADP (used as physiological agonist) (Fig. 7F). This observation suggested an upstream role of NLRP3 inflammasome to platelet activation, which is a vital step in the thrombogenic cascade.
Fig. S7.
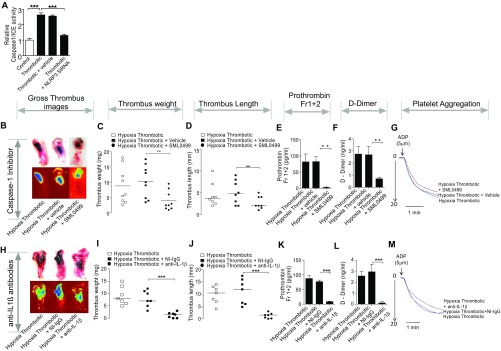
Inhibition of caspase-1 and secreted IL-1β curtains hypoxia induced-thrombosis and increased platelet reactivity. (A) Relative caspase-1/ICE activity (in plasma). The production of active IL-1β was inhibited using two experimental strategies: Either the activity of caspase-1 was inhibited using its specific SML0499 (25 μmol/kg body weight) (B–G) or knock-downed NLRP3 (presented in main manuscript). In the third strategy, secreted IL-1β was sequestered by preinjecting anti-IL-1β antibodies (H–M). For each interventional strategy, multiple parameters and indicators of thrombosis were recorded. The figure shows photomicrographs of thrombosed IVC (B and H). Thrombus weight (C and I), thrombus length (D and J), prothrombin fragments 1+2 (E and K), D-dimer (F and L), and platelet aggregation assay (G and M) in individual interventional groups (indicated in figure) after 6 h postinduction. For thrombus weight and thrombus length, n ≥ 7 per group. The median value for each group is indicated. For estimation of prothrombin fragment 1+2 and D-dimer, mean ± SEM (n ≥ 8) is shown. For platelet aggregation assay, the data are representative of at least three independent experiments. *P < 0.05; **P < 0.01; ***P < 0.001.
Fig. 7.
Knock-down of NLRP3 curtails hypoxia-Induced thrombosis. NLRP3 was knock-down using in vivo grade siRNA complexes and specific parameter studied. (A) Photomicrographs of thrombosed IVC; (B) thrombus weight; (C) thrombus length (median indicated); (D) Prothrombin fragments 1+2; (E) D-dimer, and (F) platelet aggregation assay in groups (indicated in figure), 6 h postinduction. All datasets are representative of a minimum of three independent experiments. *P < 0.05; **P < 0.01; ***P < 0.001.
In the next set of experiments, we used SML0499 to inhibit the catalytic activity of caspase-1, required for the production of active IL-1β from its proform. The in situ thrombus examination, thrombus weight and length, prothrombin fragment 1+2, D-dimer, and ex vivo platelet aggregation assay using ADP are shown in Fig. S7 B–G. The cumulative results from all these assays showed that inhibition of caspase-1 activity reduced thrombogenesis under hypoxic conditions.
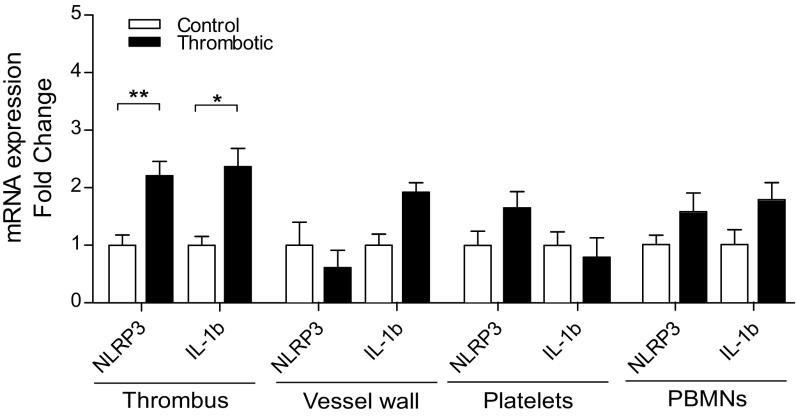
Finally, we injected specific antibodies against active IL-1β and thus limited its bioavailability, essential for signaling via cognate IL-1 receptors. As presented in Fig. S7 H–M, these animals also showed a reduction in thrombus formation, as evident from a similar set of parameters described earlier. Taken together, these results (Fig. 7 A–F and Fig. S7 B–M) demonstrated an indispensable role for NLRP3 inflammasome-mediated active IL-1β generation in hypoxia-induced thrombus formation. The expression analysis in specific cell types [peripheral blood mononuclear cells (PBMNs), platelets, and vessel wall] suggested that both NLRP3 and IL-1β increased significantly in the PBMNs, apart from thrombus isolated from a localized (ligated) venous site (Fig. S8).
Fig. S8.
Cell-specific expression of NLRP3 and IL-1β. Expression level of NLRP3 and IL-1β in thrombus isolated from localized (ligated) venous site, vessel wall, platelets, and mononuclear cells (PBMNs), from the control and thrombotic group. Data are shown as mean ± SEM and are representative of three independent experiments. *P < 0.05; **P < 0.01; ***P < 0.001.
Evidence for the Involvement of the NLRP3 Inflammasome in Human Patients with Altitude-Induced Thrombosis.
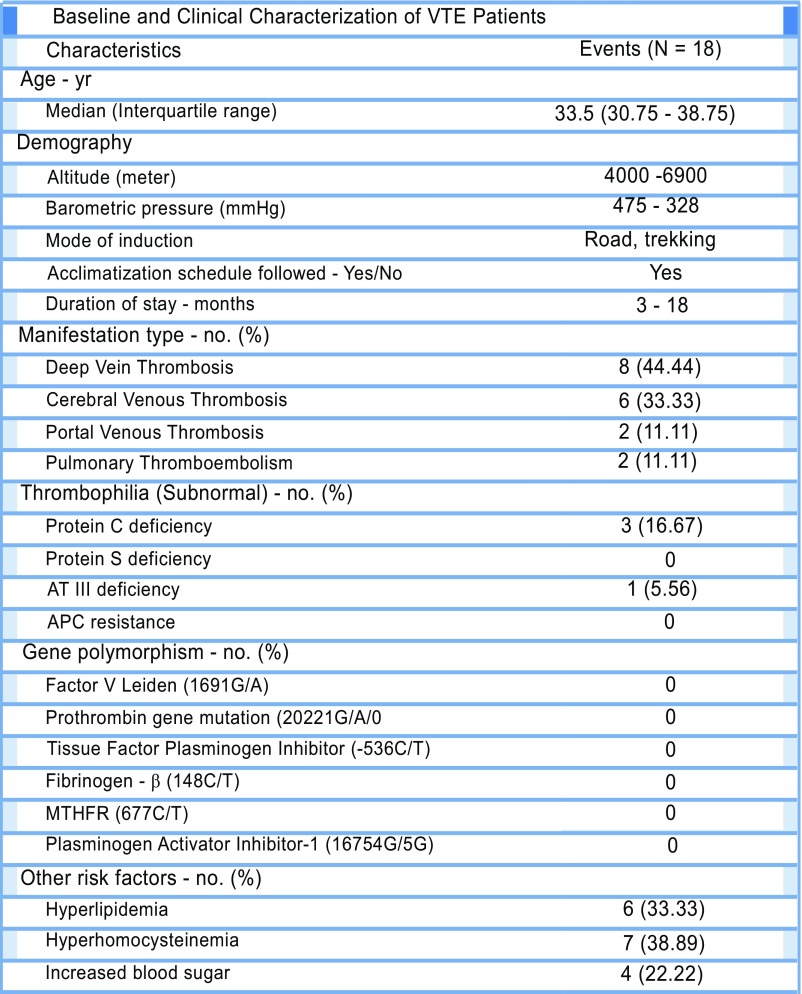
We next sought to investigate the potential involvement of the NLRP3 inflammasome in clinically confirmed cases of VTE (n = 18) occurring in response to the hypoxic environment. The demographic, clinical, and specific genetic parameters of patients with VTE are presented in Fig. S9. We observed a relatively higher number of patients lacking thrombophilic traits [including deficiency of protein C, protein S, and ATIII, in addition to activated protein C (APC) resistance], major SNPs [factor V Leiden, prothrombin, tissue factor pathway inhibitor (TFPI), fibrinogen-β, methylene tetrahydrofolate reductase (MTHFR), and PAI-1], and other additional risk factors (including lipid profile, homocysteine, and blood glucose levels) known to be associated with a predisposition to VTE (Fig. S9). These observations likely suggested that VTE episodes in these individuals were potentially triggered by environmental conditions (hypoxia) prevailing at altitudes.
Fig. S9.
Evidence for involvement of NLRP3 inflammasome components in human patients with altitude-induced venous thrombosis. Baseline and clinical characterization of high altitude-VTE patients.
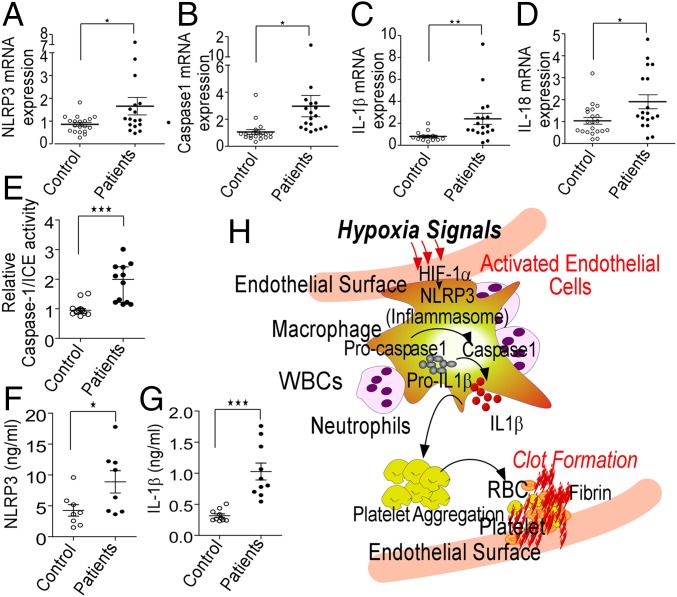
To test the likely involvement of the NLRP3 inflammasome pathway, we next studied relative expression of key genes of this pathway in these patients. As shown in Fig. 8 A–D, we observed an increase in NLRP3, caspase-1, IL-1β, and IL-18 mRNA expression in patients compared with healthy age-matched controls. Furthermore, caspase-1/ICE activity was significantly elevated along with increased levels of NLRP3 (protein) and IL-1β in the patient samples (plasma, Fig. 8 E–G). This dataset supported involvement of the NLRP3 inflammasome pathway in the pathogenesis of VTE in individuals exposed to the hypoxic challenge.
Fig. 8.
Evidence for involvement of NLRP3 inflammasome components in patients with altitude-induced venous thrombosis. (A–D) RNA was isolated from PBMNs from the blood samples of patients (n = 18), and real-time PCR for indicated genes was performed. β-actin was used as an internal control. The relative expression of NLRP3 (A), caspase-1 (B), 1L-1β (C), and IL-18 (D) transcripts. (E) Caspase-1/ICE activity in plasma samples from patients and controls (n = 12). Estimation of NLRP3 (F) and IL-1β (G) levels in plasma samples from patients and controls (n ≥ 8) Median values for individual groups are also shown. *P < 0.05; **P < 0.01. (H) Diagrammatic representation of an inferred scheme of events during hypoxia-induced thrombosis.
Fig. 8H schematically depicts the scheme of events causally underlying activation of thrombosis in hypoxic environments.
SI Materials and Methods
Animals and Exposure to Hypoxia.
All experiments were conducted in compliance with the guidelines of the Committee for the Purpose of Control and Supervision of Experiments on Animals, Government of India. Male Sprague–Dawley rats, weighing 250–300g, maintained in standard laboratory conditions were used for the study. The animals were exposed to simulated systemic hypoxia (hypobaric) conditions in a custom-designed animal decompression chamber. This simulating environmental chamber was maintained at a constant pressure of 429 torr (equivalent to an altitude of 4,572 m with 11% oxygen, at 25 °C) for the indicated durations. Airflow into the chamber was maintained at a constant rate of 2 L/min. Control animals (not placed in hypoxic chamber) were otherwise treated in the same manner.
Flow-Restriction Animal Model.
To model the stasis-induced thrombosis, a flow-restriction animal model was used (19). Thrombus was induced in rats by proximal ligation of the IVC just below the renal veins and ligation of lateral tributaries, as previously described by us (19). Briefly, midline laparotomy was performed and IVC was approached carefully. A nonreactive 7–0 Prolene suture was used for ligating the IVC just below the left renal veins and visible lateral branches. The thrombus formation was found to be initiated at the caudal end of the IVC, despite the fact that the ligation was performed at the proximal site of the IVC, just below the left renal vein. Animals undergoing the ligation procedure were randomly divided into different groups. Sham-operated rats underwent midline laparotomy and bowel manipulation, with no ligation of IVC, but were otherwise treated in an identical manner. After an indicated point postligation, rats were euthanized, weight of the thrombus was measured in milligrams, and length was determined in millimeters. The IVC with thrombus was fixed immediately in formalin and later stained with H&E. Thrombus load was calculated with images of H&E-stained serial cross-sections as percentage of area of lumen occupied by thrombus tissue over the total area of lumen.
Experimental Group Nomenclature.
For the majority of the experiments described in this study, we have used a uniform convention to describe our findings for respective groups throughout the article. For two groups of animals, IVC ligation surgery was performed as described earlier. After ligation, the group of animals that were kept in normal atmospheric conditions was designated as NT, whereas the ligated ones kept under simulated hypobaric hypoxia were designated HT. For both groups of animals, sham surgeries were performed; those kept in normal atmosphere conditions were described as N, and the ones exposed to simulated hypobaric hypoxia were termed as H. Unless otherwise stated, the data from all the experimental groups were compared with the data from the sham-operated N.
Coagulation, Platelet Aggregation, Biochemical Analysis, and Enzyme Immunoassay.
PT assay was performed in citrated plasma, using a semiautomated coagulation analyzer (Labitec), as per manufacturer’s instruction. Blood clotting time was noted using test tube methods (19). Whole-blood platelet aggregation was measured by impedance method, as per manufacturer’s instructions, using a Lumi-Aggregometer (Chrono-log Corp). Myeloperoxidase was measured using O-dianisidine dihydrochloride (Sigma-Aldrich) as substrate. Plasma levels of prothrombin fragments 1+2, D-dimer, localized fibrinolytic molecules: PAI-1, tPA, uPA, and NLRP3 were analyzed using ELISA kits purchased from either Bmassay, or USCN Life Sciences Inc. IL-1β was measured in thrombotic tissue using a rat IL-1β ELISA Kit (Krishgen). Caspase-1/ICE activity was performed using a commercially available kit (BioVision), as per manufacturer’s protocol. All histological and immunofluorescence images were acquired using an Inverted Fluorescent Microscope (Motic) and analyzed by Motic Images 2.0 software. o-Dianisidine- hydrochloride and AC-YVAD-CMK were from Sigma-Aldrich; CAY10585 was from Cayman chemicals. The reverse transcription PCR (RT-PCR) kit for RNA analysis and all other reagents were from Sigma-Aldrich. Silencer select predesigned siRNA was procured from Life Technologies.
Hypoxia Signaling Array.
The expression profiles of hypoxia signaling-related genes were performed using rat hypoxia signaling RT2 Profiler PCR array (SA Biosciences) according to the manufacturer's instructions. Total RNA was converted to cDNA, using an RT2 First strand cDNA Synthesis Kit (SA Biosciences). The gene expression pattern was analyzed implying RT2 Profiler hypoxia signaling array (SA Biosciences), using a real-time PCR system (Applied Biosystems). All kits were used according to the manufacturer’s instructions, and analysis was performed using software available at www.sabiosciences.com.
Gene Expression Analysis.
RNA from thrombosed IVC/IVC tissue/whole blood/platelets/mononuclear cells (PBMCs) was isolated using TRIzol reagent, according to the manufacturer’s protocol. For semiquantitative RT-PCR, reverse transcription reaction was performed with a high-capacity cDNA Reverse Transcription kit with specific primers, using thermocycler (Eppendorf). Gene expression was measured by quantitative real-time PCR, using SYBR Green for quantification (KAPA SYBR FAST Universal qPCR Kit; KAPA Biosystems) on a CFX96 Mastercycler platform (Bio-Rad Laboratories). Ct values for each gene were normalized to the housekeeping gene, 18S, and relative expression was calculated using the ΔΔCt method.
Transcriptome Sequencing.
Library preparation, sequencing, and cDNA libraries were prepared using TruSeq mRNA Sample Prep Kit (Illumina Inc), as per manufacturer’s instructions. Poly-A tail containing mRNA molecules were purified using oligo-dT attached magnetic beads (Illumina Inc), using two rounds of purification. Purified mRNA were subjected to fragmentation, reverse transcription, end repair, 3′-end adenylation, and adaptor ligation, followed by PCR amplification and bead purification. The unique barcode sequences were incorporated in the adaptors for multiplexed high-throughput sequencing. The final product was assessed for its distribution of size and concentration, using 2100 Bioanalyzer (Agilent Technologies), followed by Cluster generation and sequencing on HiSEq. 2000.
Read Filtering, Processing, and Alignment.
The mRNA-Seq reads were aligned to the rat reference genome [downloaded from University of California, Santa Cruz (UCSC) Genome Browser] using Bowtie 2 and TopHat, as per published methods (35). The mapped reads were subsequently fed as input into Cufflinks. The assembly files so generated were merged into a unified annotation with the reference transcriptome annotation for further analysis. The merged annotations were quantified using Cuffdiff to identify differentially expressed genes. The FPKM (fragments per kilobase of transcript per million fragments) parameter was used to quantitate the abundance of the transcripts.
Bioinformatic Analysis.
Gene ontology, pathway mining, and functional annotation clustering were performed using DAVID Bioinformatics resources. Gene MANIA (as Cytoscape plug-in) was used to extract functional networks representing nonredundant, statistically significant biological processes, which were depicted in a degree-sorted circular view.
Cytokine Array Analysis.
Cytokine array analysis was performed using the rat cytokine array panel A proteome profiler (R&D Systems). Briefly, total protein was estimated in each sample and incubated with the array’s membrane, following the manufacturer’s instructions. Dots were detected using a chemiluminescence system (FUSION ×5), and pixel density was calculated and analyzed using ImageJ software.
Infusion of Inhibitors and Antibodies.
Animals were preinfused with inhibitors and antibodies 30 min before IVC ligation; the fluid were administered i.v. via tail vein injection. CAY10585, was dissolved in DMSO and administered at a dosage of 100 μg/kg of body weight; caspase-1 inhibitor ac-YVAD-cmk was used at a dosage of 25 μmol/kg body weight. Rats were given anti-IL-1β mAbs, isotype-matched IgG (10 μg/kg; Sigma-Aldrich) via tail vein 30 min before IVC ligation. At the indicated intervals after the IVC ligation, rats were killed and i.v. thrombi were harvested, and their weight and length were measured.
siRNA Mediated Gene Silencing.
For siRNA-mediated knockdown, Silencer in vivo grade siRNA, Ambion, Life Technologies were used along with Invivofectamine 2.0 reagent (Life Technologies), as per manufacturer’s protocol. Briefly, the in vivo grade siRNA specific to NLRP3, HIF-1α, HIF-2α, and scrambled controls were mixed with Invivofectamine 2.0 reagent (Life Technologies) to form nanoparticles suitable for in vivo applications. Animals were administered 200-μL mixtures containing either scrambled or siRNA via tail vein at a dosage of 10 mg/kg body weight. Thirty minutes after delivery, rats were subjected to IVC ligation, and samples (whole blood and tissue samples) were collected after 6 h. To ensure specific inhibition of target genes by siRNA, real-time PCR was performed at all occasions (both in siRNA and scrambled controls).
Chromatin Immunoprecipitation Assay.
Chromatin immunoprecipitation was performed using the Pierce Magnetic ChIP Kit (Thermo Scientific), as per manufacturer’s instructions, with some modifications. Briefly, tissue samples were cut (into tiny pieces) in a Petri dish and cooled on ice before fixation in a 1% formaldehyde solution. The tissue was then homogenized (using a homogenizer) and lysed using SDS lysis buffer (1% SDS, 50 mM Tris⋅HCl at pH 8.1, 10 mM EDTA). The suspension was sonicated at 30% amplitude (3 cycles of 10 s sonication and 10 s hold). The lysate were then centrifuged at 13,000 rpm (Heraeus Fresco 17; Thermo Scientific) for 10 min and clear supernatant collected. A tenth of the supernatant from all groups was kept aside to be used as input controls. Immunoprecipitation was performed, using two different anti-HIF-1α antibodies (Novus Biologicals; clones indicated in Fig. 6 F). For negative controls, the specific antibodies were omitted from the immunoprecipitation reactions. The reverse cross-linking and purification steps were performed as per manufacturer’s protocol. The relative enrichment of the specific promoter region (with putative HIF-1α binding sites) was estimated using semiquantitative PCR, using primer pairs spanning the HIF-1α binding sites. The DNA samples from processed (reverse cross-linking and purification) input controls were amplified separately and used for normalization. All PCR products were resolved on 2% agarose gels, imaged and quantified using Image J (NIH).
Human Studies.
Patients who suffered thrombotic episodes while staying at altitudes (>4,000 m) were evacuated to a tertiary care facility (Command Hospital, Chandimandir: 1,250 ft; or Army Hospital Research and Referral, Delhi, 750 ft), in accordance with guidelines for altitude evacuation. The hematology, biochemical, and coagulation screening were performed along with clinical and radiological investigations. For each patient, the clinical profile, demographic details (body mass index, age, altitude, and duration) and laboratory investigations [hemogram, PT, activated partial thromboplastin time (aPTT), D-dimer] was recorded. Thrombophilia screening including protein C, protein S, and antithrombin-III deficiency was also done, using commercially available kits. Protein C and protein S activities were determined by using STACLOT kit on an automated STA compact analyzer (Diagnostica Stago). The quantification of AT III was performed using a STACHROM AT III kit in a STA analyzer. Activated protein C resistance was carried out using the Stago kit. Blood levels of glucose and lipid profile were obtained out, using automated biochemistry analyzer (Siemens Healthcare Diagnostics).
Patients presenting features suggestive of VTE were investigated for confirmatory diagnosis. Cerebral venous sinus thrombosis was confirmed by MRI and MR venogram of the brain. Patients with deep vein thrombosis were confirmed by Doppler examination. Pulmonary thromboembolism was confirmed by echocardiography and CT pulmonary angiography. The diagnosis of portal venous thrombosis was confirmed using Doppler examination of the portal venous system. Patients with preexisting systemic diseases, malignancy, any prior surgery, or vasculitis were excluded.
The blood samples were collected by venipuncture immediately on admission to the tertiary care hospital. For gene expression studies, the samples were collected in Pax gene tubes (2.5 mL blood in each tube) and stored at −20 °C. RNA was isolated using Pax gene blood isolation kit (Qiagen), and gene expression was measured by quantitative real-time PCR, using SYBR Green for quantification (KAPA SYBR FAST Universal qPCR Kit; KAPA Biosystems) on the CFX96 Mastercycler platform (Bio-Rad Laboratories). Restriction fragment length polymorphism (RFLP) assay was performed for SNP analysis. For factor V Leiden (1691G/A, rs6025), prothrombin (20210G/A, rs1799963), tissue factor plasmin inhibitor (–536C/T), fibrinogen-β (148C/T), MTHFR (677C/T), and plasminogen activator inhibitor-1 (16754G/5G) were performed by the PCR-RFLP method. For serum/plasma collection, the blood was collected in appropriate vacutainers, spun, and stored in aliquots at −80 °C. The samples were quickly transported to the laboratory in New Delhi, and specific assays were performed. The IL-1β levels in plasma was analyzed by bead based flow cytometry assay (eBiosciences), using an Accuri C6 flow cytometer (BD). NLRP3 levels and caspase-1 activities were measured in plasma samples, using a commercially available ELISA kit (Wuhan USCN Business Co.) and caspase-1/ICE activity kit (BioVision), respectively.
Discussion
The present study revealed a causal role of strong inflammatory response involving NLRP3 and IL-1β in activating hypoxia-induced thrombogenic cascade in the venous milieu. Of critical note is the fact that HIF-1α, known to regulate a plethora of human diseases (24), emerged as the key node connecting hypoxia responses to proinflammatory state via its ability to regulate the expression of NLRP3 (transcript) under these conditions. Conceivably, the evidence for a direct connection between HIF-1α and NLRP3 is likely to have general implications, especially as a target for intervention in other pathological conditions emanating from hypoxia and the proinflammatory state.
The biological activation of IL-1β requires parallel activation of pathways, culminating in transcriptional up-regulation of IL-1β, increased expression of NLRP3, and enzymatic activation of caspase-1 (25). Some recent reports suggested platelets as a likely source of IL-1β (26–29), produced by virtue of a stored repertoire of molecules (mRNA, inflammasome components) and cue-dependent processing/secretion during thrombogenesis. Thus, an important question pertaining to the possibility of platelet-origin IL-1β in sustaining an intense phenotype, such as that observed in our study, remains paradigmatic. Our present dataset provides some additional information in this regard. We observed up-regulation of IL-1β transcript in addition to other inflammasome components in mononuclear cells (PBMNs), apart from thrombus isolated from localized (ligated) venous site, and this up-regulation could be prevented using HIF inhibitor, CAY10585, or HIF-1α-specific siRNA. It thus is reasonable to assume that the immune cells are likely to play an important role in regulating the intensity of venous thrombosis, likely through de novo cue-dependent transcriptional up-regulation of IL-1β and inflammasome pathway genes (NLRP3, caspase-1). Finally, the fact that we also observed a concomitant increase in the relative expression of NLRP3, caspase-1, IL-1β, and IL-18 transcripts in peripheral blood cells of volunteers who developed VTE at high altitudes lends strong support to this proposition.
The hypoxic milieu in vivo has been proposed as a critical regulator of sterile inflammation and consequent pathological effects. The mechanistic basis appears to include modulation of intrinsic mitochondrial redox homeostasis (30), in addition to activation of toll-like-receptors and various danger signals such as ATP release from necrotic cells (31). The issue of hypoxia-induced inflammasome activation and the proinflammatory state breeding pathophysiological outcomes at high altitude encompasses conflicting studies and opinions (15, 32). Our transcriptome data revealed dense gene networks related to strong proinflammatory responses, involving both innate and adaptive immune cells (Fig. 3). Further, as described here, hypoxia-induced thrombosis could be circumvented by inflammasome inhibition, suggesting an early role of inflammation in this process. We also showed that inhibition of hypoxia response pathways (using pharmacological inhibitor or siRNA) prevented transcriptional up-regulation of NLRP3 and IL-1β with significant antithrombotic effects. Taken together, these results posit that hypoxia regulates significant pathological effects via its ability to promote the proinflammatory state.
Virtually all mechanistic understanding, elucidated to date, pertaining to specific forms of thrombosis keep complying with Virchow’s Triad, although in somewhat kaleidoscopic molecular patterns regulating individual hypercoagulable states (33). In keeping with the essence of this fact, venous and arterial thrombosis also appears to entail principally similar events, but conspicuously divergent origins. Although early endothelial injury is an established modus operandi of arterial thrombosis, it appears to be dispensable during early stages of venous forms that precipitate under diverse conditions and stimuli. A recent study showed that the NLRP3 inflammasome inhibitor, Arglabin, curtailed the atherogenic effect of high-fat diet in ApoE2.Ki mice (34). In view of such information, it is tempting to speculate that activation of NLRP3 inflammasome complex could constitute a unifying molecular cornerstone between diverse pathological states and various forms of thrombosis.
Hypercoagulable state is also known to predispose an individual to elevated risk for pulmonary embolism, which is a bigger clinical challenge and often more fatal, arising from increased thrombus dissemination. We too observed a somewhat similar phenomenon in our animal model with disseminated intravascular coagulation or hypercoagulation concomitant with elevated fibrinolytic activity, under hypoxic condition (Fig. 1). Conversely, a thrombotic state could also manifest as a result of skewing of homeostasis toward hypercoagulation due to a less-effective fibrinolytic system. Taken together, such arguments define an apparent paradigm for clinical significance and an area of future investigation. In view of our results, we posit that the strength of biological cues propagating individual pathways (coagulatory-fibrinolytic) critically regulate resultant effects with phenotypic manifestation such as localized thrombosis, consumptive coagulopathy, or pulmonary embolism.
In summary, our study revealed an important target, NLRP3 inflammasome, for hypoxia-induced venous thrombosis in addition to reinforcing an intriguing complexity involving intricately interacting coagulatory, thrombolytic, and inflammatory hubs at its core.
Materials and Methods
Detailed materials and methods are included in SI Materials and Methods.
Animal Experiments.
All experiments were conducted in compliance with guidelines of the Committee for Purpose of Control and Supervision of Experiments on Animals, Government of India. Male Sprague–Dawley rats, weighing 250–300 g, were used and exposed to hypobaric hypoxia, using environmental chamber simulating 429 torr. The IVC ligation model for in vivo thrombosis was used as previously described by us (19).
Human Studies.
Human studies were conducted in strict compliance with the ethical standards of Indian Council of Medical Research. Informed consent was obtained from the subjects as per Declaration of Helsinki. Young male patients with VTE (n = 18) evacuated from high-altitude regions to tertiary care facilities (Command Hospital Chandimandir, Chandigarh or Army Hospital, New Delhi) were enrolled. Equal numbers of healthy, age-matched male subjects with no prior history for VTE were included as controls.
Statistics.
Data are presented as mean ± SEM. The statistical significance of differences was evaluated using unpaired t test or Mann-Whitney test. Bonferroni post hoc test was done for multiple group comparison, using Prism 5 (GraphPad) software. The statistical significance of differences were represented as *P < 0.05, **P < 0.01, and ***P < 0.001.
Supplementary Material
Acknowledgments
We acknowledge Dr. Shashi B Singh, Directorate General Armed Forces Medical Services, Dr. Srishti Gupta, Dr. Iti Garg, and Dr. R. J. Tirpude for their support. This study was funded by Defence Research and Development Organization Project SL-10/DIP-255.
Footnotes
The authors declare no conflict of interest.
This article is a PNAS Direct Submission.
This article contains supporting information online at www.pnas.org/lookup/suppl/doi:10.1073/pnas.1620458114/-/DCSupplemental.
References
- 1.Zwicker JI, et al. Tumor-derived tissue factor-bearing microparticles are associated with venous thromboembolic events in malignancy. Clin Cancer Res. 2009;15:6830–6840. doi: 10.1158/1078-0432.CCR-09-0371. [DOI] [PMC free article] [PubMed] [Google Scholar]
- 2.Zhou X, et al. Incidence and risk factors of venous thromboembolic events in lymphoma. Am J Med. 2010;123:935–941. doi: 10.1016/j.amjmed.2010.05.021. [DOI] [PubMed] [Google Scholar]
- 3.Chan MY, Andreotti F, Becker RC. Hypercoagulable states in cardiovascular disease. Circulation. 2008;118:2286–2297. doi: 10.1161/CIRCULATIONAHA.108.778837. [DOI] [PubMed] [Google Scholar]
- 4.Demers C, et al. Incidence of venographically proved deep vein thrombosis after knee arthroscopy. Arch Intern Med. 1998;158:47–50. doi: 10.1001/archinte.158.1.47. [DOI] [PubMed] [Google Scholar]
- 5.Bendz B, Rostrup M, Sevre K, Andersen TO, Sandset PM. Association between acute hypobaric hypoxia and activation of coagulation in human beings. Lancet. 2000;356:1657–1658. doi: 10.1016/S0140-6736(00)03165-2. [DOI] [PubMed] [Google Scholar]
- 6.Lapostolle F, et al. Severe pulmonary embolism associated with air travel. N Engl J Med. 2001;345:779–783. doi: 10.1056/NEJMoa010378. [DOI] [PubMed] [Google Scholar]
- 7.Smallman DP, McBratney CM, Olsen CH, Slogic KM, Henderson CJ. Quantification of the 5-year incidence of thromboembolic events in U.S. Air Force Academy cadets in comparison to the U.S. Naval and Military Academies. Mil Med. 2011;176:209–213. doi: 10.7205/milmed-d-10-00144. [DOI] [PubMed] [Google Scholar]
- 8.Ward M. Mountain medicine: A clinical study of cold and high altitude. Crosby Lockwood Staples; London: 1975. [Google Scholar]
- 9.Zangari M, et al. Could hypoxia increase the prevalence of thrombotic complications in polycythemia vera? Blood Coagul Fibrinolysis. 2013;24:311–316. doi: 10.1097/MBC.0b013e32835bfdb9. [DOI] [PMC free article] [PubMed] [Google Scholar]
- 10.Anand AC, Saha A, Kumar R, Sharma V, Jha SK. Portal system thrombosis: A new dimension of high altitude illnesses. Trop Gastroenterol. 2000;21:172–173. [PubMed] [Google Scholar]
- 11.Cheng S, Chng SM, Singh R. Cerebral venous infarction during a high altitude expedition. Singapore Med J. 2009;50:e306–e308. [PubMed] [Google Scholar]
- 12.Jha SK, Anand AC, Sharma V, Kumar N, Adya CM. Stroke at high altitude: Indian experience. High Alt Med Biol. 2002;3:21–27. doi: 10.1089/152702902753639513. [DOI] [PubMed] [Google Scholar]
- 13.Gupta N, Ashraf MZ. Exposure to high altitude: A risk factor for venous thromboembolism? Semin Thromb Hemost. 2012;38:156–163. doi: 10.1055/s-0032-1301413. [DOI] [PubMed] [Google Scholar]
- 14.Mannucci PM, Gringeri A, Peyvandi F, Di Paolantonio T, Mariani G. Short-term exposure to high altitude causes coagulation activation and inhibits fibrinolysis. Thromb Haemost. 2002;87:342–343. [PubMed] [Google Scholar]
- 15.Eltzschig HK, Carmeliet P. Hypoxia and inflammation. N Engl J Med. 2011;364:656–665. doi: 10.1056/NEJMra0910283. [DOI] [PMC free article] [PubMed] [Google Scholar]
- 16.Rider P, et al. The transcription of the alarmin cytokine interleukin-1 alpha is controlled by hypoxia inducible factors 1 and 2 alpha in hypoxic cells. Front Immunol. 2012;3:290. doi: 10.3389/fimmu.2012.00290. [DOI] [PMC free article] [PubMed] [Google Scholar]
- 17.Mileno MD, et al. Coagulation of whole blood stimulates interleukin-1 beta gene expression. J Infect Dis. 1995;172:308–311. doi: 10.1093/infdis/172.1.308. [DOI] [PubMed] [Google Scholar]
- 18.Reitsma PH, Rosendaal FR. Activation of innate immunity in patients with venous thrombosis: The Leiden Thrombophilia Study. J Thromb Haemost. 2004;2:619–622. doi: 10.1111/j.1538-7836.2004.00689.x. [DOI] [PubMed] [Google Scholar]
- 19.Tyagi T, et al. Altered expression of platelet proteins and calpain activity mediate hypoxia-induced prothrombotic phenotype. Blood. 2014;123:1250–1260. doi: 10.1182/blood-2013-05-501924. [DOI] [PubMed] [Google Scholar]
- 20.Páramo JA. Prothrombin fragments in cardiovascular disease. Adv Clin Chem. 2010;51:1–23. doi: 10.1016/s0065-2423(10)51001-1. [DOI] [PubMed] [Google Scholar]
- 21.Warde-Farley D, et al. The GeneMANIA prediction server: Biological network integration for gene prioritization and predicting gene function. Nucleic Acids Res. 2010;38:W214–220. doi: 10.1093/nar/gkq537. [DOI] [PMC free article] [PubMed] [Google Scholar]
- 22.Lee K, et al. (Aryloxyacetylamino)benzoic acid analogues: A new class of hypoxia-inducible factor-1 inhibitors. J Med Chem. 2007;50:1675–1684. doi: 10.1021/jm0610292. [DOI] [PubMed] [Google Scholar]
- 23.Semenza GL. Life with oxygen. Science. 2007;318:62–64. doi: 10.1126/science.1147949. [DOI] [PubMed] [Google Scholar]
- 24.Semenza GL. HIF-1 and human disease: One highly involved factor. Genes Dev. 2000;14:1983–1991. [PubMed] [Google Scholar]
- 25.Martinon F, Mayor A, Tschopp J. The inflammasomes: Guardians of the body. Annu Rev Immunol. 2009;27:229–265. doi: 10.1146/annurev.immunol.021908.132715. [DOI] [PubMed] [Google Scholar]
- 26.Lindemann S, et al. Activated platelets mediate inflammatory signaling by regulated interleukin 1beta synthesis. J Cell Biol. 2001;154:485–490. doi: 10.1083/jcb.200105058. [DOI] [PMC free article] [PubMed] [Google Scholar]
- 27.Denis MM, et al. Escaping the nuclear confines: Signal-dependent pre-mRNA splicing in anucleate platelets. Cell. 2005;122:379–391. doi: 10.1016/j.cell.2005.06.015. [DOI] [PMC free article] [PubMed] [Google Scholar]
- 28.Hottz ED, et al. Platelets mediate increased endothelium permeability in dengue through NLRP3-inflammasome activation. Blood. 2013;122:3405–3414. doi: 10.1182/blood-2013-05-504449. [DOI] [PMC free article] [PubMed] [Google Scholar]
- 29.Brown GT, Narayanan P, Li W, Silverstein RL, McIntyre TM. Lipopolysaccharide stimulates platelets through an IL-1β autocrine loop. J Immunol. 2013;191:5196–5203. doi: 10.4049/jimmunol.1300354. [DOI] [PMC free article] [PubMed] [Google Scholar]
- 30.Usui F, et al. Inflammasome activation by mitochondrial oxidative stress in macrophages leads to the development of angiotensin II-induced aortic aneurysm. Arterioscler Thromb Vasc Biol. 2015;35:127–136. doi: 10.1161/ATVBAHA.114.303763. [DOI] [PubMed] [Google Scholar]
- 31.Weinberg SE, Sena LA, Chandel NS. Mitochondria in the regulation of innate and adaptive immunity. Immunity. 2015;42:406–417. doi: 10.1016/j.immuni.2015.02.002. [DOI] [PMC free article] [PubMed] [Google Scholar]
- 32.Wanderer AA. Hypoxia and inflammation. N Engl J Med. 2011;364(20):1976. doi: 10.1056/NEJMc1103019. [DOI] [PubMed] [Google Scholar]
- 33.López JA, Chen J. Pathophysiology of venous thrombosis. Thromb Res. 2009;123:S30–S34. doi: 10.1016/S0049-3848(09)70140-9. [DOI] [PubMed] [Google Scholar]
- 34.Abderrazak A, et al. Anti-inflammatory and antiatherogenic effects of the NLRP3 inflammasome inhibitor arglabin in ApoE2.Ki mice fed a high-fat diet. Circulation. 2015;131:1061–1070. doi: 10.1161/CIRCULATIONAHA.114.013730. [DOI] [PubMed] [Google Scholar]
- 35.Trapnell C, et al. Differential gene and transcript expression analysis of RNA-seq experiments with TopHat and Cufflinks. Nat Protoc. 2012;7:562–578. doi: 10.1038/nprot.2012.016. [DOI] [PMC free article] [PubMed] [Google Scholar]
Associated Data
This section collects any data citations, data availability statements, or supplementary materials included in this article.


