

Abstract
Recent clinical trials have demonstrated that targeting chromatin remodeling factors is as a promising strategy for the treatment of glioblastoma (GBM). We and others have shown constitutive activation of DNA damage response (DDR) pathways in gliomas and suggested that targeting the DDR may improve the currently grim prognosis for patients. Based on our previous findings that inhibition of poly(ADP‐ribose) polymerase (PARP) increases radio‐sensitivity of the notoriously radio‐resistant GBM cells, we hypothesized that epigenetic down‐regulation of the DDR responses and induction of oxidative stress via HDAC inhibition would contribute to more efficient targeting of this deadly disease. Our data show that SAHA, an HDAC class I + II inhibitor, in combination with olaparib (PARP inhibitor): i) enhanced inhibition of GBM cell survival, ii) induced apoptosis, and iii) impaired cell cycle progression. These results provide a pre‐clinical rationale for combined administration of SAHA and olaparib, which are already individually in clinical trials.
Keywords: Glioblastoma, Genotoxic stress, DNA repair, SAHA, Olaparib
1. Introduction
Glioblastoma (GBM) is among the deadliest of solid cancers with striking genomic instability and therapeutic resistance. Despite extensive efforts, the prognosis of patients suffering from this aggressive disease remains poor with median survival of approximately 15 months (Chen et al., 2012; Huse et al., 2011; Stupp et al., 2005; Tanaka et al., 2013). The standard of care represents maximal‐safe surgical resection followed by chemo‐radiation (Stupp et al., 2005). Based on successful pre‐clinical models, numerous clinical trials have investigated the efficacy of novel therapies, but over the past few decades, only limited success in increasing the survival of GBM patients has been achieved.
High intra‐ and inter‐tumoral heterogeneity, together with complex cellular plasticity and de‐regulated signaling pathways, are the plausible causes of resistance to existent therapies in GBM. Several reports have shown constitutive activation of the DNA damage response (DDR) in malignant gliomas due to ongoing oxidative and replication stress (Bartkova et al., 2010; Rivera et al., 2015; Squatrito et al., 2010; Venere et al., 2014).
Proper repair of DNA lesions requires them to be accessible to DNA repair machinery. DNA accessibility can be modulated by several mechanisms including post‐translational modification of histones thereby either stabilizing or destabilizing nucleosome structure. Histone deacetylation is mediated by histone deacetylases (HDACs). HDACs catalyze removal of acetylated residues from histones, leading to chromatin condensation and transcriptional repression. Chromatin condensation, moreover, impairs recruitment of DNA repair factors and results in accumulation of DNA breaks. In the past several years, HDAC inhibitors have been used as radio‐ and chemo‐sensitizers in GBM (Lucio‐Eterovic et al., 2008, 2015, 2011, 2011). They induce differentiation, growth arrest and apoptosis in numerous malignant cells in vitro and in vivo (Eyupoglu et al., 2005, 2006, 2015, 2015, 2011, 2011, 2007). The HDAC inhibitor suberoylanilide hydroxamic acid (SAHA) has been well tolerated as a monotherapy in patients with recurrent GBM and exhibited modest single‐agent activity (Galanis et al., 2009).
Due to continuous exposure to endogenous and exogenous DNA‐damaging insults, cells accumulate DNA damage such as single‐strand DNA breaks (SSBs) and double‐strand DNA breaks (DSBs) that require constant surveillance and activation of the DDR. The breast cancer susceptibility proteins BRCA1 and BRCA2 are key components of the homologous recombination repair (HR) and loss of function of either protein is associated with a significant increase in cancer susceptibility (Rigakos and Razis, 2012; Turner et al., 2004). Approximately 50% of serous epithelial ovarian carcinomas and 5–10% of all breast cancers contain defects in HR, rendering them dependent on other DNA repair pathways likes single‐strand DNA base excision repair (SSBR), where the poly‐ADP‐ribose polymerase (PARP1) pays a crucial role. Synthetic lethality involves targeting parallel DNA repair pathways so that lesions generated by abrogation of one pathway are rendered lethal by blocking another. The concept of synthetic lethality is best illustrated by the marked sensitivity of BRCA1 or BRCA2 deficient breast or ovarian cancers to chemical inhibition of PARP (Lord et al., 2015). Over the past two decades, PARP inhibitors have been developed with the aim of counteracting DNA repair‐mediated resistance of cancer cells to chemo‐radio‐therapy. Several reports indicate that successful targeting of PARP, a primary sensor of SSBs breaks, can sensitize GBM cells to ionizing radiation and chemotherapy despite functional HR and BRCA1/2 genes being intact (Auffinger et al., 2015, 2009, 2008). Currently, olaparib (AZD2281), which is a potent inhibitor of PARP1/2, is in a phase I clinical trial in combination with temozolomide in patients with relapsed GBM (https://clinicaltrials.gov). To date, there is no BRCA1/2‐specific inhibitor available. Kachhap et al. (2010) have shown that SAHA treatment of prostate cancer cells leads to down‐regulation of HR genes and this effect is mediated through decreased recruitment of the E2F1 transcription factor (Kachhap et al., 2010). SAHA has been found active against a broad range of cancer types including GBM and is now undergoing testing in clinical trials (https://clinicaltrials.gov). Based on the previously reported SAHA‐mediated down‐regulation of HR genes, reminiscent of BRCA1‐null phenotype, we hypothesized that due to pre‐existent high level of genotoxic stress in GBM cells, SAHA may sensitize these to PARP inhibition and so lead to more efficient eradication of therapeutically resistant GBM cells.
2. Material and methods
2.1. Cell isolation and culturing
Xenografted GBM cells GBM01 (IN1123), GBM02 (IN84) were a generous gift from Dr. I. Nakano (The University of Alabama at Birmingham, USA). NB34 and GBM03 (4121) cells were provided by Dr. JN Rich (Cleveland Clinic, USA). GBM cells were derived from neurosurgical resections directly from patients in accordance with a Ohio State University or Cleveland Clinic Institutional Review Board‐approved protocol in which informed consent was obtained by the tumor bank which provided deidentified excess tissue to the laboratory. GBM04 cells were derived at the Danish Cancer Society Research Center in the accordance with Danish Ethical Committee guidelines including an informed consent acquired 24 hrs prior to surgery. Whole Brain Extract (WBE) used for immunoblot analysis in Figure 1A was purchased from Novus Biologicals. GBM cells were maintained through subcutaneous xenografting in the flanks of BALB/c (nu/nu) mice. Tumors were dissected out and dissociated using papain dissociation system (Worthington Biochemical). Acutely (max culture time 24 hrs post dissection from mice) dissociated cells were cultured in Neurobasal A media supplemented with B27 Supplement Minus vitamin A (Invitrogen), epidermal growth factor and basic fibroblast growth factor (10 ng/ml, Invitrogen). Cells were cultured at 37 °C in an atmosphere of 5% CO2. For cell counting before each experiment, single‐cell suspension was prepared using TrypLE (Invitrogen).
Figure 1.
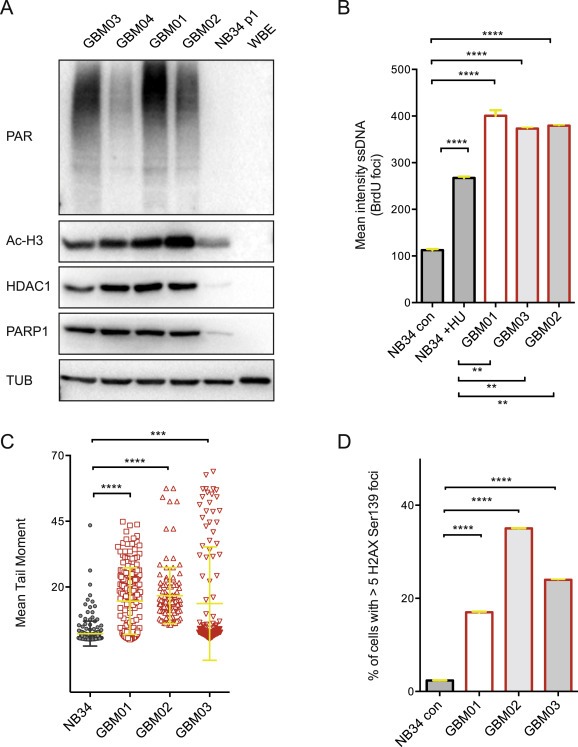
Increased expression of HDAC1 and PARP1 in GBM cells correlates with higher level of SSBs and DSBs. (A) Immunoblot analysis showing increased expression of HDAC1, PARP1, acetylated H3 levels and the degree of PARYlation in 4 selected GBM xenografts (GBM01‐04) in comparison to non‐neoplastic brain control cells NB34 and whole brain extract (WBE). (B) The incorporation of BrdU under non‐denaturation conditions was measured to evaluated the level of ssDNA in GBM01‐03 and NB34 non‐treated or treated with 2 mM HU for 2 hrs. (C) Mean Tail Moment was measured to compare the amount of DSBs in GBM01‐03 and NB34 cells. (D) % of cells with >5H2AX Ser139 foci per cell – a marker of DSB was quantified and compared between GBM01‐03 and NB34 cells. Data are shown as mean ± SD. ***p < 0.001; ****p < 0.0001.
2.2. Immunoblot analyses
Whole‐cell extracts were separated by 6% or 15% SDS‐PAGE and transferred to nitrocellulose membranes (Bio‐Rad) using wet electroblotting system (Bio‐Rad laboratories). Membranes were blocked using 5% (wt/vol) dry milk in PBS‐Tween‐20 (0.5% vol/vol) and probed with appropriate primary antibodies against BRCA1 (Bethyl laboratories, IHC‐00278, 1:500), H3(Acetyl) (Upstate, 06–559, 1:12,000), PAR (GeneTex, GTX75054, 1:500), Rad51 (Abcam, ab213, 1:250), PARP1 (Enzo, BML‐SA250, 1:3000), 53BP1 (Santa Cruz, sc22760, 1:500), DNA ligIV (Abcam, ab26039, 1:100), NBS1 (Genetex, GTX70224, 1:1000), p21 (DCS61, 1:100), HDAC1 (Abcam, ab109411, 1:20,000), or α‐tubulin (Sigma–Aldrich, T9026‐2ML, 1:10,000) as loading control. ECL detection system was used according to manufacturer's instructions (GE Healthcare).
2.3. Small molecule inhibitors and EC50 calculations
The PARP inhibitor (olaparib; Selleck Chemicals, AZD2281) and Vorinostat (SAHA, Selleck Chemicals, MK0683) were dissolved in DMSO at 5 mg/ml. DMSO at a final percentage equivalent to that of the drug stock solution served as vehicle control for all studies. For each cell line, the appropriate EC50 concentration of both olaparib and SAHA was calculated and used for all further experiments. For EC50 calculation, acutely dissociated single cells were plated (3000 cells/well in a 96‐well in triplicate). The next day, vehicle or drug was added and cell viability was measured using CellTiter‐Glo Luminescent Cell Viability Assay (Promega) 72 h later. EC50s were calculated using non‐linear regression in GraphPad Prism Software.
2.4. Cell viability
Acutely dissociated cells were plated into a 96‐well plate at 3000 cells/well in triplicates. The next day, vehicle, olaparib, SAHA or a combination of the two (EC50) were added and cell viability was measured over a period of 7 days using CellTiter‐Glo Luminescent Cell Viability Assay (Promega) and results were calculated as relative fold change in ATP with each group internally normalized to the respective vehicle control.
2.5. Immunofluorescence and microscopy
Immunofluorescence staining of γH2AX (Millipore, 05–636, 1:1000) was performed as described previously (Bartkova et al., 2010). GBM cells were grown on GelTrex (Invitrogen)‐coated coverslips and treated with vehicle, olaparib, SAHA or a combination of olaparib and SAHA for 72 h. Subsequently, cells were fixed with 4% PFA and immunostained with the indicated primary antibody. Nuclei were counterstained with DAPI (Sigma–Aldrich). For PARP1 (BD Pharmingen, 556,362, 1:500) staining, cells were treated with SAHA, pre‐extracted using 0.15% Triton‐x‐100 in PBS for 1 min on ice and then fixed and stained as described above. LSM700 confocal microscope (Zeiss) using ZEN2010 software was used for image acquisition. Quantification of ssDNA was measured as described previously (Bartkova et al., 2010; Groth et al., 2007). Quantification of ssDNA was performed by measuring the mean intensity of BrdU foci staining (incorporated BrdU detected under non‐denaturing conditions; anti‐BrdU primary antibody, BD Pharmingen; 1:300). For H2AX Ser139 staining, we scored the frequency of cells with >5 foci per cell (Tu et al., 2013). For quantification, 100 non‐overlapping images were acquired for each condition using the ScanˆR screening station (Olympus). At least 1000 cells were scored and processed using ScanˆR Analysis software (Olympus).
2.6. Flow cytometry and cell cycle analysis
Flow cytometry was performed using FACS Verse Cell Sorter (BD Biosciences) and analyzed using FlowJo software. For Annexin V staining, cells were labeled with Alexa Fluor 488‐conjugated Annexin V for 15 min in Annexin V‐binding buffer according to the manufacturer's instructions (Invitrogen). For cell cycle analysis, cells were fixed with 70% ice‐cold ethanol and incubated 30 min on ice. Next, cells were incubated for 45 min at 37 °C with 10 μg/ml of propidium iodide and 5 μg/ml of ribonuclease A in PBS. Measurement of ROS and 8‐oxo‐2'‐deoxyguanosine levels was measured as described previously (Venere et al., 2014).
2.7. Alkaline comet assay
Single‐cell gel electrophoresis under alkaline conditions was performed as described previously (Olive et al., 1992; Singh et al., 1988). Briefly, cells were harvested into a single‐cell suspension in Neurobasal A media, mixed with 0.5% low‐melting‐point agarose (Gibco) in PBS and spread on a microscope slide pre‐coated with 1% normal‐melting‐point agarose (Invitrogen). Cells were lysed over night (2.5 M NaCl, 100 mM EDTA, 10 mM Tris, 1% Triton X‐100) and subsequently rinsed in neutralization buffer (0.4 M Tris–HCl, pH 7.4). Electrophoresis was carried out in alkaline electrophoresis solution at 25 V for 25 min and fixed in 96% ethanol. DNA was stained using SYBR Green I (Molecular Probes), visualized using fluorescence microscopy (Axiovert 200M, Carl Zeiss) and analyzed using Comet Assay IV software. The mean of at least 200 olive tail moments (OTMs) was calculated. OTM is the product of the amount of DNA in the tail and the mean distance of migration in the tail.
2.8. Retrospective analysis of PARP1 and HDAC1 gene expression in normal brain and gliomas
The analysis of PARP1 and HDAC1 expression and Pearson correlation in normal brain controls and human gliomas (WHO grades II, III, IV) was performed using The Cancer Genome Atlas (TCGA) dataset, which is available through GlioVis (http://gliovis.bioinfo.cnio.es/) (Bowman R. and Squatrito M. manuscript in preparation).
2.9. Homologous recombination assay
Homologous recombination (HR) efficiency was evaluated using the Traffic Light Reporter (TLR) system (Certo et al., 2011). pCVL Traffic Light Reporter 1.1 (SceI target) EF1 Puro and pCVL‐SFFVd14GFP EF1sHA.NLS.Sce (opt) were a gift from A. Scharenberg (Addgene plasmid #31482 and #31476). We performed assays using GBM03 cells with a stably integrated TLR construct, which if cut with ISceI and repaired accurately using the provided donor sequence results in the restoration of an intact GFP sequence. At 6 h after SAHA treatment, the cells were co‐transfected with DNA plasmids containing an HR donor and ISceI enzyme. At 72 h post treatment, cells were harvested and analyzed by flow cytometry. Data shown are normalized non‐transduced control cells (not infected with ISceI carrying virus). ATR inhibitor AZ20 (ATRi, Selleck Chemicals) was used as a positive control for HR inhibition (Krajewska et al., 2015).
2.10. Statistical analysis
All experiments were performed 3 times in triplicate and values are represented as mean ± SD. GraphPad Prism Software (GraphPad Software, Inc.) was used to examine statistical significance with Student's t‐test by log‐rank or one‐way ANOVA.
3. Results
3.1. GBM cells exhibit significantly higher expression levels of HDAC1 and PARP1 compared to non‐neoplastic brain control
To lay out the foundation for combined targeting of HDACs and PARP, we evaluated the baseline levels of HDAC1 (a representative member of Class I histone deacetylases, which is a target of SAHA) and PARP1 (Figure 1A). In agreement with previously published data, HDAC1 protein levels were significantly elevated in GBM cells compared to non‐neoplastic controls (NB34 and WBE) (Lucio‐Eterovic et al., 2008). Overall, PARP1 protein levels as well as global protein PARylation in all GBM lines were significantly increased in comparison to non‐neoplastic brain tissue controls. These findings were further supported by in silico analysis of PARP1 and HDAC1 expression in normal human brain and gliomas (WHO grades II–IV) using the GlioVis search engine. As shown in Supplementary Figure S1, both PARP1 and HDAC1 mRNA levels are significantly elevated in GBM when compared to normal brain controls. Furthermore, the HDAC1 mRNA levels correlate with increasing degree of malignancy in gliomas (WHO grade II < WHO grade III < WHO grade IV). Interestingly, PARP1 mRNA levels in WHO grade IV (GBM) were significantly lower in comparison to WHO grades II and III gliomas.
It has been shown that both PARP and HDAC overexpression renders cancer cells highly dependent on these enzymes for survival and evasion of DNA‐damaging therapies (Dungey et al., 2009, 2005, 2006, 2014, 2015, 2015, 2011). Our data show overall lower quantity of ssDNA and DSBs in NB34 cells (approximately 4‐fold less ssDNA and 7 to 10‐fold less DSBs in comparison to GBM01, 02, 03), which was assessed by BrDU incorporation (under non‐denaturating conditions; Figure 1B), comet assay and H2AX Ser139 foci quantification, respectively (Figure 1C, D). Interestingly, when exposed to exogenous replication stress (2 mM hydroxyurea (HU) for 2 h), the level of ssDNA in NB34 cells significantly increased by 2‐fold, yet remained markedly lower when compared to herein examined GBM cells (Figure 1B).
3.2. Concurrent administration of PARP1 and SAHA has enhanced inhibitory effect on DDR activation and DNA repair capacity of GBM cells
Our previous studies demonstrated that PARP inhibition using olaparib preferentially sensitizes the highly resistant GBM cells to ionizing radiation (Venere et al., 2014). Olaparib has been shown to exhibit higher efficacy in BRCA1‐null cancers defective in HR. SAHA treatment of ovarian carcinomas has been shown to result in down‐regulation of HR genes including BRCA1 and Rad51 among others (Kachhap et al., 2010). Therefore, we sought to evaluate the effect of SAHA on the expression of several key DDR proteins using immunoblot analysis. First, we calculated the half maximal effective concentration (EC50) for both SAHA and olaparib in 3 xenografted GBM lines (GBM01, GBM02, GBM03) and non‐neoplastic brain control cells NB34 (Figure 2). Here, cells were treated with increasing concentration of individual drugs for a period of 72 hrs and the effect on cell viability was measured using an ATP‐based assay. The treatment of GBM cells with their respective EC50 doses led to decreased expression of several key DDR factors involved in HR (BRCA1, NBS1, Rad51) after SAHA treatment and this was further potentiated after combined administration of SAHA with olaparib (Figure 3A). To elucidate, whether the observed decrease in BRCA1 and Rad51 levels is associated with impaired HR, we employed Traffic Light Reporter system (Certo et al., 2011) to measure the HR frequency in GBM03 cells after SAHA treatment. As shown in Figure 3B, SAHA (EC50 for 72 hrs) treatment significantly impaired the HR capacity of GBM03 cells (mean = 2.1, SD ± 0.86) in comparison to DMSO control (mean = 3.6, SD ± 0.43). Here, ATR inhibitor (ATRi) has been used as a positive control and reduced the HR frequency almost 3‐fold (mean = 1.2; SD ± 0.1) compared to DMSO control (Figure 3B).
Figure 2.
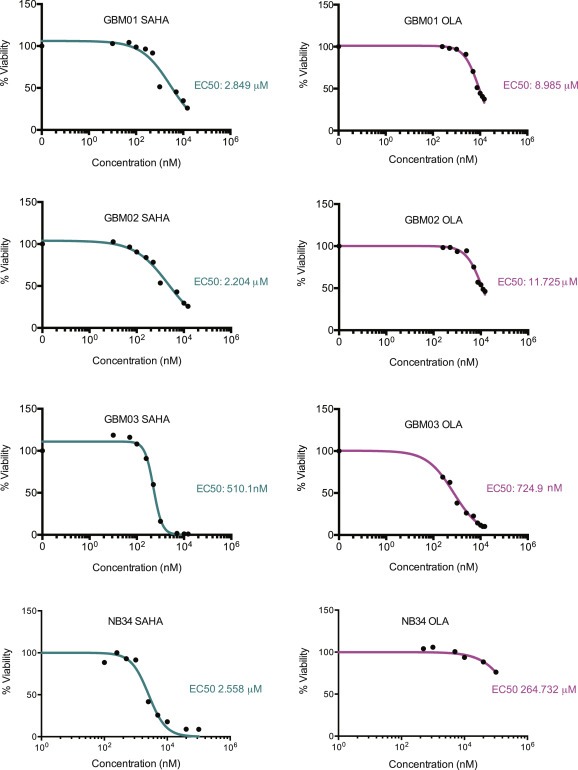
GBM cells show comparable response to SAHA and olaparib and NB34 cells exhibit significantly higher resistance to olaparib only. The inhibitory effect of SAHA and olaparib were measured using an ATP‐based assay. The cells were exposed to increasing drug concentrations for a period of 72 h. The percentage of surviving cells is presented in a graph with indicated IC50 values calculated using Prism software.
Figure 3.
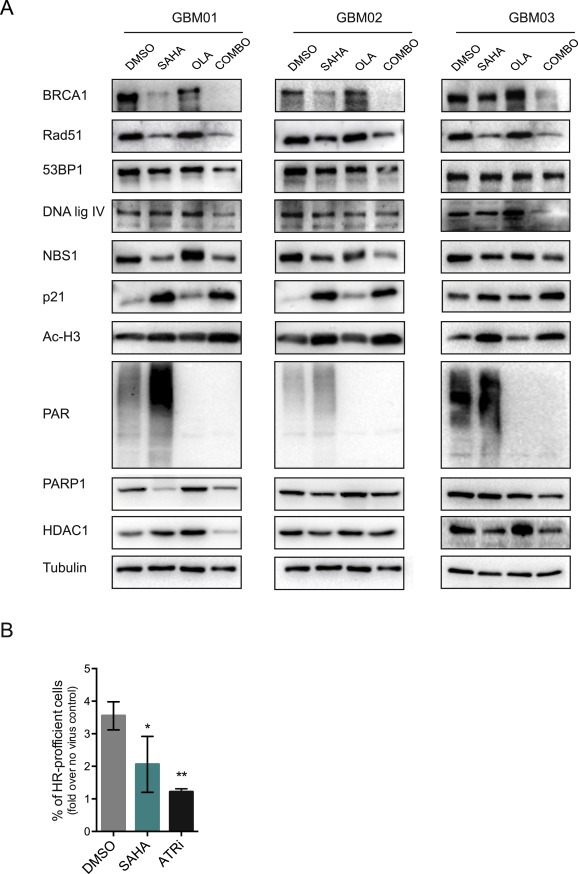
SAHA and olaparib treatment results in decreased expression levels of key DNA repair proteins. (A) Immunoblot analysis of BRCA1, Rad51, 53BP1, DNA ligase IV, NBS1, PARP1 and HDAC1 in protein extracts from GBM cells (GBM01‐03) treated with respective EC50 concentration of SAHA and olaparib alone or in combination. (B) SAHA treatment impairs the HR capacity of GBM03 cells.
Combined SAHA/olaparib application led to a decrease in HDAC1 and PARP1 levels and in agreement with previous reports, SAHA treatment led to increased p21 levels, indicative of impaired cell cycle progression. It has been reported previously that HDAC inhibition contributes to ROS production (Cornago et al., 2014). Interestingly, SAHA treatment of GBM cells (EC50) for 72 h led not just to increased ROS, but also oxidative base DNA damage, as measured by DCFDA probe and the levels of 8‐oxo‐2'‐deoxyguanosine, respectively (Figure 4A,B). Intriguingly, we have observed an increase in PARylation levels post SAHA treatment in all three GBMs, indicating that SAHA indeed stimulates PARP activation and PARylation of its downstream targets. In addition, confocal microscopy analysis revealed enhanced PARP1 recruitment to nucleus after SAHA treatment (only nuclear PARP1 positivity) in comparison to DMSO‐treatment control (mixed population of cells with: cytosolic, cytosolic & nuclear or nuclear staining; Figure 4C). These findings allowed us to speculate that not only the down‐regulation of key DDR proteins associated with impaired HR, but also that the increased level of oxidative and replication stress upon SAHA treatment made GBM cells dependent on PARP and therefore combined administration of SAHA and olaparib may represent more effective strategy to target therapeutically resistant GBM cells.
Figure 4.
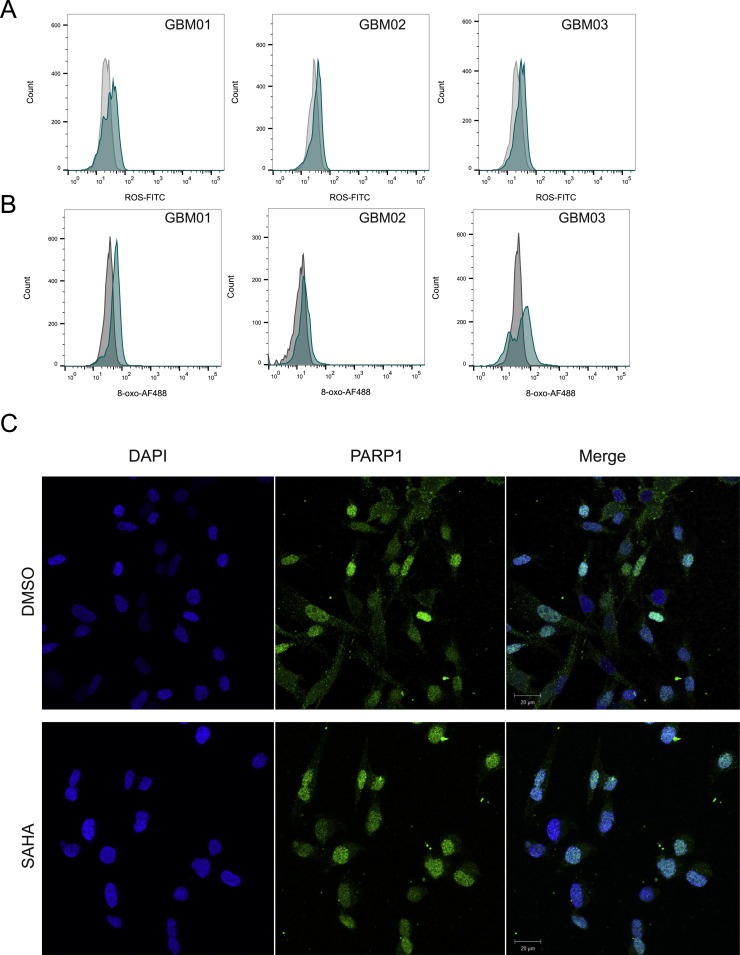
SAHA treatment induces ROS production (A) and oxidative DNA lesions (B). (C) PARP1 is localized both in the cytosol and nucleus of GBM cells in DMSO‐treated cells, whereas nuclear translocation in GBM cells occurs after SAHA treatment.
As shown in Figure 5, SAHA‐mediated down‐regulation of DDR proteins and induction of oxidative stress translated into impaired resolution of DSBs. Olaparib treatment led to the accumulation of DSB to approximately the same extend as SAHA alone. As shown by 2 independent assays (H2AX Ser139 foci quantification and comet assay), the accumulation of DSBs was significantly increased when these two drugs were combined, thereby confirming the enhanced efficacy of SAHA and olaparib in impairing the DNA repair capacities of GBM cells.
Figure 5.
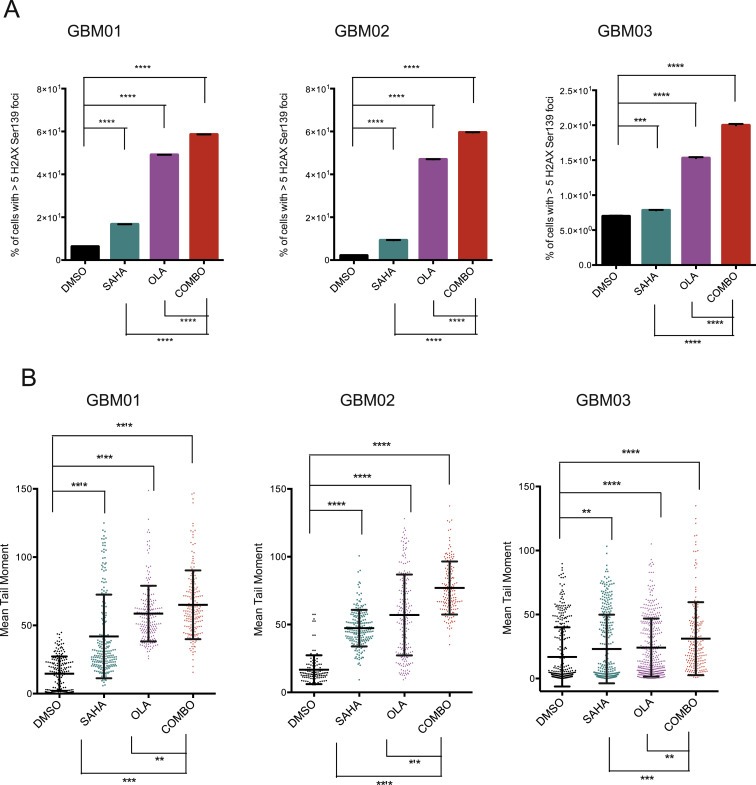
HDAC inhibition by SAHA (EC50) leads to DSBs accumulation to approximately the same extend as olaparib (OLA; EC50). Combined administration (COMBO) of SAHA and Olaparib shows significantly enhanced induction of DSBs as measured by % of cells with >5H2AX Ser139 foci per cell (A) and tail moment using comet assay (B). Data are shown as mean ± SD. **p < 0.01; ***p < 0.001; ****p < 0.0001.
3.3. Concurrent administration of olaparib and SAHA decreased GBM cell survival due to higher rates of apoptosis and impaired cell cycle progression
To explore the consequences of combining SAHA and olaparib on the induction of genotoxic stress in GBM cells; subsequent changes in viability, apoptosis rates and cell cycle kinetics were evaluated. Whereas the EC50 of SAHA or olaparib alone resulted in an approximately 50% decrease in cell viability, the combination of the two exhibited an enhanced inhibitory effect with a surviving cell fraction of approximately 25% in all 3 GBM lines tested (Figure 6A). In correlation with the lowered viability, SAHA together with olaparib potentiated a significant increase in apoptotic cell fraction from 20 to 30% (single treatments) up to 35–40% (Figure 6B). Prominent induction of sub‐G1 phase in the combinatory treatment compared to single drug administration further supported the evidence that SAHA together with olaparib enhanced the induction of apoptosis due to accumulation of unrepaired SSBs and DSBs in GBM cells (Figure 6C). To further characterize the GBM cell response to SAHA and olaparib, we analyzed the cell cycle distribution by fluorescence‐activated cell sorting (FACS) (Figure 6C and Supplementary Figure S2). SAHA alone resulted in G2/M arrest in GBM01 and GBM03 cells, decrease in S‐phase and a mild G1 arrest in GBM02 and GBM03 cells. Olaparib alone led to G2/M arrest in all 3 GBM lines. The combination of SAHA and olaparib reduced the number of proliferating cells and induced a pronounced G2/M arrest in all 3 GBM lines.
Figure 6.
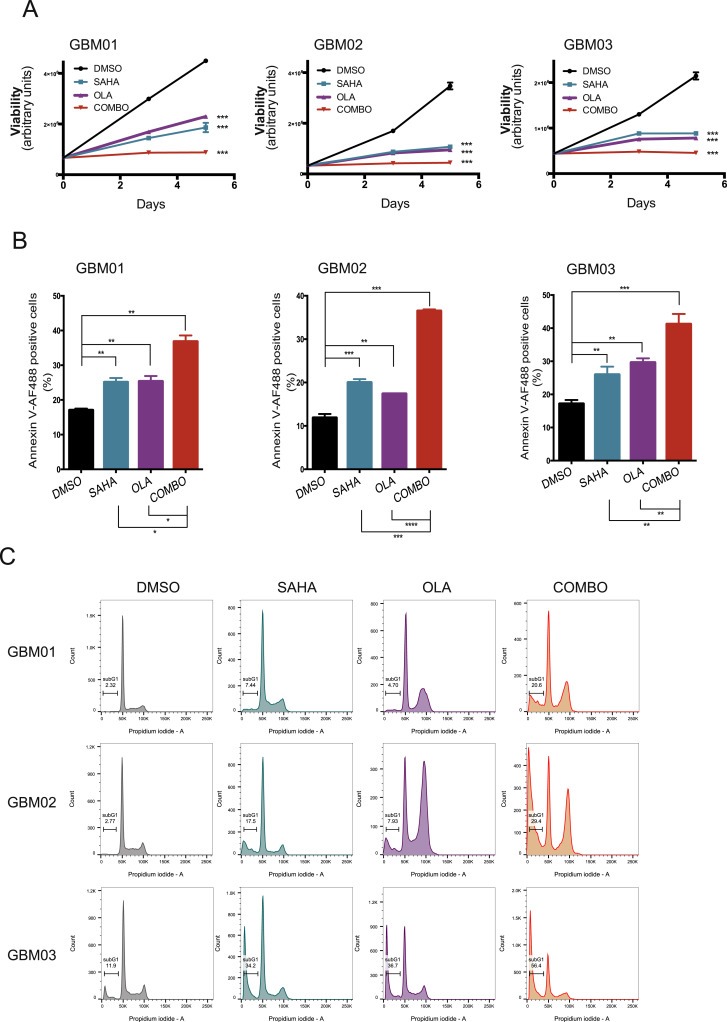
Combination of SAHA and olaparib (OLA) significantly impaired GBM cell viability, induces apoptosis and impedes cell cycle progression. (A) Compared to single treatment, the drug combination (COMBO) significantly decreases cell viability assessed by ATP‐based assay. Cells were exposed to their respective EC50 and measurements were performed 72 h post treatment. (B) GBM cells were treated with their respective EC50s for 72 h and the percentage of early apoptotic cells was measured using Annexin V staining and FACS. Data are shown as mean ± SD. **p < 0.01; ***p < 0.001; ****p < 0.0001. (C) GBM cells were treated with their respective EC50s and 72 h later, the DNA content was analyzed using FACS. The percentage of sub‐G1 cells was significantly higher in the COMBO group in comparison to single treatments (SAHA; OLA) or vehicle control (DMSO).
4. Discussion
Currently available radio‐chemotherapy modalities have not significantly improved the outcome for patients with malignant gliomas in general, and glioblastoma (GBM, WHO grade IV), in particular (Chamberlain, 2011; Tanaka et al., 2013). Rampant genomic instability (GI) is a key feature of malignant gliomas. Together with the constitutively active DNA damage response signaling, GI contributes to therapeutic resistance and high recurrence rates. PARP inhibition has been shown to be efficient in eradicating GBM cells in vitro and in vivo, either alone or in combination with chemo‐radiation (Dungey et al., 2009; Venere et al., 2014). Moreover, several clinical trials evaluating a number of PARP inhibitors are ongoing with the hope for significant improvement of GBM patients' survival (https://clinicaltrials.gov). Histone deacetylases (HDACs) have recently become recognized as a promising target for cancer therapy, including for the treatment of GBM. HDACs, together with histone acetylases (HATs), are responsible for chromatin structure remodeling, thereby regulating the expression levels of numerous genes essential for cancer cell survival. SAHA (Vorinostat) is the first FDA‐approved HDAC inhibitor and has been successfully used in the treatment of cutaneous T‐cell lymphoma, which prompted the development of other small molecule HDAC inhibitors for clinical use (Jain et al., 2012). Although HDAC inhibitors have shown promise in many cancer types, they are not as effective against solid tumors as a monotherapy, partly due to poor pharmacokinetic properties (Park et al., 2008, 2007, 2015, 2011). Therefore, the identification of putative sensitizers is highly clinically relevant. A number of HDAC inhibitors have been suggested to impede the HR pathway functionality and so mimic an HR‐deficient phenotype, resulting in increased PARP inhibitor sensitivity (Ha et al., 2014; Mendes‐Pereira et al., 2009; Min et al., 2015). Therefore, the main objective of our study was to evaluate the combinational effect of simultaneous PARP and HDAC inhibition on GBM cell survival and maintenance. Firstly, we have used immunoblot analysis to show that both PARP1 and HDAC1 are overexpressed in GBM cells when compared to non‐neoplastic brain controls (Figure 1A). The in silico analysis using GlioVis search engine supports these findings as both PARP1 and HDAC1 mRNA levels were found significantly elevated in GBM when compared to normal brain control (Supplementary Figure S1). Interestingly, we have not observed a correlation between HDAC1 levels and the degree of H3 acetylation in low‐expressing NB34 non‐neoplastic control brain cells. Moreover, the EC50 SAHA value for NB34 cells was comparable to that of GBM cells (Figure 2). It has been reported that higher levels of acetylated H3 correlate with higher transcriptional activity in GBM (Ha et al., 2014; Hanson et al., 2013; Hockly et al., 2003; Lucio‐Eterovic et al., 2008). Despite reports showing histone hyperacetylation and apoptosis after SAHA treatment of normal human astrocytes, these effects did not translate into neurotoxicity during systemic administration of SAHA in a mouse model (Hockly et al., 2003). More importantly, recent studies implicate excess HDAC function in Alzheimer's disease (AD) and suggest the use of such drugs as SAHA to improve cognitive functions (Graff et al., 2012). It is worth noting that malignant melanoma cells and acute myeloid leukemia cells have been shown to be more sensitive to HDACi induced DNA damage and apoptosis than their matched non‐malignant cells (Boyle et al., 2005; Petruccelli et al., 2011). These reports and the fact that SAHA is already in clinical trials in GBM patients indicate that the in vitro sensitivity of our control NB34 cells is most probably a consequence of in vitro propagation of otherwise in vivo quiescent non‐proliferative cells.
Our data show an enhanced inhibitory effect of simultaneous PARP and HDAC administration on GBM cell survival and cell cycle progression. Our findings correlate with recent reports for ovarian and breast cancer (Konstantinopoulos et al., 2014; Min et al., 2015), and show that these effects are attributable to the down‐regulation of HR repair pathway genes, impaired HR efficiency and increased accumulation of DSBs. We have also observed down‐regulation of proteins involved in NHEJ and more importantly, decrease in HDAC1 and PARP1 levels when SAHA and olaparib were in combination. Interestingly, SAHA in combination with olaparib resulted in further decrease in all DDR marker expression evaluated in immunoblot analysis (Figure 3A). Interestingly, the exposure of GBM cells to SAHA led to increased PARylation levels and nuclear PARP1 translocation (Figure 4C), which implies higher dependence of SAHA exposed cells on functional PARP. A novel finding from the current investigation is the SAHA‐mediated induction of ROS translates into increased formation of oxidative DNA lesions, which renders GBM cells dependent on functional PARP, a primary sensor in the repair of oxidative stress and DNA damage repair (Dungey et al., 2009; Venere et al., 2014). BRCA1 and Rad51 are the key factors involved in HR‐mediated DSB repair (Wu et al., 2010). Our recent work has shown that malignant gliomas display robust genomic instability, which requires constitutive activation of DNA damage responses including the recruitment and activation of BRCA1/Rad51 signaling axes (manuscript in preparation). Therefore, we performed additional in silico analysis, which has revealed significant correlation of PARP1 as well as HDAC1 mRNA levels with both BRCA1 and Rad51 in TCGA GBM dataset (Supplementary Figure S3). No correlation was found in healthy brain controls. These findings indicate the inter‐dependence of chromatin remodeling (HDAC activity) and DDR activation (BRCA1/Rad51 and PARP1) for survival of highly genetically unstable GBM cells.
Altogether, as demonstrated in this study, the combination of olaparib and SAHA exerts significantly enhanced effects against GBM cells due to decreased capacity of DNA repair and subsequent induction of apoptosis. Either of the inhibitors alone had an impact on cell cycle kinetics, but their combination led to decrease in S‐phase and accumulation of cells in G2/M, which is in agreement to previous report in a breast cancer model (Min et al., 2015). Despite the cell cycle checkpoint activation, the amount of DSBs (measured by comet assay and activation of the key sensor of DNA damage H2AX Ser139) was detrimental and resulted in apoptosis of these otherwise highly aggressive cells (evaluated by Annexin V staining). After treating GBM cells with SAHA and olaparib, we observed a combinational effect in all three GBM xenografted lines used in this study in regards to: i) expression of DDR proteins; ii) changes in ROS, oxidative DNA damage; iii) DSBs accumulation; and iv) cell cycle progression/survival. Therefore we believe that our data are clinically relevant and worth the consideration for further clinical evaluation in patients suffering from GBM.
5. Conclusions
In summary, this study showed that combined administration of olaparib and SAHA resulted in more efficient elimination of aggressive GBM cells. Since both drugs are currently in clinical trials and have minimal toxicity to normal healthy tissue, we believe that the combinational treatment modality may represent an attractive approach to enhance the standard of care in patients with GBM.
Supporting information
The following are the supplementary data related to this article:
Supplementary Figure S1. In silico analysis of brain tumor datasets from GlioVis showing PARP1 (A) and HDAC1 (B) expression in GBM compared with normal brain tissue and low grade gliomas (WHO grade II) in comparison to high grade gliomas (WHO grade III and WHO grade IV).
Supplementary Figure S2. This figure provides supplementary information to Figure 5 and shows quantification of the percentage of GBM cells in individual cell cycle phases after SAHA, Olaparib or COMBO treatment.
Supplementary Figure S3. In silico analysis of brain tumor datasets from GlioVis showing the correlation of PARP1 and HDAC1 mRNA expression with 2 key DNA repair factors BRCA1 and Rad51. (A) Test for association/Pearson Correlation between paired samples for PARP1 and BRCA1 in GBM (p‐value = 0.00) and non‐tumor tissue control (p‐value = 0.85). (B) Test for association/Pearson Correlation between paired samples for PARP1 and Rad51 in GBM (p‐value = 0.00) and non‐tumor tissue control (p‐value = 0.62). (C) Test for association/Pearson Correlation between paired samples for HDAC1 and BRCA1 in GBM (p‐value = 0.00) and Non‐tumor tissue control (p‐value = 0.44). (D) Test for association/Pearson Correlation between paired samples for HDAC1 and Rad51 in GBM (p‐value = 0.00) and Non‐tumor tissue control (p‐value = 0.62).
Acknowledgments
This work was supported by the Danish Cancer Society Research Center and Dansk Kræftforsknings Fond (53236016). We would like to thank our postdoctoral fellow Marina Cihova for assistance with Traffic Light Reporter System, Dr. Monica Venere (Ohio State University, USA) for proofreading the manuscript and Ib Jarle Christensen (Copenhagen University Hospital, Denmark) with the statistical analysis of our data.
Supplementary data 1.
1.1.
Supplementary data related to this article can be found at http://dx.doi.org/10.1016/j.molonc.2015.12.014.
Rasmussen Rikke D., Gajjar Madhavsai K., Jensen Kamilla E., Hamerlik Petra, (2016), Enhanced efficacy of combined HDAC and PARP targeting in glioblastoma, Molecular Oncology, 10, doi: 10.1016/j.molonc.2015.12.014.
References
- Auffinger, B. , Spencer, D. , Pytel, P. , Ahmed, A.U. , Lesniak, M.S. , 2015. The role of glioma stem cells in chemotherapy resistance and glioblastoma multiforme recurrence. Expert Rev. Neurother. 15, 741–752. [DOI] [PMC free article] [PubMed] [Google Scholar]
- Bartkova, J. , Hamerlik, P. , Stockhausen, M.T. , Ehrmann, J. , Hlobilkova, A. , Laursen, H. , Kalita, O. , Kolar, Z. , Poulsen, H.S. , Broholm, H. , Lukas, J. , Bartek, J. , 2010. Replication stress and oxidative damage contribute to aberrant constitutive activation of DNA damage signalling in human gliomas. Oncogene. 29, 5095–5102. [DOI] [PubMed] [Google Scholar]
- Boyle, G.M. , Martyn, A.C. , Parsons, P.G. , 2005. Histone deacetylase inhibitors and malignant melanoma. Pigment Cell Res. 18, 160–166. [DOI] [PubMed] [Google Scholar]
- Certo, M.T. , Ryu, B.Y. , Annis, J.E. , Garibov, M. , Jarjour, J. , Rawlings, D.J. , Scharenberg, A.M. , 2011. Tracking genome engineering outcome at individual DNA breakpoints. Nat. Methods. 8, 671–676. [DOI] [PMC free article] [PubMed] [Google Scholar]
- Chamberlain, M.C. , 2011. Radiographic patterns of relapse in glioblastoma. J. Neurooncol. 101, 319–323. [DOI] [PubMed] [Google Scholar]
- Chen, J. , McKay, R.M. , Parada, L.F. , 2012. Malignant glioma: lessons from genomics, mouse models, and stem cells. Cell. 149, 36–47. [DOI] [PMC free article] [PubMed] [Google Scholar]
- Cornago, M. , Garcia-Alberich, C. , Blasco-Angulo, N. , Vall-Llaura, N. , Nager, M. , Herreros, J. , Comella, J.X. , Sanchis, D. , Llovera, M. , 2014. Histone deacetylase inhibitors promote glioma cell death by G2 checkpoint abrogation leading to mitotic catastrophe. Cell Death Dis. 5, e1435 [DOI] [PMC free article] [PubMed] [Google Scholar]
- Dungey, F.A. , Caldecott, K.W. , Chalmers, A.J. , 2009. Enhanced radiosensitization of human glioma cells by combining inhibition of poly(ADP-ribose) polymerase with inhibition of heat shock protein 90. Mol. Cancer Ther. 8, 2243–2254. [DOI] [PMC free article] [PubMed] [Google Scholar]
- Dungey, F.A. , Loser, D.A. , Chalmers, A.J. , 2008. Replication-dependent radiosensitization of human glioma cells by inhibition of poly(ADP-Ribose) polymerase: mechanisms and therapeutic potential. Int. J. Radiat. Oncol. Biol. Phys. 72, 1188–1197. [DOI] [PubMed] [Google Scholar]
- Eyupoglu, I.Y. , Hahnen, E. , Buslei, R. , Siebzehnrubl, F.A. , Savaskan, N.E. , Luders, M. , Trankle, C. , Wick, W. , Weller, M. , Fahlbusch, R. , Blumcke, I. , 2005. Suberoylanilide hydroxamic acid (SAHA) has potent anti-glioma properties in vitro, ex vivo and in vivo. J. Neurochem. 93, 992–999. [DOI] [PubMed] [Google Scholar]
- Galanis, E. , Jaeckle, K.A. , Maurer, M.J. , Reid, J.M. , Ames, M.M. , Hardwick, J.S. , Reilly, J.F. , Loboda, A. , Nebozhyn, M. , Fantin, V.R. , Richon, V.M. , Scheithauer, B. , Giannini, C. , Flynn, P.J. , Moore, D.F. , Zwiebel, J. , Buckner, J.C. , 2009. Phase II trial of vorinostat in recurrent glioblastoma multiforme: a north central cancer treatment group study. J. Clin. Oncol. 27, 2052–2058. [DOI] [PMC free article] [PubMed] [Google Scholar]
- Graff, J. , Rei, D. , Guan, J.S. , Wang, W.Y. , Seo, J. , Hennig, K.M. , Nieland, T.J. , Fass, D.M. , Kao, P.F. , Kahn, M. , Su, S.C. , Samiei, A. , Joseph, N. , Haggarty, S.J. , Delalle, I. , Tsai, L.H. , 2012. An epigenetic blockade of cognitive functions in the neurodegenerating brain. Nature. 483, 222–226. [DOI] [PMC free article] [PubMed] [Google Scholar]
- Groth, A. , Corpet, A. , Cook, A.J. , Roche, D. , Bartek, J. , Lukas, J. , Almouzni, G. , 2007. Regulation of replication fork progression through histone supply and demand. Science. 318, 1928–1931. [DOI] [PubMed] [Google Scholar]
- Ha, K. , Fiskus, W. , Choi, D.S. , Bhaskara, S. , Cerchietti, L. , Devaraj, S.G. , Shah, B. , Sharma, S. , Chang, J.C. , Melnick, A.M. , Hiebert, S. , Bhalla, K.N. , 2014. Histone deacetylase inhibitor treatment induces ‘BRCAness’ and synergistic lethality with PARP inhibitor and cisplatin against human triple negative breast cancer cells. Oncotarget. 5, 5637–5650. [DOI] [PMC free article] [PubMed] [Google Scholar]
- Hanson, J.E. , La, H. , Plise, E. , Chen, Y.H. , Ding, X. , Hanania, T. , Sabath, E.V. , Alexandrov, V. , Brunner, D. , Leahy, E. , Steiner, P. , Liu, L. , Scearce-Levie, K. , Zhou, Q. , 2013. SAHA enhances synaptic function and plasticity in vitro but has limited brain availability in vivo and does not impact cognition. PLoS One. 8, e69964 [DOI] [PMC free article] [PubMed] [Google Scholar]
- Hockly, E. , Richon, V.M. , Woodman, B. , Smith, D.L. , Zhou, X. , Rosa, E. , Sathasivam, K. , Ghazi-Noori, S. , Mahal, A. , Lowden, P.A. , Steffan, J.S. , Marsh, J.L. , Thompson, L.M. , Lewis, C.M. , Marks, P.A. , Bates, G.P. , 2003. Suberoylanilide hydroxamic acid, a histone deacetylase inhibitor, ameliorates motor deficits in a mouse model of Huntington's disease. Proc. Natl. Acad. Sci. U.S.A. 100, 2041–2046. [DOI] [PMC free article] [PubMed] [Google Scholar]
- Huse, J.T. , Phillips, H.S. , Brennan, C.W. , 2011. Molecular subclassification of diffuse gliomas: seeing order in the chaos. Glia. 59, 1190–1199. [DOI] [PubMed] [Google Scholar]
- Jain, S. , Zain, J. , O'Connor, O. , 2012. Novel therapeutic agents for cutaneous T-cell lymphoma. J. Hematol. Oncol. 5, 24 [DOI] [PMC free article] [PubMed] [Google Scholar]
- Kachhap, S.K. , Rosmus, N. , Collis, S.J. , Kortenhorst, M.S. , Wissing, M.D. , Hedayati, M. , Shabbeer, S. , Mendonca, J. , Deangelis, J. , Marchionni, L. , Lin, J. , Hoti, N. , Nortier, J.W. , DeWeese, T.L. , Hammers, H. , Carducci, M.A. , 2010. Downregulation of homologous recombination DNA repair genes by HDAC inhibition in prostate cancer is mediated through the E2F1 transcription factor. PLoS One. 5, e11208 [DOI] [PMC free article] [PubMed] [Google Scholar]
- Komatsu, N. , Kawamata, N. , Takeuchi, S. , Yin, D. , Chien, W. , Miller, C.W. , Koeffler, H.P. , 2006. SAHA, a HDAC inhibitor, has profound anti-growth activity against non-small cell lung cancer cells. Oncol. Rep. 15, 187–191. [PubMed] [Google Scholar]
- Konstantinopoulos, P.A. , Wilson, A.J. , Saskowski, J. , Wass, E. , Khabele, D. , 2014. Suberoylanilide hydroxamic acid (SAHA) enhances olaparib activity by targeting homologous recombination DNA repair in ovarian cancer. Gynecol. Oncol. 133, 599–606. [DOI] [PMC free article] [PubMed] [Google Scholar]
- Krajewska, M. , Fehrmann, R.S. , Schoonen, P.M. , Labib, S. , de Vries, E.G. , Franke, L. , van Vugt, M.A. , 2015. ATR inhibition preferentially targets homologous recombination-deficient tumor cells. Oncogene. 34, 3474–3481. [DOI] [PubMed] [Google Scholar]
- Lord, C.J. , Tutt, A.N. , Ashworth, A. , 2015. Synthetic lethality and cancer therapy: lessons learned from the development of PARP inhibitors. Annu. Rev. Med. 66, 455–470. [DOI] [PubMed] [Google Scholar]
- Lucio-Eterovic, A.K. , Cortez, M.A. , Valera, E.T. , Motta, F.J. , Queiroz, R.G. , Machado, H.R. , Carlotti, C.G. , Neder, L. , Scrideli, C.A. , Tone, L.G. , 2008. Differential expression of 12 histone deacetylase (HDAC) genes in astrocytomas and normal brain tissue: class II and IV are hypoexpressed in glioblastomas. BMC Cancer. 8, 243 [DOI] [PMC free article] [PubMed] [Google Scholar]
- Mendes-Pereira, A.M. , Martin, S.A. , Brough, R. , McCarthy, A. , Taylor, J.R. , Kim, J.S. , Waldman, T. , Lord, C.J. , Ashworth, A. , 2009. Synthetic lethal targeting of PTEN mutant cells with PARP inhibitors. EMBO Mol. Med. 1, 315–322. [DOI] [PMC free article] [PubMed] [Google Scholar]
- Min, A. , Im, S.A. , Kim, D.K. , Song, S.H. , Kim, H.J. , Lee, K.H. , Kim, T.Y. , Han, S.W. , Oh, D.Y. , Kim, T.Y. , O'Connor, M.J. , Bang, Y.J. , 2015. Histone deacetylase inhibitor, suberoylanilide hydroxamic acid (SAHA), enhances anti-tumor effects of the poly (ADP-ribose) polymerase (PARP) inhibitor olaparib in triple-negative breast cancer cells. Breast Cancer Res. 17, 33 [DOI] [PMC free article] [PubMed] [Google Scholar]
- Olive, P.L. , Wlodek, D. , Durand, R.E. , Banath, J.P. , 1992. Factors influencing DNA migration from individual cells subjected to gel electrophoresis. Exp. Cell Res. 198, 259–267. [DOI] [PubMed] [Google Scholar]
- Park, J.H. , Kim, S.H. , Choi, M.C. , Lee, J. , Oh, D.Y. , Im, S.A. , Bang, Y.J. , Kim, T.Y. , 2008. Class II histone deacetylases play pivotal roles in heat shock protein 90-mediated proteasomal degradation of vascular endothelial growth factor receptors. Biochem. Biophys. Res. Commun. 368, 318–322. [DOI] [PubMed] [Google Scholar]
- Petruccelli, L.A. , Dupere-Richer, D. , Pettersson, F. , Retrouvey, H. , Skoulikas, S. , Miller, W.H. , 2011. Vorinostat induces reactive oxygen species and DNA damage in acute myeloid leukemia cells. PLoS One. 6, e20987 [DOI] [PMC free article] [PubMed] [Google Scholar]
- Rasheed, W.K. , Johnstone, R.W. , Prince, H.M. , 2007. Histone deacetylase inhibitors in cancer therapy. Expert Opin. Investig. Drugs. 16, 659–678. [DOI] [PubMed] [Google Scholar]
- Rigakos, G. , Razis, E. , 2012. BRCAness: finding the Achilles heel in ovarian cancer. Oncologist. 17, 956–962. [DOI] [PMC free article] [PubMed] [Google Scholar]
- Rivera, M. , Wu, Q. , Hamerlik, P. , Hjelmeland, A.B. , Bao, S. , Rich, J.N. , 2015. Acquisition of meiotic DNA repair regulators maintain genome stability in glioblastoma. Cell Death Dis. 6, e1732 [DOI] [PMC free article] [PubMed] [Google Scholar]
- Singh, M.M. , Johnson, B. , Venkatarayan, A. , Flores, E.R. , Zhang, J. , Su, X. , Barton, M. , Lang, F. , Chandra, J. , 2015. Preclinical activity of combined HDAC and KDM1A inhibition in glioblastoma. Neuro Oncol. 17, 1463–1473. [DOI] [PMC free article] [PubMed] [Google Scholar]
- Singh, M.M. , Manton, C.A. , Bhat, K.P. , Tsai, W.W. , Aldape, K. , Barton, M.C. , Chandra, J. , 2011. Inhibition of LSD1 sensitizes glioblastoma cells to histone deacetylase inhibitors. Neuro Oncol. 13, 894–903. [DOI] [PMC free article] [PubMed] [Google Scholar]
- Singh, N.P. , McCoy, M.T. , Tice, R.R. , Schneider, E.L. , 1988. A simple technique for quantitation of low levels of DNA damage in individual cells. Exp. Cell Res. 175, 184–191. [DOI] [PubMed] [Google Scholar]
- Squatrito, M. , Brennan, C.W. , Helmy, K. , Huse, J.T. , Petrini, J.H. , Holland, E.C. , 2010. Loss of ATM/Chk2/p53 pathway components accelerates tumor development and contributes to radiation resistance in gliomas. Cancer Cell. 18, 619–629. [DOI] [PMC free article] [PubMed] [Google Scholar]
- Stupp, R. , Mason, W.P. , van den Bent, M.J. , Weller, M. , Fisher, B. , Taphoorn, M.J. , Belanger, K. , Brandes, A.A. , Marosi, C. , Bogdahn, U. , Curschmann, J. , Janzer, R.C. , Ludwin, S.K. , Gorlia, T. , Allgeier, A. , Lacombe, D. , Cairncross, J.G. , Eisenhauer, E. , Mirimanoff, R.O. , 2005. Radiotherapy plus concomitant and adjuvant temozolomide for glioblastoma. N. Engl. J. Med. 352, 987–996. [DOI] [PubMed] [Google Scholar]
- Tanaka, S. , Louis, D.N. , Curry, W.T. , Batchelor, T.T. , Dietrich, J. , 2013. Diagnostic and therapeutic avenues for glioblastoma: no longer a dead end?. Nat. Rev. Clin. Oncol. 10, 14–26. [DOI] [PubMed] [Google Scholar]
- Tu, W.Z. , Li, B. , Huang, B. , Wang, Y. , Liu, X.D. , Guan, H. , Zhang, S.M. , Tang, Y. , Rang, W.Q. , Zhou, P.K. , 2013. gammaH2AX foci formation in the absence of DNA damage: mitotic H2AX phosphorylation is mediated by the DNA-PKcs/CHK2 pathway. FEBS Lett. 587, 3437–3443. [DOI] [PubMed] [Google Scholar]
- Turner, N. , Tutt, A. , Ashworth, A. , 2004. Hallmarks of ‘BRCAness’ in sporadic cancers. Nat. Rev. Cancer. 4, 814–819. [DOI] [PubMed] [Google Scholar]
- Venere, M. , Hamerlik, P. , Wu, Q. , Rasmussen, R.D. , Song, L.A. , Vasanji, A. , Tenley, N. , Flavahan, W.A. , Hjelmeland, A.B. , Bartek, J. , Rich, J.N. , 2014. Therapeutic targeting of constitutive PARP activation compromises stem cell phenotype and survival of glioblastoma-initiating cells. Cell Death Differ. 21, 258–269. [DOI] [PMC free article] [PubMed] [Google Scholar]
- Wu, J. , Lu, L.Y. , Yu, X. , 2010. The role of BRCA1 in DNA damage response. Protein Cell. 1, 117–123. [DOI] [PMC free article] [PubMed] [Google Scholar]
- Xu, J. , Sampath, D. , Lang, F.F. , Prabhu, S. , Rao, G. , Fuller, G.N. , Liu, Y. , Puduvalli, V.K. , 2011. Vorinostat modulates cell cycle regulatory proteins in glioma cells and human glioma slice cultures. J. Neurooncol. 105, 241–251. [DOI] [PMC free article] [PubMed] [Google Scholar]
- Yin, D. , Ong, J.M. , Hu, J. , Desmond, J.C. , Kawamata, N. , Konda, B.M. , Black, K.L. , Koeffler, H.P. , 2007. Suberoylanilide hydroxamic acid, a histone deacetylase inhibitor: effects on gene expression and growth of glioma cells in vitro and in vivo. Clin. Cancer Res. 13, 1045–1052. [DOI] [PubMed] [Google Scholar]
Associated Data
This section collects any data citations, data availability statements, or supplementary materials included in this article.
Supplementary Materials
The following are the supplementary data related to this article:
Supplementary Figure S1. In silico analysis of brain tumor datasets from GlioVis showing PARP1 (A) and HDAC1 (B) expression in GBM compared with normal brain tissue and low grade gliomas (WHO grade II) in comparison to high grade gliomas (WHO grade III and WHO grade IV).
Supplementary Figure S2. This figure provides supplementary information to Figure 5 and shows quantification of the percentage of GBM cells in individual cell cycle phases after SAHA, Olaparib or COMBO treatment.
Supplementary Figure S3. In silico analysis of brain tumor datasets from GlioVis showing the correlation of PARP1 and HDAC1 mRNA expression with 2 key DNA repair factors BRCA1 and Rad51. (A) Test for association/Pearson Correlation between paired samples for PARP1 and BRCA1 in GBM (p‐value = 0.00) and non‐tumor tissue control (p‐value = 0.85). (B) Test for association/Pearson Correlation between paired samples for PARP1 and Rad51 in GBM (p‐value = 0.00) and non‐tumor tissue control (p‐value = 0.62). (C) Test for association/Pearson Correlation between paired samples for HDAC1 and BRCA1 in GBM (p‐value = 0.00) and Non‐tumor tissue control (p‐value = 0.44). (D) Test for association/Pearson Correlation between paired samples for HDAC1 and Rad51 in GBM (p‐value = 0.00) and Non‐tumor tissue control (p‐value = 0.62).