

Abstract
The targeted therapy for triple‐negative breast cancer (TNBC) is a great challenge due to our poor understanding on its molecular etiology. In the present study, our clinical data showed that the expression of G‐protein coupled estrogen receptor (GPER) is negatively associated with lymph node metastasis, high‐grade tumor and fibronectin (FN) expression while positively associated with the favorable outcome in 135 TNBC patients. In our experimental studies, both the in vitro migration and invasion of TNBC cells were inhibited by GPER specific agonist G‐1, through the suppression of the epithelial mesenchymal transition (EMT). The G‐1 treatment also reduced the phosphorylation, nuclear localization, and transcriptional activities of NF‐κB. While over expression of NF‐κB attenuated the action of G‐1 in suppressing EMT. Our data further illustrated that the phosphorylation of GSK‐3β by PI3K/Akt and ERK1/2 mediated, at least partially, the inhibitory effect of G‐1 on NF‐κB activities. It was further confirmed in a study of MDA‐MB‐231 tumor xenografts in nude mice. The data showed that G‐1 inhibited the in vivo growth and invasive potential of TNBC via suppression of EMT. Our present study demonstrated that an activation of GPER pathway elicits tumor suppressive actions on TNBC, and supports the use of G‐1 therapeutics for TNBC metastasis.
Keywords: GPER, G‐1, EMT, TNBC, NF‐κB
Highlights
GPER is negatively correlated with the progression of TNBC.
G‐1 inhibits the in vitro motility of TNBC cells via suppression of EMT.
The inhibition of NF‐κB mediates G‐1 induced EMT suppression.
GSK‐3β is involved in G‐1 suppressed NF‐κB activities.
PI3K/Akt and ERK1/2 are involved in G‐1 induced phosphorylation of GSK‐3β.
1. Introduction
Breast cancer is one of the most diagnosed cancers and the leading causes of cancer death in females worldwide (Desantis et al., 2014). Triple‐negative breast cancer (TNBC), which is characterized by testing negative for the estrogen receptor (ER), progesterone receptor (PGR) and human epidermal growth factor receptor 2 (HER‐2), accounts for 15–20% of all breast cancers (Kirkpatrick, 2009). Since the lack of common therapeutic targets, TNBC patients are neither susceptible to endocrine therapy nor to targeted therapeutics used for HER2‐positive (Trastuzumab and Lapatinib) or ERα‐positive (Tamoxifen and aromatase inhibitors) breast cancers (Kirkpatrick, 2009). Moreover, TNBC patients are commonly associated with increased risks for metastasis and high rates of recurrence with the worst overall survival rates among all subtypes of breast cancer (Gilbert, 2012). The rate of death of TNBC patients within 5 years of diagnosis is two‐fold of ER‐α‐positive tumors (Kirkpatrick, 2009). Currently there is no FDA (Food and Drug Administration)‐approved targeted therapy for TNBC patients. Therefore, there is an urgent need to reveal the underlying molecular mechanisms responsible for the aggressive nature of TNBC, and to develop targeted approaches for TNBC treatment.
G‐protein coupled estrogen receptor (GPER), a member of G‐protein coupled receptor (GPCR), has been recently shown to mediate rapid nongenomic actions of estrogen (Lappano and Maggiolini, 2011). The activation of GPER can regulate the activities of adenylyl cyclase, epidermal growth factor receptors (EGFRs), mitogen‐activated protein kinase (MAPK) and phosphoinositide 3‐kinase (PI3K) signaling pathways (Ge et al., 2012; Luo et al., 2012), and modulate the progression of various hormone‐responsive tumors such as endometrial (Filigheddu et al., 2011), ovarian (Wang et al., 2013), and breast (Ariazi et al., 2010) cancers. Intriguingly, GPER was found to be greatly expressed in TNBC cell‐lines and patient tissue samples (Steiman et al., 2013; Yu et al., 2014), particularly for premenopausal women (Filardo et al., 2006; Steiman et al., 2013). Therefore it is worthy to investigate if the modulation of GPER‐signaling might affect the development and metastasis of TNBC.
Epithelial–mesenchymal transition (EMT) is a process by which epithelial cells lose their cell polarity and gain migratory and invasive mesenchymal phenotype (Thiery et al., 2009). The progression of EMTs can be regulated by several important transcription factors such as Snail, Slug, Twist and Zeb (Thiery et al., 2009), followed by the convergence of the multiple signaling pathways such as MAPK, PI3K, and NF‐κB (Craene and Berx, 2013; Tiwari et al., 2012). Increasing evidences show that in TNBC, the most lethal and aggressive subtype of breast cancer, malignant cells undergo an EMT to become motile (Mostert et al., 2009). It is evident that invasion of TNBC occurs through the “crosstalk” or cross‐signaling pathways between growth factor receptors particularly IGF‐1receptor (IGF‐1R) and c‐Met via EMT initiation (Al Moustafa, 2013). Therefore, the process of EMT and its regulators are major targets for TNBC therapy.
Recent studies have reported that the activation of GPER via non‐specific agonists such as 17β‐estradiol and fulvestrant can trigger the migration and invasion of cancer cells (Li et al., 2014; Yan et al., 2013). However, inconsistent observations on the activation of GPER pathways by agonists with different specificities on the progression of cancer development were reported (Lappano et al., 2014; Wei et al., 2014). There is a pressing need to investigate the activating effect of specific GPER agonist on the motility of TNBC. In the present study, we reported that the activation of GPER by G‐1 significantly inhibited the migration and invasion of TNBC both in vitro and in vivo and reversed the process of EMT. Furthermore, the down regulation of NF‐κB through the phosphorylation of GSK‐3β by ERK1/2 and PI3K/Akt was involved in G‐1 elicited EMT suppression. Our findings suggested that activation of GPER signaling might represent a novel therapeutic for TNBC metastasis.
2. Materials and methods
2.1. Patients and tissue samples
The study included a group of 135 clinical–pathological characterized patients between 2007 and 2014 with histologically confirmed TNBC from the Affiliated Cancer Hospital at Guangzhou Medical University and the Cancer Center of Sun Yat‐sen University. For all of the patients who participated in this study, written consent forms approved by the Ethical Committee of Sun Yat‐sen University according to the Chinese Ethical Regulations were signed and documented. All tissue samples were dissected and collected by an experienced pathologist. The samples were then stored at −80 °C until further analysis. The expressions of GPER and fibronectin (FN) were examined by immunohistochemistry (IHC). Clinical data were reviewed retrospectively from medical records.
2.2. Reagents
PD 98059 (PD, ERK1/2 kinase inhibitor), AG 1478 (AG, EGFR inhibitor), SB203580 (SB, p38‐MAPK inhibitor), LY294002 (LY, PI3K/Akt inhibitor), H89 (PKA inhibitor), GF109203X (GF, PKC inhibitor), BAY11‐7028 (BAY, NF‐κB inhibitor), and LiCl (GSK‐3β inhibitor) were purchased from Selleck Chemicals (Houston, TX, USA). G‐1 (GPER agonist), G15 (GPER antagonist) and other chemicals at reagent or molecular grade were obtained from Sigma Chemical Co. (St. Louis, MO, USA) unless otherwise noted. The purified rabbit antibody against GPER (SP4677P) for IHC was purchased from Acris antibodies (Herford, Germany). Monoclonal antibodies against FN, E‐Cadherin (E‐Cad), vimentin (Vim), Snail, Slug, Twist, Zeb, Histone H2A, p‐p65 (Ser536), p65, p‐GSK‐3β (Ser9), GSK‐3β, p‐PKC (Ser660), PKC, ERK1/2, p‐ERK1/2 (Thr202/Tyr204), p‐JNK (Thr‐183/Tyr‐185), JNK, p‐p38 MAPK (Thr180/Tyr182), p38‐MAPK, p‐PKA (Ser96), PKA, and GAPDH were from Cell Signaling Technology Inc (Beverly, MA, USA). Antibodies against p‐Akt (Ser473) and Akt were purchased from Bioworld Technology Inc (Minneapolis, MN, USA). Horseradish peroxidase‐conjugated secondary antibody was from Santa Cruz Biotechnology (Santa Cruz, CA, USA). All compounds were dissolved in DMSO. Medium containing 0.5% DMSO was used as the control.
2.3. Cell culture and transfection
The cancer cell‐lines MCF‐7, T47D, HS578T, MDA‐MB‐231, BT‐549, and OVACR5 were acquired from the American Type Culture Collection (Manassas, VA, USA), and cultured in RPMI 1640 or DMEM medium (Invitrogen Corporation, Carlsbad, CA, USA) supplemented with 10% heat‐inactivated fetal bovine serum, 100 U/ml penicillin, and 10 μg/ml streptomycin at 37 °C in a 5% CO2 atmosphere. An ABI 3130 Genetic Analyzer (Applied Biosystems) was used for the profiling. The DNA profile data were cross‐checked with the ATCC data bank. Twenty‐four hours before experiments, the culture medium was replaced with phenol red‐free medium to remove the estrogen‐like activity of phenol red. For transfection studies, cells were seeded into plates and transfected using Lipofectamine 2000 reagent (Invitrogen) with pcDNA3.1 (vector control), pcDNA3.1/p65 (a gift from Dr Jun Cui, Sun Yat‐sen University), siRNA negative control (si‐NC), or si‐GSK‐3β.
2.4. In vitro wound‐healing and transwell invasion assay
A wound‐healing assay was used to compare the migratory ability of MDA‐MB‐231 and BT‐549 cells as previously described (Chen et al., 2015). The cell invasion assay was conducted using 6‐well transwell plates (Falcon cell culture inserts, 8‐μm pore size, BD, NJ) according to our previous study (Jiang et al., 2013a) and described in detail in the Supplementary Data.
2.5. Western blot analysis
Western blotting was performed as previously described (Ge et al., 2014).
2.6. Nuclear/cytosol fractionations
Nuclear and cytosolic fractions from cells were obtained by using a nuclear/cytosol fractionation kit (BioVision), and Western blot analysis was performed to check the purity of the isolated fractions.
2.7. Quantitative real‐time PCR
Total RNA was extracted with TRIZOL reagent. First strand cDNA synthesis was performed in a reaction mix containing 2 μg of total RNA, oligo‐dT primer and Superscript II Reverse Transcriptase (GIBCO BRL, Grand Island, NY, USA). Quantitative Real‐Time PCR (qRT‐PCR) was implemented with an iCycler (Bio‐Rad, Hercules, USA) using validated primers and SYBR Premix Ex Taq II (Takara, Japan). The cycle number at threshold (Ct) was used to quantify the transcript levels of genes of interest. Transcripts of the housekeeping gene GAPDH in the same incubations were used for normalization. Primer pairs were as follows: FN, forward 5′‐CCC AGA CTT ATG GTG GCA ATT C‐3′ and reverse 5′‐AAT TTC CGC CTC GAG TCT GA‐3′; CDH1 (gene of E‐Cad), forward 5′‐CGTCCTGCCAATCCTGATGA‐3′ and reverse 5′‐ACCACTGCCCTCGTAATCGAAC‐3′; Snail, forward 5′‐GAC CAC TAT GCC GCG CTC TT‐3′ and reverse 5′‐TCG CTG TAG TTA GGC TTC CGA TT‐3′; Slug, forward 5′‐TTC GGA CCC ACA CAT TAC CT‐3′ and reverse 5′‐GCA GTG AGG GCA AGA AAA AG‐3′; GAPDH, forward 5′‐GCA CCG TCA AGG CTG AGA AC‐3′ and reverse 5′‐TGG TGA AGA CGC CAG TGG A‐3′.
2.8. Immunofluorescence
Immunofluorescent staining was carried out as described previously (Wei et al., 2014) and described in detail in the Supplementary Data.
2.9. Luciferase reporter assay
Luciferase activity was measured using the Dual Luciferase Reporter Assay kit (Promega) according to the manufacturer's instructions. In brief, cells at approximately 70% confluence were transfected with 0.2 μg DNA/cm2 of pNF‐κB‐luc plasmid. Six hours after the transfection, the cells were cultured in a medium containing 10% FBS overnight, and then exposed to G‐1 for designated time. Then cells were lysed and luciferase activity was measured using a dual‐luciferase assay kit (Promega). pRL‐TK was co‐transfected as a control. Firefly luciferase activities were divided by Renilla activities to normalize for the transfection efficiency. Experiments were performed three times with similar results obtained.
2.10. Animal experiments
Nude mice were purchased from the Sun Yat‐sen University (Guangzhou, China) Animal Center and raised under pathogen‐free conditions. All animal experiments complied with the Zhongshan School of Medicine Policy on the Care and Use of Laboratory Animals. MDA‐MB‐231 cells (2 × 10⁶ per mouse) were injected subcutaneously into the fourth right mammary fat pad at the base of the nipple of nude mice with 50% Matrigel (BD bioscience, Bedford, MA). When the tumor was visible, the mice of G‐1 group were treated with G‐1 (4 mg per kg, body weight) by tail vein injection for every three days (four times together). The control group was treated with an equal volume of vehicle (PBS). Tumor growth and body weight were monitored every two days. The tumor volume was calculated using the formula V = 1/2 × larger diameter × (smaller diameter)2. When the tumor volume at the control group reached approximate 1000 mm3, the animals were sacrificed. Tumors were removed and weighed for histology and Western blot analysis. Tumor burden in lung tissues was quantified by manually counting the numbers of nodules visible on the lung surface. Tumors and lungs were embedded in paraffin for further study.
2.11. Tumor histology and immunohistochemistry
Immunohistochemical staining of formalin‐fixed paraffin‐embedded tissues was conducted as previously described (Liu et al., 2012). Briefly, tumor tissues (both mice and human) and lungs (mice) were fixed in formalin and embedded in paraffin. Sections (5 μm) were cut, deparaffinized, hydrated and stained with hematoxylin and eosin H&E (Sigma). For IHC staining, sections were treated with 3% H2O2 in water for 10 min to block endogenous peroxidase activities. Antigen retrieval procedure was done with 10 mM citrate buffer (pH6.0) for 10 min. Tissue sections were incubated with the Biocare blocking reagent for 10 min to minimize non‐specific binding, followed by an overnight incubation at 4 °C with anti‐GPER or FN. Slides were then washed in PBS twice and incubated with goat anti‐rabbit horseradish peroxidase‐conjugated secondary antibodies for 30 min at room temperature. Finally, slides were washed and incubated with 3,3′‐diami‐nobenzidine and counter stained with hematoxylin. The slides were analyzed separately by two pathologists without knowing the patients' clinical information. The staining intensity was scored on a scale of 0–3 as negative (0), weak (1), medium (2) or strong (3). The extent of the staining, defined as the percentage of positive stained areas of tumor cells per the whole tumor area, was scored on a scale of 0 (0%), 1 (1–25%), 2 (26–50%), 3 (51–75%) and 4 (76–100%). An overall protein expression score (overall score range, 0–12) was calculated by multiplying the intensity and positivity scores according to the previous study (Yao et al., 2015). For statistical purposes the staining score was further categorized as negative (0–2), low (3–5), medium (6–8), and high (9–12).
2.12. Statistical analyses
All values were reported as mean ± SD from three independent experiments unless otherwise specified. Data were analyzed by two‐tailed unpaired Student's t‐test between two groups and by One‐Way ANOVA followed by Bonferroni test for multiple comparison. Clinical correlations were analyzed by Pearson chi‐square test. The survival curves were plotted by using Kaplan–Meier analysis. Statistical analysis was carried out using SPSS 16.0 for Windows. A p‐value of <0.05 was considered to be statistically significant.
3. Results
3.1. The expression and roles of GPER in TNBC patients
Since the association of GPER signaling and clinical prognosis of cancer patients are still elusive, we analyzed the expression of GPER in a set of 135 TNBC tumors by IHC in the present study. Representative GPER immunostaining of TNBC samples was shown in Figure 1A. Table 1 showed that the expression level of GPER is significantly (p < 0.01) negatively associated with high‐grade tumors and lymph node metastasis. Kaplan–Meier analysis of all 135 patients demonstrated a significant (p < 0.05) and positive correlation between GPER levels and overall survival (OS). Moreover, statistical comparisons of survival between groups with the log‐rank statistical test suggested that patients whose tumors expressing less GPER showed poorer survival rate as compared with those with greater levels of GPER (p < 0.01) (Figure 1B). Our results showed that greater expression level of GPER is associated with a favorable prognosis in TNBC patients.
Figure 1.
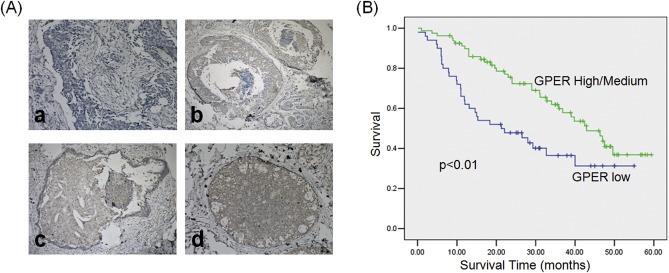
The roles of GPER in TNBC clinical samples. (A) Immunohistochemical analysis of GPER in TNBC samples. The carcinomas showed four distinct patterns of expression: no expression (a), low expression (b), medium expression (c), and high expression (d); (B) Kaplan–Meier analysis of cancer specific survival for all patients.
Table 1.
GPER expression in clinical and pathological characteristics of 135 TNBC patients.
| Characteristics | N | GPER low/no | GPER high/medium | p value |
|---|---|---|---|---|
| Age | ||||
| ≤50 | 63 | 27 | 36 | 0.526 |
| >50 | 72 | 27 | 45 | |
| Stage | ||||
| I/II | 84 | 31 | 53 | 0.346 |
| III/IV | 51 | 23 | 28 | |
| Grade | ||||
| I/II | 54 | 12 | 42 | <0.001 |
| III | 81 | 42 | 39 | |
| Node metastasis | ||||
| Negative (<10) | 81 | 24 | 57 | 0.003 |
| Positive (≥10) | 54 | 30 | 24 | |
3.2. Activation of GPER inhibits in vitro motility of TNBC cells
Clinical data revealed that expression level of GPER is negatively associated with high‐grade tumors and lymph node metastasis. We then investigated the roles of GPER in the motility of TNBC cells. As shown in Figure 2A, GPER was highly expressed in the ERα+ breast cancer cell‐lines T47D and MCF‐7 as well as the TNBC cells BT‐549, MDA‐MB‐231, and Hs578T, although the expression was less than that in the positive control OVCAR5 cells (Yan et al., 2013). Then MDA‐MB‐231 and BT‐549 cells were used for subsequent experimental studies of GPER functions. In the experiments, the dose of 1 μM G‐1 was used to investigate the activation of GPER in cancer cells according to the previous studies (Madeo and Maggiolini, 2010; Pandey et al., 2009; Wei et al., 2014). The treatment with 1 μM G‐1 for 24 or 48 h noticeably inhibited wound closure of both MDA‐MB‐231 (Figure 2B) and BT‐549 cells (Figure 2C) as compared with the control group. Boyden chambers were used to confirm the inhibitory function of G‐1 on the in vitro invasion of TNBC cells. As shown in Figure 2D, the number of invaded MDA‐MB‐231 and BT‐549 cells treated with 1 μM G‐1 for 24 h was significantly (p < 0.05) lesser than that of the control cells. This was further confirmed by the use of 100 nM G‐1 in which the treatment inhibited both wound closure and invasion in both MDA‐MB‐231 and BT‐549 cells (Figure S1). G15, the specific antagonist of GPER, had no significant (p > 0.05) effect on the motility of MDA‐MB‐231 cells (Figure S2). The silencing of GPER by siRNA significantly attenuated the inhibitory effects of G‐1 on the wound closure and the invasion of MDA‐MB‐231 cells (Figure 2E and F). These data suggested that G‐1 inhibits the motility of TNBC cells in vitro through the activation of GPER.
Figure 2.
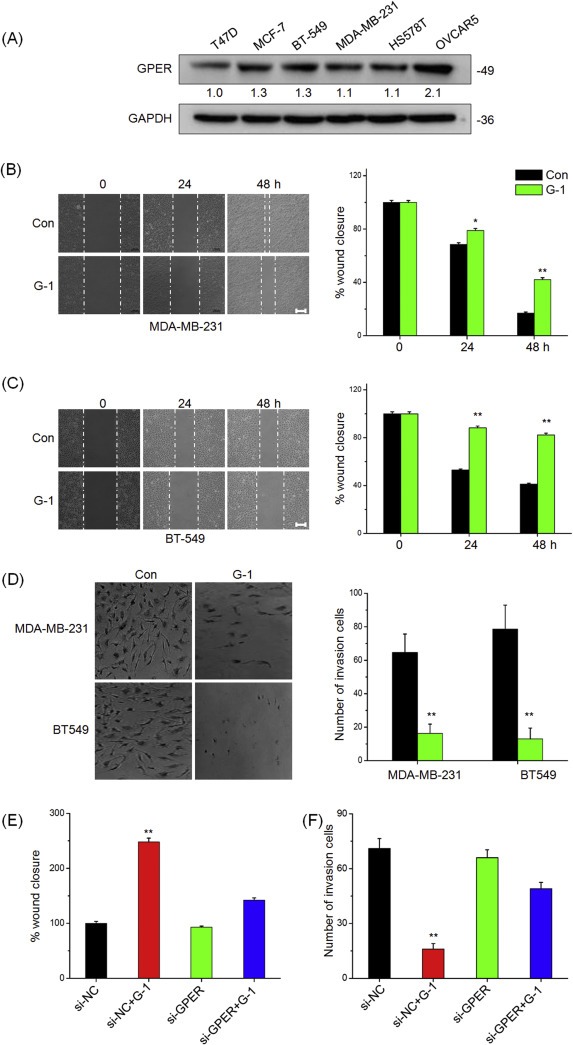
Activation of GPER inhibits in vitro migration and invasion of TNBC cells. (A) The expression of GPER in human cancer cells were measured by Western blot analysis; Confluent monolayers of MDA‐MB‐231 (B) or BT‐549 (C) cells were scraped by a pipette tip to generate wounds and then were treated with or without 1 μM G‐1 for 0, 24, and 48 h, respectively; quantitative analysis of wound healing assay was showed in the right column; (D) MDA‐MB‐231 and BT‐549 cells were allowed to invasive transwell chambers for 48 h in the presence or absence of 1 μM G‐1. Then invaded cells were fixed, stained, and photographed; (E) MDA‐MB‐231 were transfected with si‐NC or si‐GPER for 24 h, scraped by a pipette tip to generate wounds, and then treated with or without 1 μM G‐1 for 48 h; (F) MDA‐MB‐231 cells were transfected with si‐NC or si‐GPER for 24 h and then allowed to invasive transwell chambers for 48 h in the presence or absence of 1 μM G‐1. Data represented the average of three independent experiments. *p < 0.05 compared with control, **p < 0.01 compared with control. Scale bar = 100 μm.
3.3. Activation of GPER suppresses EMT of TNBC cells
EMT is an important process that leads to metastasis of breast cancer, especially in the most aggressive and lethal subtype of TNBC (Al Moustafa, 2013). To assess the functional role of GPER in EMT, we determined the effects of G‐1 on cell behaviors. Figure 3A showed that MDA‐MB‐231 cells treated with G‐1 lost their spindle‐like fibroblast phenotype but assumed a cobblestone‐like epithelial morphology. These morphological changes were supported by Western blot analysis, which showed an increase of epithelial cell marker E‐cad expression and a decrease of mesenchymal cell marker FN expression in the G‐1 treated MDA‐MB‐231 (Figure 3B) and BT‐549 (Figure S3) cells. Similarly, immunofluorescence analysis showed that G‐1 treatment down regulated mesenchymal characteristic in FN expression but unregulated epithelial maker E‐Cad expression (Figure 3D). Furthermore, qRT‐PCR analysis showed that G‐1 treatment down regulated FN transcript levels in both MDA‐MB‐231 (Figure 3C) and BT‐549 (Figure S4) cells in a time‐dependent manner. No significant change in the mRNA expression levels of E‐Cad was noted. G‐1 treatment also significantly suppressed the in vitro motility and EMT progression of Hs548T cells (Figure S5). Collectively, these observations showed a critical role of GPER activation in the EMT and metastatic potential of the TNBC cells.
Figure 3.
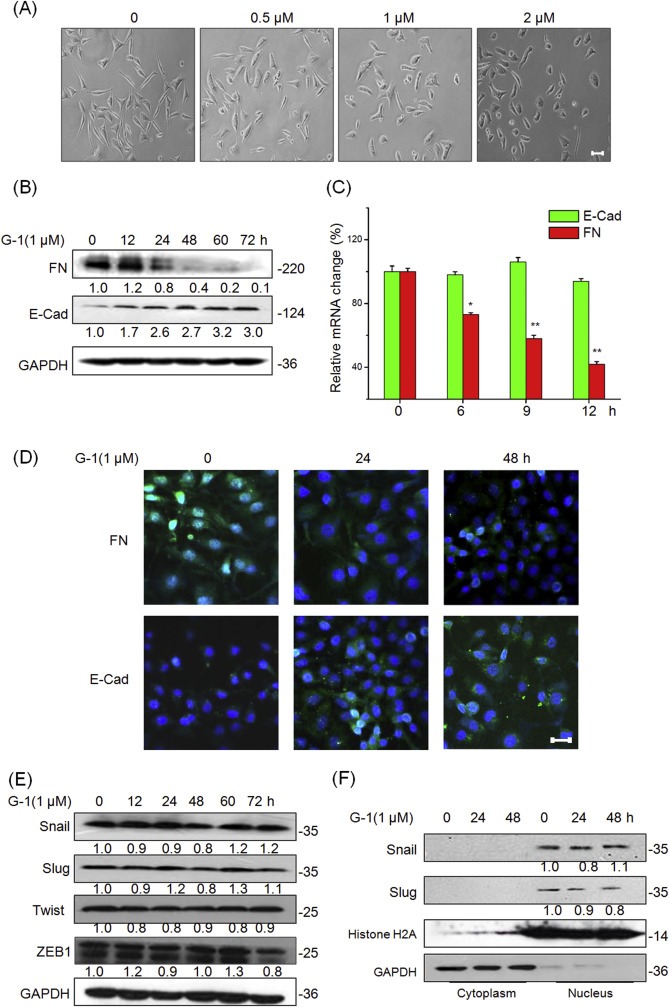
Activation of GPR30 suppresses EMT of TNBC cells while has no effect on the related transcription factors. (A) MDA‐MB‐231 cells were treated with various concentrations of G‐1 for 48 h, and then the cell morphological changes were recorded by a phase contrast microscope. MDA‐MB‐231 cells were treated with 1 μM G‐1 for the indicated times. Then the expression of epithelial maker E‐cad and mesenchymal marker FN were detected by Western blot analysis (B) or qRT‐PCR (C), respectively. (D) MDA‐MB‐231 cells were treated with 1 μM G‐1 for 24 or 48 h, then expression of FN and E‐Cad (green) was analyzed by immunofluorescence staining. Nuclei were visualized with DAPI staining. (E) MDA‐MB‐231 cells were treated with 1 μM G‐1 for the indicated times, and then protein levels of Snail, Slug, Twist, and ZEB1 were detected by Western blotting; (F) MDA‐MB‐231 cells were treated with 1 μM G‐1 for the indicated times, nuclear and cytoplasmic cellular fractions were isolated by differential lysis. The levels of Snail and Slug in nuclear and cytoplasmic cellular fractions were detected by Western blot analysis. Data represented the average of three independent experiments. *p < 0.05 compared with control, **p < 0.01 compared with control. Scale bar = 100 μm.
Since transcription factors Snail, ZEB1, Twist and Slug play essential roles in the regulation of EMT (Thiery et al., 2009), we then investigated whether their expressions were modulated in G‐1 treatment. Our results showed that G‐1 treatment had no significant effect on the protein expression of Snail, Slug, Twist or ZEB1 in either MDA‐MB‐231 (Figure 3E) or BT‐549 (Figure S6) cells. Using nuclear/cytosol fractions, we then investigated the nuclear translocation of Snail and Slug in MDA‐MB‐231 cells treated with 1 μM of G‐1 for 24 h or 48 h by Western blot analysis. The results showed that G‐1 treatment had no obvious effect on the subcellular localization of either Snail or Slug (Figure 3F). Similarly, G‐1 had no significant effect on the mRNA level of Snail or Slug in MDA‐MB‐231 cells (Figure S7). Generally, it seems that these EMT related transcription factors are not involved in the process of G‐1 induced EMT suppression of TNBC cells.
3.4. Inhibition of NF‐κB mediates the suppressive effects of G‐1 on EMT
NF‐κB has been reported to play an essential role in the EMT and further link estrogen signals of breast cancer (Huber et al., 2004; Li et al., 2012; Radisky and Bissell, 2007). Therefore we determined the effects of G1 on the total and phosphorylated levels of p65 in the TNBC cells. The results showed that G‐1 rapidly (5 min) reduced p‐p65 levels in both MDA‐MB‐231 (Figure 4A) and BT‐549 (Figure S8) cells. The G‐1 elicited p65 dephosphorylation lasted for more than 48 h of the post‐treatment. Although the total level of p65 protein was unchanged in MDA‐MB‐231 (Figure 4A) and BT‐549 (Figure S9) cells, a reduction of its abundance in nuclear localization was detected (Figure 4B). Using dual luciferase reporter assay, our data demonstrated that G‐1 treatment caused a time‐dependent reduction in NF‐κB‐driven transcriptional activities in MDA‐MB‐231 cells (Figure 4C). Collectively, our data revealed that the activation of GPER reduces the phosphorylation, nuclear localization, and transcriptional activities of NF‐κB.
Figure 4.
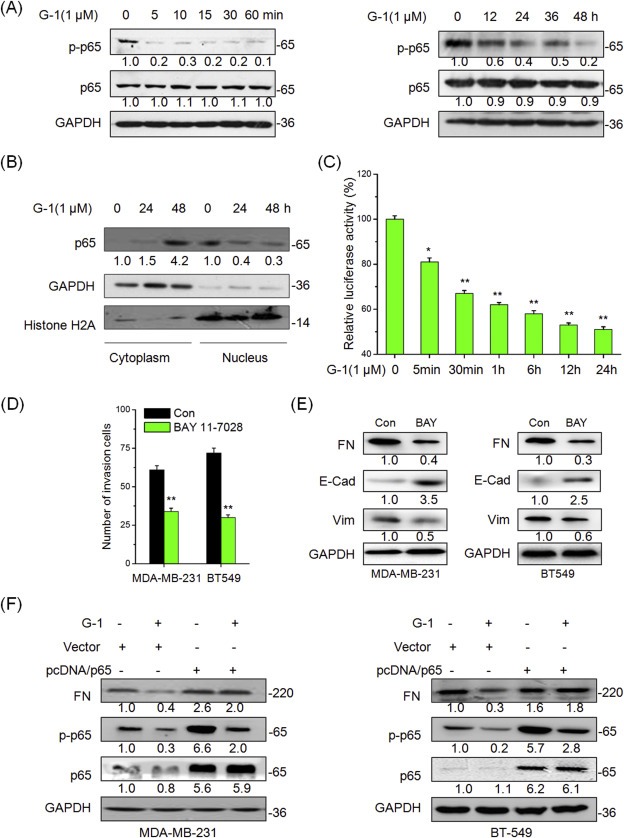
NF‐κB mediates the suppression effects of G‐1 on EMT. (A) MDA‐MB‐231 cells were treated with 1 μM G‐1 for the indicated times, and then the expression of phosphorylation and total p65 were measured by Western blot analysis; (B) MDA‐MB‐231 cells were treated with 1 μM G‐1 for 24 or 48 h, nuclear and cytoplasmic cellular fractions were isolated by differential lysis. The levels of p65 in nuclear and cytoplasmic cellular fractions were detected by Western blot analysis; (C) MDA‐MB‐231 cells were transfected with a luciferase reporter construct containing 5 copies of the κB site plasmid for 24 h and treated with 1 μM G‐1 for the indicated times, then the lysates were assayed. Shown are relative luciferase activities normalized to Renilla activities; (D) MDA‐MB‐231 or BT‐549 cells were allowed to invade transwell chambers for 48 h in the presence or absence of10 μM BAY 11‐7028, then invaded cells were fixed and counted; (E) MDA‐MB‐231 or BT‐549 cells were treated with or without 10 μM BAY 11‐7028 for 48 h, the expression of FN, E‐Cad, and Vim were detected by Western blot analysis; (F) MDA‐MB‐231 or BT‐549 cells were transfected with pcDNA3.1 (Vector control) or pcDNA/p65 for 24 h and then treated with 1 μM G‐1 for further 48 h. Then the expression of mesenchymal marker FN and epithelial maker E‐cad were detected by Western blot analysis. Data represented the average of three independent experiments. *p < 0.05 compared with control, **p < 0.01 compared with control.
To verify the role of NF‐κB in G‐1 induced EMT suppression in TNBC cells, MDA‐MB‐231 and BT‐549 cells were treated with NF‐κB specific antagonist BAY11‐7028 for 48 h. Our data showed that BAY11‐7028 alone treatment mimicked the effects of G‐1 in suppressing invasion (Figure 4D) and EMT progression (Figure 4E) of MDA‐MB‐231 and BT‐549 cells. An over expression of NF‐κB in MDA‐MB‐231 cells by the transfection pcDNA3.1/p65 plasmid (Figure S10) attenuated G‐1 induced cobblestone‐like epithelial morphology (Figure S11) and rescued the inhibitory effects of G‐1 on wound closure and invasion (Figure S12). These effects were confirmed by Western blot analysis, which showed that the over expression of p65 significantly abolished the inhibitory effects of G‐1 on the expression of FN in both MDA‐MB‐231 and BT‐549 cells (Figure 4F). Collectively, these observations showed that an inhibition of NF‐κB signaling mediates the suppressive effects of G‐1 on EMT of TNBC cells.
3.5. Phosphorylation of GSK‐3β by ERK1/2 and PI3K/Akt participates in the process of G‐1 suppressed NF‐κB activities
Previous studies reported that an activation of GPER induces phosphorylation of its downstream targets including PKA, PKB (PI3K/Akt), PKC, MAPK, and GSK‐3β, which can regulate the activation and subcellular localization of NF‐κB (Oeckinghaus et al., 2011). In this study, we found that G‐1 treatment (5–15 min) can rapidly increase the phosphorylation of PKC, ERK1/2, Akt, and GSK‐3β (Figure 5A), while had no obvious effects on the phosphorylation of JNK, p38‐MAPK, and PKA (Figure S13). The phosphorylation of ERK1/2, Akt, and GSK‐3β were maintained for more than 24 h of the post‐treatment in MDA‐MB‐231 cells (Figure S14). The phosphorylation of GSK‐3β, which maintains GSK‐3β an inactive state, is reported to negative control the activation of NF‐κB (Kotliarova et al., 2008). To verify the roles of GSK‐3β in G‐1 suppressed NF‐κB activities and FN expression, we knocked down the expression of GSK‐3β in MDA‐MB‐231 cells using its specific si‐RNA. The data showed that the silencing of GSK‐3β was associated with markedly decreases in the expression levels of p‐p65 and FN (Figure 5 B). Furthermore, the treatment of the MDA‐MB‐231 cells with LiCl, a potent GSK‐3β inhibitor, led to significant reductions in the expression levels of p‐p65 and FN (Figure 5C).
Figure 5.
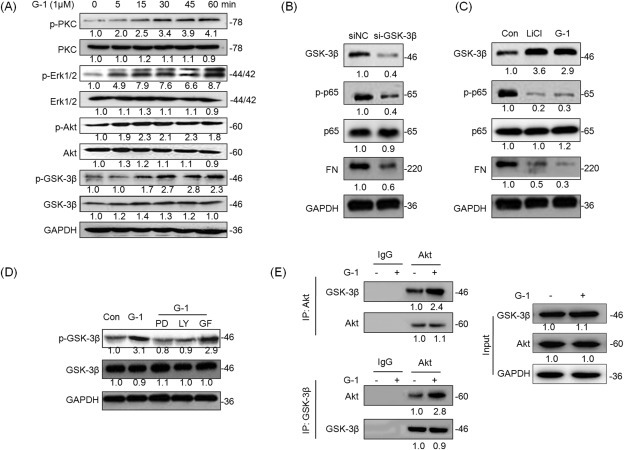
Phosphorylation of GSK‐3β by PI3K/Akt and ERK1/2 participates the process of G‐1 suppressed NF‐κB activities. (A) MDA‐MB‐231 were treated with 1 μM G‐1 for the indicated times, and then the phosphorylation and total protein levels of PKC, ERK1/2, Akt, and GSK‐3β were detected by Western blot analysis; (B) MDA‐MB‐231 cells were transfected with si‐NC or GSK‐3β siRNAs for 24 h, and then the p‐GSK‐3β, p‐p65, p65, and FN were detected by Western blot analysis; (C) MDA‐MB‐231 cells were treated with LiCl (GSK‐3β inhibitor) or G‐1 for 30 min, and then the p‐GSK‐3β, p‐p65, p65, and FN were detected by Western blot analysis; (D) MDA‐MB‐231 cells were pretreated with 10 μM ERK1/2 inhibitor PD98059 (PD), PI3K inhibitor LY294002 (LY), or PKC inhibitor GF109203X (GF) for 90 min, and then exposed to 1 μM G‐1 for further 15 min, the phosphorylation and total protein levels of GSK‐3β were detected by Western blot analysis; (E) MDA‐MB‐231 cells were treated with G‐1 for 12 h, and then GSK‐3β and Akt were immunoprecipitated, respectively, from equal amount of lysates and the associated GSK‐3β or Akt were detected by Western blot analysis. Data represented three independent experiments.
The G‐1 induced phosphorylation of PKC, ERK1/2, and Akt (5 min) was earlier than that of GSK‐3β (15 min). Presumably PI3K/Akt, PKC, and ERK1/2 might be the upstream regulators of GSK‐3β (Zhao et al., 2008). Using pharmacological approach, our data showed that both LY294002 (PI3K/Akt inhibitor) and PD 98059 (ERK1/2 inhibitor), but not GF109203X (PKC inhibitor), significantly attenuated G‐1 induced phosphorylation of GSK‐3β (Figure 5D). Furthermore, protein immunoprecipitation experiments showed an increase in the interaction between Akt and GSK‐3β in G‐1 treated MDA‐MB‐231 cells (Figure 5E). Taken together, our results demonstrated that the phosphorylation of GSK‐3β by PI3K/Akt and ERK1/2 mediates, at least partially, the suppressive effects of G‐1 on intracellular NF‐κB activities.
3.6. Activation of GPER down regulates FN and inhibits the progression of TNBC in vivo
To verify the roles of GPER in EMT and metastasis of TNBC in vivo, we checked the expression and correlation of GPER and FN in the 135 TNBC patients, of which 81 had elevated GPER and 47 had low levels of FN (Table S1). Of the 43 tumors with high expression levels of GPER, 22 (51.2%) samples showed lesser FN expression. Of the 54 tumors with low levels of GPER, 30 (55.5%) samples exhibited greater FN expression. The Fisher's exact test suggested that the scores for GPER and FN immunostaining were significantly (p < 0.01) negatively correlated with 53.3% (72/135) of the tissue samples. The data suggested that GPER down regulates FN in the clinical TNBC tissues.
Furthermore, we examined the effect of G‐1 on the progression of MDA‐MB‐231 tumor xenografts in nude mice. Our results showed that G‐1 treatment significantly (p < 0.01) reduced the growth of MDA‐MB‐231 tumor xenografts in nude mice (Figure 6A). Western blot analysis showed that G‐1 treatment significantly reduced the expression levels of FN and Vim but enhanced the expression levels of E‐Cad in tumors of G‐1 group (Figure 6B). Further, we observed that Akt and GSK‐3β were constitutively phosphorylated and p65 was constitutively dephosphorylated in tumors of G‐1 group (Figure 6B). Interestingly, G‐1 treatment also decreased the expression levels of Snail in vivo, which was contrary to our in vitro results and needed further investigation. The effects of G‐1 treatment on a reduction of FN expression but an increase of E‐Cad levels in the primary tumor xenografts were also confirmed by the results of IHC (Figure 6C). Metastatic breast cancer is known to form secondary tumors in the lungs (Minn et al., 2005). Therefore, we performed histological analysis and found that lung metastases were abated in the G‐1 treatment group (Figure 6D). The number of metastases to the lungs in the G‐1 group (4.8 ± 2.3, n = 13) was significantly (p < 0.05) lesser than that in the control group (11 ± 4.5, n = 11). These data suggested that the activation of GPER inhibits the growth and invasive capability of TNBC via the suppression of EMT process.
Figure 6.
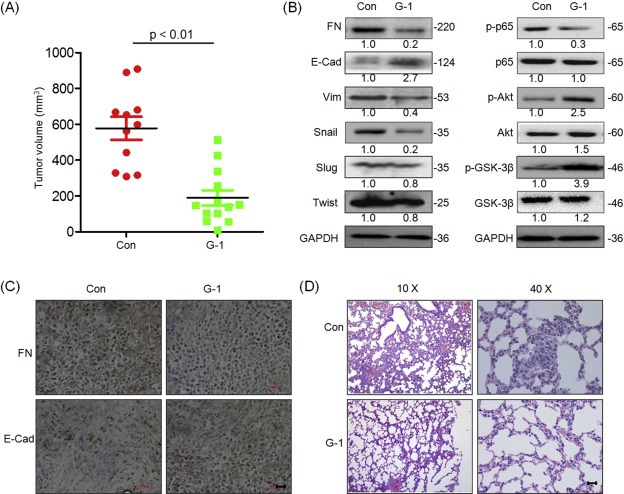
Activation of GPER inhibits the growth and metastasis of TNBC in vivo. (A) The tumor volumes of G‐1 (n = 13) and control (n = 11) group at the end of experiment; (B) The total and phosphorylated proteins related to the metastasis suppression effects of G‐1 were determined by Western blot analysis in the tumor lysates from the control and G‐1 treated group; (C) The tumor tissue sections of control and G‐1 group were subjected to IHC detection of FN and E‐Cad; (D) H&E examination of metastasis in lung tissue sections of the control and G‐1 group. Scale bar = 100 μm.
4. Discussion
GPER has been reported to mediate estrogen signals in the progression of breast cancer cells, while its role in metastasis of TNBC remains not clear. In this report, we demonstrated that the expression of GPER is negatively correlated with high‐grade tumors, lymph node metastasis, overall survival, and FN expression in 135 cases of TNBC patients. Using both in vitro and in vivo experimental models, we demonstrated that the activation of GPER pathway inhibited EMT, decreased the expression levels of FN, and suppressed the metastasis of TNBC, via down regulation of NF‐κB activities through multiple intracellular signaling pathways (Figure 7). The over expression of NF‐κB attenuated G‐1 induced EMT suppression. In MDA‐MB‐231 tumor xenografts, G‐1 treatment significantly inhibited growth and lung metastases in nude mice via suppression of EMT. Taken together, the data reveal the first time that the activation of GPER can effectively suppress the metastasis of TNBC via an inhibition of EMT.
Figure 7.
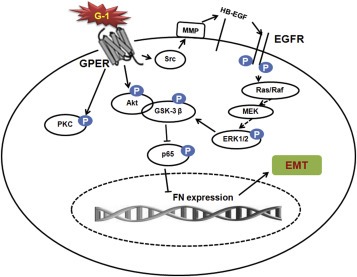
A proposed model to illustrate the mechanisms of GPER mediated EMT suppression of TNBC cells.
Our data in demonstrating the inhibitory effects of G‐1 on the in vitro migration and in vivo metastasis of TNBC are consistent with the observations reported in using ovarian cancer models (Henic et al., 2009; Ignatov et al., 2013a), however are inconsistent to other studies that demonstrated GPER activation was able to promote metastasis of ER‐negative breast (Pandey et al., 2009; Yu et al., 2014), ovarian (Yan et al., 2013), and endometrial (He et al., 2012) cancer cells. The contradictory observations might be due to the use of agonists of different specificities (i.e. estrogen, tamoxifen, and bisphenol A) in their studies (Jiang et al., 2013b; Pandey et al., 2009; Yan et al., 2013; Yu et al., 2014) as compared to the use of the specific agonist G‐1 in our study. Therefore in cancer cells expressing the classical ERα and estrogen related receptor α (ERRα), the pro‐migration effects might be exerted and stimulated via ERα (Park et al., 2008; Ye et al., 2010) or ERRα (Lam et al., 2014; Sailland et al., 2014), rather than the GPER pathway.
Although we have demonstrated the inhibitory effects of G‐1 on EMT in TNBC cells, our results showed that the expression and subcellular localization of EMT‐associated transcription factors Snail, ZEB1, Twist and Slug, were not altered by G‐1 treatment. Nevertheless the phosphorylation, nuclear localization, and transcriptional activities of NF‐κB in association with EMT were significantly reduced by the G‐1 treatment. This is supported by the over expression study to show the effects of p65 on attenuating the inhibitory action of G‐1 on EMT. The cytoskeletal protein FN, a mesenchymal marker and a target gene of NF‐κB (Stanisavljevic et al., 2014) was significantly inhibited by the activation of GPER in our study. NF‐κB has been identified as an important regulator of EMT in cancer cells (Huber et al., 2004; Maier et al., 2010). For example, TGF‐β induced EMT of pancreatic carcinoma cells was dependent on NF‐κB signaling (Maier et al., 2010). The blocking NF‐κB activity led to a reversal of the mesenchymal phenotype (Huber et al., 2004). Our present study provides the evidence that GPER can inhibit the activities of NF‐κB and suppress the EMT and FN expression in TNBC cells.
The activation of GPER can modulate the activities of multiple downstream signals including PKA, PKC, MAPK and PI3K/Akt (Prossnitz and Barton, 2011; Zucchetti et al., 2014). A study suggested that GPCR can inactive NF‐κB via Gαs‐mediated elevation of cAMP, an activation of PKA, and an increased phosphorylation of cAMP response element‐binding protein (CREB) (Ye, 2001). Our data revealed that an activation of GPER led to a steady effect (more than 24 h) on the phosphorylation of GSK‐3β in TNBC cells. GSK‐3β, which can be phosphorylated and then maintained an inactive state, can negative control the activation of NF‐κB and EMT (Kotliarova et al., 2008). This is confirmed in our study that the use of specific inhibitor or siRNA of GSK‐3β can mimic the action of G‐1, on the suppression of EMT in TNBC cells. The use of the inhibitors for ERK1/2 and PI3K/Akt, but not PKC, suppressed G‐1‐induced phosphorylation of GSK‐3β. Furthermore, G‐1 treatment can increase the interaction of Akt and GSK‐3β while GSK‐3β was inactivated by Akt and ERK1/2 through phosphorylation on Ser 9 (Cohen and Frame, 2001; Ding et al., 2005). In another study using ER‐negative breast cancer cells, an inhibition of ERK1/2 was demonstrated to stimulate cell motility (Bartucci et al., 2001). Collectively, our data revealed that the phosphorylation of GSK‐3β mediates, at least partially, the process of G‐1 suppressed NF‐κB activities and FN expression.
Consistent to the in vitro studies, our in vivo data showed that the activation of GPER pathway can inhibit the growth and metastasis of TNBC cells. In MDA‐MB‐231 tumor xenografts, the activation of GPER led to the phosphorylation of GSK‐3β, the decreases in the activity of NF‐κB and expression level of FN. Clinical data analysis showed that GPER is negatively associated with metastasis, high‐grade tumor, poor prognosis, and FN expression in 135 TNBC patients. To date only a few reports elucidated the correlation between GPER signaling and clinical prognosis of cancer patients. For example, GPER expression was suggested as a marker to predict poor survival (Smith et al., 2009), was shown to have no correlation with clinical outcome (Kolkova et al., 2012), or was down‐regulated during cancer tumorigenesis (Ignatov et al., 2013a) of ovarian cancer patients. The clinical correlation of GPER to cancer progression is elusive. In the case of TNBC, there is a study indicating that high expression of GPER is associated with young age and possibly disease recurrence in 24 TNBC patients (Steiman et al., 2013). However, GPER is reported to be associated with a longer recurrent‐free survival (RFS) in breast cancer patients (Ignatov et al., 2011). Other studies reported that the cytoplasmic GPER expression was significantly associated with lower tumor stage in breast cancers (Samartzis et al., 2014). Others reported a decrease of GPER expression was associated with positive lymph node status, undifferentiated tumors, negative ER status, and poor patients' overall survival (OS) and disease‐free survival (DFS) (Arias‐Pulido et al., 2010; Ignatov et al., 2013b). Therefore, the inconsistent observations among these studies might be due to the use of different subtypes of breast cancer samples and subcellular localization of GPER (Pandey et al., 2009). In this study, our correlation analysis supports the notion that GPER can act as a tumor suppressor and might be a marker of favorable prognosis for TNBC patients.
In conclusion, our present study reveals that the activation of GPER can inhibit the EMT and metastasis of TNBC via NF‐κB signaling. Although further studies are needed, our findings are important for several reasons. We have shown that GPER activation suppresses EMT of TNBC, which provides a solid mechanistic evidence for the inhibitory effects of GPER on the progression of TNBC. We also present for the first time, the down regulation of NF‐κB activity through the phosphorylation of GSK‐3β by PI3K/Akt and ERK1/2. Moreover, GPER acts as a tumor suppressor and a marker of favorable prognosis for TNBC patients. Taken together with our earlier reports that link GPER with TNBC proliferation (Wei et al., 2014), the present study not only suggests that GPER is a critical therapeutic target in TNBC but also provides G‐1 as a drug candidate for TNBC metastasis.
Conflict of interest
The authors declare no conflict of interest.
Supporting information
The following is the supplementary data related to this article:
Supplementary data
Acknowledgments
This research was supported by the National Natural Science Foundation of China (Grant No. 81472470 and No. 81302317), the Guangdong Natural Science Funds for Distinguished Young Scholar (No. 2014A030306025), the Pearl River S&T Nova Program of Guangzhou (No. 201506010039, the Fundamental Research Funds for the Central Universities (Sun Yat‐sen University) (No. 12ykpy09), the Science and Technology Planning Project of Guangdong Province, China (No. 2012B031500005), and the Opening Project Program of State Key Laboratory of Oncology in South China (No. HN2014‐09).
Supplementary data 1.
1.1.
Supplementary data related to this article can be found at http://dx.doi.org/10.1016/j.molonc.2016.01.002.
Chen Zhuo-Jia, Wei Wei, Jiang Guan-Min, Liu Hao, Wei Wei-Dong, Yang Xiangling, Wu Ying-Min, Liu Huanliang, Wong Chris K.C., Du Jun, Wang Hong-Sheng, (2016), Activation of GPER suppresses epithelial mesenchymal transition of triple negative breast cancer cells via NF‐κB signals, Molecular Oncology, 10, doi: 10.1016/j.molonc.2016.01.002.
References
- Al Moustafa, A.E. , 2013. Epithelial-mesenchymal transition and its regulators are major targets of triple-negative breast cancer. Cell Adh. Migr. 7, 424–425. [DOI] [PMC free article] [PubMed] [Google Scholar]
- Arias-Pulido, H. , Royce, M. , Gong, Y. , Joste, N. , Lomo, L. , Lee, S.J. , 2010. GPR30 and estrogen receptor expression: new insights into hormone dependence of inflammatory breast cancer. Breast Cancer Res. Treat. 123, 51–58. [DOI] [PMC free article] [PubMed] [Google Scholar]
- Ariazi, E.A. , Brailoiu, E. , Yerrum, S. , Shupp, H.A. , Slifker, M.J. , Cunliffe, H.E. , 2010. The G protein-coupled receptor GPR30 inhibits proliferation of estrogen receptor-positive breast cancer cells. Cancer Res. 70, 1184–1194. [DOI] [PMC free article] [PubMed] [Google Scholar]
- Bartucci, M. , Morelli, C. , Mauro, L. , Ando, S. , Surmacz, E. , 2001. Differential insulin-like growth factor I receptor signaling and function in estrogen receptor (ER)-positive MCF-7 and ER-negative MDA-MB-231 breast cancer cells. Cancer Res. 61, 6747–6754. [PubMed] [Google Scholar]
- Chen, Z.J. , Yang, X.L. , Liu, H. , Wei, W. , Zhang, K.S. , Huang, H.B. , 2015. Bisphenol A modulates colorectal cancer protein profile and promotes the metastasis via induction of epithelial to mesenchymal transitions. Arch. Toxicol. 89, 1371–1381. [DOI] [PubMed] [Google Scholar]
- Cohen, P. , Frame, S. , 2001. The renaissance of GSK3. Nat. Rev. Mol. Cell Biol. 2, 769–776. [DOI] [PubMed] [Google Scholar]
- Craene, B.D. , Berx, G. , 2013. Regulatory networks defining EMT during cancer initiation and progression. Nat. Rev. Cancer. 13, 97–110. [DOI] [PubMed] [Google Scholar]
- Desantis, C. , Ma, J. , Bryan, L. , Jemal, A. , 2014. Breast cancer statistics, 2013. CA Cancer J. Clin. 64, 52–62. [DOI] [PubMed] [Google Scholar]
- Ding, Q. , Xia, W. , Liu, J.C. , Yang, J.Y. , Lee, D.F. , Xia, J. , 2005. Erk associates with and primes GSK-3beta for its inactivation resulting in upregulation of beta-catenin. Mol. Cell. 19, 159–170. [DOI] [PubMed] [Google Scholar]
- Filardo, E.J. , Graeber, C.T. , Quinn, J.A. , Resnick, M.B. , Giri, D. , DeLellis, R.A. , 2006. Distribution of GPR30, a seven membrane-spanning estrogen receptor, in primary breast cancer and its association with clinicopathologic determinants of tumor progression. Clin. Cancer Res. 12, 6359–6366. [DOI] [PubMed] [Google Scholar]
- Filigheddu, N. , Sampietro, S. , Chianale, F. , Porporato, P.E. , Gaggianesi, M. , Gregnanin, I. , 2011. Diacylglycerol kinase alpha mediates 17-beta-estradiol-induced proliferation, motility, and anchorage-independent growth of Hec-1A endometrial cancer cell line through the G protein-coupled estrogen receptor GPR30. Cell Signal. 23, 1988–1996. [DOI] [PubMed] [Google Scholar]
- Ge, C. , Yu, M. , Zhang, C. , 2012. G protein-coupled receptor 30 mediates estrogen-induced proliferation of primordial germ cells via EGFR/Akt/beta-catenin signaling pathway. Endocrinology. 153, 3504–3516. [DOI] [PubMed] [Google Scholar]
- Ge, L.C. , Chen, Z.J. , Liu, H.Y. , Zhang, K.S. , Liu, H. , Huang, H.B. , 2014. Involvement of activating ERK1/2 through G protein coupled receptor 30 and estrogen receptor alpha/beta in low doses of bisphenol A promoting growth of Sertoli TM4 cells. Toxicol. Lett. 226, 81–89. [DOI] [PubMed] [Google Scholar]
- Gilbert, J.A. , 2012. Potential therapeutic target for triple-negative breast cancer. Lancet Oncol. 13, e330 [DOI] [PubMed] [Google Scholar]
- He, Y.Y. , Du, G.Q. , Cai, B. , Yan, Q. , Zhou, L. , Chen, X.Y. , 2012. Estrogenic transmembrane receptor of GPR30 mediates invasion and carcinogenesis by endometrial cancer cell line RL95-2. J. Cancer Res. Clin. Oncol. 138, 775–783. [DOI] [PubMed] [Google Scholar]
- Henic, E. , Noskova, V. , Hoyer-Hansen, G. , Hansson, S. , Casslen, B. , 2009. Estradiol attenuates EGF-induced rapid uPAR mobilization and cell migration via the G-protein-coupled receptor 30 in ovarian cancer cells. Int. J. Gynecol. Cancer. 19, 214–222. [DOI] [PubMed] [Google Scholar]
- Huber, M.A. , Azoitei, N. , Baumann, B. , Grunert, S. , Sommer, A. , Pehamberger, H. , 2004. NF-kappa B is essential for epithelial-mesenchymal transition and metastasis in a model of breast cancer progression. J. Clin. Investig. 114, 569–581. [DOI] [PMC free article] [PubMed] [Google Scholar]
- Ignatov, A. , Ignatov, T. , Weissenborn, C. , Eggemann, H. , Bischoff, J. , Semczuk, A. , 2011. G-protein-coupled estrogen receptor GPR30 and tamoxifen resistance in breast cancer. Breast Cancer Res. Treat. 128, 457–466. [DOI] [PubMed] [Google Scholar]
- Ignatov, T. , Modl, S. , Thulig, M. , Weissenborn, C. , Treeck, O. , Ortmann, O. , 2013. GPER-1 acts as a tumor suppressor in ovarian cancer. J. Ovarian Res. 6, 51 [DOI] [PMC free article] [PubMed] [Google Scholar]
- Ignatov, T. , Weissenborn, C. , Poehlmann, A. , Lemke, A. , Semczuk, A. , Roessner, A. , 2013. GPER-1 expression decreases during breast cancer tumorigenesis. Cancer Investig. 31, 309–315. [DOI] [PubMed] [Google Scholar]
- Jiang, G.M. , Wang, H.S. , Zhang, F. , Zhang, K.S. , Liu, Z.C. , Fang, R. , 2013. Histone deacetylase inhibitor induction of epithelial-mesenchymal transitions via up-regulation of Snail facilitates cancer progression. BBA Mol. Cell Res. 1833, 663–671. [DOI] [PubMed] [Google Scholar]
- Jiang, Q.F. , Wu, T.T. , Yang, J.Y. , Dong, C.R. , Wang, N. , Liu, X.H. , 2013. 17 beta-Estradiol promotes the invasion and migration of nuclear estrogen receptor-negative breast cancer cells through cross-talk between GPER1 and CXCR1. J. Steroid Biochem. Mol. Biol. 138, 314–324. [DOI] [PubMed] [Google Scholar]
- Kirkpatrick, P. , 2009. Targeting triple-negative breast cancer. Nat. Rev. Drug Discov. 8, 21 [Google Scholar]
- Kolkova, Z. , Casslén, V. , Henic, E. , Ahmadi, S. , Ehinger, A. , Jirstrom, K. , 2012. The G protein-coupled estrogen receptor 1 (GPER/GPR30) does not predict survival in patients with ovarian cancer. J. Ovarian Res. 5, 9 [DOI] [PMC free article] [PubMed] [Google Scholar]
- Kotliarova, S. , Pastorino, S. , Kovell, L.C. , Kotliarov, Y. , Song, H. , Zhang, W. , 2008. Glycogen synthase kinase-3 inhibition induces glioma cell death through c-MYC, nuclear factor-kappa B, and glucose regulation. Cancer Res. 68, 6643–6651. [DOI] [PMC free article] [PubMed] [Google Scholar]
- Lam, S.S. , Mak, A.S. , Yam, J.W. , Cheung, A.N. , Ngan, H.Y. , Wong, A.S. , 2014. Targeting estrogen-related receptor alpha inhibits epithelial-to-mesenchymal transition and stem cell properties of ovarian cancer cells. Mol. Ther. 22, 743–751. [DOI] [PMC free article] [PubMed] [Google Scholar]
- Lappano, R. , Maggiolini, M. , 2011. G protein-coupled receptors: novel targets for drug discovery in cancer. Nat. Rev. Drug Discov. 10, 47–60. [DOI] [PubMed] [Google Scholar]
- Lappano, R. , Pisano, A. , Maggiolini, M. , 2014. GPER function in breast Cancer: an Overview. Front. Endocrinol. (Lausanne). 5, 66 [DOI] [PMC free article] [PubMed] [Google Scholar]
- Li, C.W. , Xia, W. , Huo, L. , Lim, S.O. , Wu, Y. , Hsu, J.L. , 2012. Epithelial-mesenchymal transition induced by TNF-alpha requires NF-kappaB-mediated transcriptional upregulation of Twist1. Cancer Res. 72, 1290–1300. [DOI] [PMC free article] [PubMed] [Google Scholar]
- Li, Y.C. , Ding, X.S. , Li, H.M. , Zhang, Y. , Bao, J. , 2014. Role of G protein-coupled estrogen receptor 1 in modulating transforming growth factor-beta stimulated mesangial cell extracellular matrix synthesis and migration. Mol. Cell. Endocrinol. 391, 50–59. [DOI] [PubMed] [Google Scholar]
- Liu, H. , Zhou, B.H. , Qiu, X. , Wang, H.S. , Zhang, F. , Fang, R. , 2012. T63, a new 4-arylidene curcumin analogue, induces cell cycle arrest and apoptosis through activation of the reactive oxygen species-FOXO3a pathway in lung cancer cells. Free Radic. Biol. Med. 53, 2204–2217. [DOI] [PubMed] [Google Scholar]
- Luo, L.J. , Liu, F. , Lin, Z.K. , Xie, Y.F. , Xu, J.L. , Tong, Q.C. , 2012. Genistein regulates the IL-1 beta induced activation of MAPKs in human periodontal ligament cells through G protein-coupled receptor 30. Arch. Biochem. Biophys. 522, 9–16. [DOI] [PubMed] [Google Scholar]
- Madeo, A. , Maggiolini, M. , 2010. Nuclear alternate estrogen receptor GPR30 mediates 17beta-estradiol-induced gene expression and migration in breast cancer-associated fibroblasts. Cancer Res. 70, 6036–6046. [DOI] [PubMed] [Google Scholar]
- Maier, H.J. , Schmidt-Strassburger, U. , Huber, M.A. , Wiedemann, E.M. , Beug, H. , Wirth, T. , 2010. NF-kappa B promotes epithelial-mesenchymal transition, migration and invasion of pancreatic carcinoma cells. Cancer Lett. 295, 214–228. [DOI] [PubMed] [Google Scholar]
- Minn, A.J. , Gupta, G.P. , Siegel, P.M. , Bos, P.D. , Shu, W.P. , Giri, D.D. , 2005. Genes that mediate breast cancer metastasis to lung. Nature. 436, 518–524. [DOI] [PMC free article] [PubMed] [Google Scholar]
- Mostert, B. , Sleijfer, S. , Foekens, J.A. , Gratama, J.W. , 2009. Circulating tumor cells (CTCs): detection methods and their clinical relevance in breast cancer. Cancer Treat. Rev. 35, 463–474. [DOI] [PubMed] [Google Scholar]
- Oeckinghaus, A. , Hayden, M.S. , Ghosh, S. , 2011. Crosstalk in NF-kappaB signaling pathways. Nat. Immunol. 12, 695–708. [DOI] [PubMed] [Google Scholar]
- Pandey, D.P. , Lappano, R. , Albanito, L. , Madeo, A. , Maggiolini, M. , Picard, D. , 2009. Estrogenic GPR30 signalling induces proliferation and migration of breast cancer cells through CTGF. EMBO J. 28, 523–532. [DOI] [PMC free article] [PubMed] [Google Scholar]
- Park, S.H. , Cheung, L.W. , Wong, A.S. , Leung, P.C. , 2008. Estrogen regulates Snail and Slug in the down-regulation of E-cadherin and induces metastatic potential of ovarian cancer cells through estrogen receptor alpha. Mol. Endocrinol. 22, 2085–2098. [DOI] [PMC free article] [PubMed] [Google Scholar]
- Prossnitz, E.R. , Barton, M. , 2011. The G-protein-coupled estrogen receptor GPER in health and disease. Nat. Rev. Endocrinol. 7, 715–726. [DOI] [PMC free article] [PubMed] [Google Scholar]
- Radisky, D.C. , Bissell, M.J. , 2007. NF-kappaB links oestrogen receptor signalling and EMT. Nat. Cell Biol. 9, 361–363. [DOI] [PubMed] [Google Scholar]
- Sailland, J. , Tribollet, V. , Forcet, C. , Billon, C. , Barenton, B. , Carnesecchi, J. , 2014. Estrogen-related receptor alpha decreases RHOA stability to induce orientated cell migration. Proc. Natl. Acad. Sci. 111, 15108–15113. [DOI] [PMC free article] [PubMed] [Google Scholar]
- Samartzis, E.P. , Noske, A. , Meisel, A. , Varga, Z. , Fink, D. , Imesch, P. , 2014. The G protein-coupled estrogen receptor (GPER) is expressed in two different subcellular localizations reflecting distinct tumor properties in breast cancer. Plos One. 9, e83296 [DOI] [PMC free article] [PubMed] [Google Scholar]
- Smith, H.O. , Arias-Pulido, H. , Kuo, D.Y. , Howard, T. , Qualls, C.R. , Lee, S.J. , 2009. GPR30 predicts poor survival for ovarian cancer. Gynecol. Oncol. 114, 465–471. [DOI] [PMC free article] [PubMed] [Google Scholar]
- Stanisavljevic, J. , Porta-de-la-Riva, M. , Batlle, R. , de Herreros, A.G. , Baulida, J. , 2014. The p65 subunit of NF-kappaB and PARP1 assist Snail1 in activating fibronectin transcription. J. Cell Sci. 124, 4161–4171. [DOI] [PubMed] [Google Scholar]
- Steiman, J. , Peralta, E.A. , Louis, S. , Kamel, O. , 2013. Biology of the estrogen receptor, GPR30, in triple negative breast cancer. Am. J. Surg. 206, 698–703. [DOI] [PubMed] [Google Scholar]
- Thiery, J.P. , Acloque, H. , Huang, R.Y.J. , Nieto, M.A. , 2009. Epithelial-mesenchymal transitions in development and disease. Cell. 139, 871–890. [DOI] [PubMed] [Google Scholar]
- Tiwari, N. , Gheldof, A. , Tatari, M. , Christofori, G. , 2012. EMT as the ultimate survival mechanism of cancer cells. Semin. Cancer Biol. 22, 194–207. [DOI] [PubMed] [Google Scholar]
- Wang, C. , Lv, X. , He, C. , Hua, G. , Tsai, M.Y. , Davis, J.S. , 2013. The G-protein-coupled estrogen receptor agonist G-1 suppresses proliferation of ovarian cancer cells by blocking tubulin polymerization. Cell Death Dis. 4, e869 [DOI] [PMC free article] [PubMed] [Google Scholar]
- Wei, W. , Chen, Z.J. , Zhang, K.S. , Yang, X.L. , Wu, Y.M. , Chen, X.H. , 2014. The activation of G protein-coupled receptor 30 (GPR30) inhibits proliferation of estrogen receptor-negative breast cancer cells in vitro and in vivo. Cell Death Dis. 5, e1428 [DOI] [PMC free article] [PubMed] [Google Scholar]
- Yan, Y. , Liu, H. , Wen, H. , Jiang, X. , Cao, X. , Zhang, G. , 2013. The novel estrogen receptor GPER regulates the migration and invasion of ovarian cancer cells. Mol. Cell. Biochem. 378, 1–7. [DOI] [PubMed] [Google Scholar]
- Yao, S. , Zheng, P. , Wu, H. , Song, L.M. , Ying, X.F. , Xing, C. , 2015. Erbin interacts with c-Cbl and promotes tumourigenesis and tumour growth in colorectal cancer by preventing c-Cbl-mediated ubiquitination and down-regulation of EGFR. J. Pathol. 236, 65–77. [DOI] [PubMed] [Google Scholar]
- Ye, R.D. , 2001. Regulation of nuclear factor kappaB activation by G-protein-coupled receptors. J. Leukoc. Biol. 70, 839–848. [PubMed] [Google Scholar]
- Ye, Y. , Xiao, Y. , Wang, W. , Yearsley, K. , Gao, J. , Shetuni, B. , 2010. ERα signaling through slug regulates E-cadherin and EMT. Oncogene. 29, 1451–1462. [DOI] [PubMed] [Google Scholar]
- Yu, T. , Liu, M. , Luo, H. , Wu, C. , Tang, X. , Tang, S. , 2014. GPER mediates enhanced cell viability and motility via non-genomic signaling induced by 17beta-estradiol in triple-negative breast cancer cells. J. Steroid Biochem. Mol. Biol. 143C, 392–403. [DOI] [PubMed] [Google Scholar]
- Zhao, L. , Lee, J.Y. , Hwang, D.H. , 2008. The phosphatidylinositol 3-kinase/Akt pathway negatively regulates Nod2-mediated NF-kappaB pathway. Biochem. Pharmacol. 75, 1515–1525. [DOI] [PubMed] [Google Scholar]
- Zucchetti, A.E. , Barosso, I.R. , Boaglio, A.C. , Basiglio, C.L. , Miszczuk, G. , Larocca, M.C. , 2014. G-protein-coupled receptor 30/adenylyl cyclase/protein kinase a pathway is involved in estradiol 17 beta-d-glucuronide-induced cholestasis. Hepatology. 59, 1016–1029. [DOI] [PubMed] [Google Scholar]
Associated Data
This section collects any data citations, data availability statements, or supplementary materials included in this article.
Supplementary Materials
The following is the supplementary data related to this article:
Supplementary data