

Abstract
1. Introduction
Alterations of the tumor suppressor Neurofibromatosis type II (NF2) have been reported in about 40% of Malignant pleural mesothelioma (MPM) patients. NF2 (Merlin) deficiency leads to alterations of the Hippo pathway; resulting in activation of the oncogenic Yes Associated Protein‐1 (YAP1). Our aim was to investigate the association between these alterations and clinical outcomes.
2. Material and methods
Tissue microarrays composed of MPM tumors derived from 2 independent MPM cohorts were employed for this study. Immunohistochemical expression of Merlin, YAP1 and its target genes, Survivin and connective tissue growth factor (CTGF) were assessed in nuclear and cytoplasmic fractions. Cohort 1 was comprised of 145 patients intended to be treated with chemotherapy (CTX) followed by extrapleural pneumonectomy (EPP), thus both pre‐ and post‐CTX tissues were available. Cohort 2 was comprised of 59 patients treated with EPP followed by intraoperative hyperthermic cisplatin and/or adjuvant CTX and/or radiotherapy. Marker expression was quantified by means of labeling index (%) for nuclear Survivin and by H‐score for the other markers. The dichotomized marker expression was tested for the association with overall survival (OS) and freedom from recurrence (FFR).
3. Results
Kaplan–Meier survival curves revealed a significant association between low cytoplasmic Merlin expression in pre‐induction CTX tissues of cohort 1 with shorter FFR (p = 0.02) and OS (p = 0.03). The same tendency was observed in the chemotherapy naïve tissues obtained during EPP of cohort 2. Low nuclear Merlin expression in post‐CTX tissues (available from cohort 1 only) was associated with shorter FFR (p = 0.04) and OS (p = 0.05). High nuclear Survivin labeling indices in both pre‐ and post‐CTX tissues of cohort 1 was associated with shorter FFR (p = 0.02). In cohort 2, this was associated with both FFR and OS (p = 0.046 and p = 0.002, respectively). In multivariate analysis, low expression of cytoplasmic Merlin remained an independent prognosticator for shorter FFR of cohort 1 [hazard ratio (HR) = 0.5, 95% confidence interval (CI) = 0.3–0.9, p = 0.001] and OS [HR = 0.5, 95% CI = 0.3–1, p = 0.04]. High Survivin labeling index was an independent prognostic factor for shorter FFR in patients from cohort 1 [HR = 3.4, 95% CI = 1.7–6.8, p = 0.006] and shorter OS in patients from cohort 2 [HR = 2.35, 95% CI = 1.27–4.33, p = 0.006].
4. Conclusions
Our findings uncover the significance of Merlin protein expression and Survivin labeling index as prognosticators for poor clinical outcome in two independent MPM cohorts. If confirmed, these markers may be used to identify subgroups of patients benefitting from additional treatment.
Keywords: Merlin, Hippo pathway, Survivin, Malignant pleural mesothelioma, Multimodality treatment
Highlights
Merlin and the Hippo pathway are prognostic factors for Malignant Pleural Mesothelioma.
Low cytoplasmic Merlin expression at diagnosis is associated with shorter survival.
A high nuclear Survivin labeling index is associated with shorter survival.
The data was confirmed in 2 patient cohorts undergoing different treatment regimens.
Abbreviations
- MPM
malignant pleural mesothelioma
- CTX
chemotherapy
- EPP
extrapleural pneumonectomy
- NF2
Neurofibromatosis type II
- mTOR
mammalian target of rapamycin
- YAP1
Yes Associated Protein1
- TEAD
TEA-domain family member
- BIRC5
Baculoviral IAP repeat containing 5
- CTGF
connective tissue growth factor
- OS
overall survival
- FFR
freedom from recurrence
1. Introduction
Malignant pleural mesothelioma (MPM) is an aggressive asbestos‐related malignancy arising primarily from mesothelial cells of the pleura. The incidence of MPM is increasing dramatically (Park et al., 2011; Peto et al., 1999) and is expected to peak before 2030 (Robinson, 2012) in developed countries. The prognosis of MPM is dismal with a median survival of 12 months as the disease of often detected at advanced stages (van Meerbeeck et al., 2011).
To date, induction chemotherapy (CTX) followed by maximal complete resection (MCT) is one of the most beneficial treatments known to ameliorate overall survival (OS) of MPM patients (Weder and Opitz, 2012). Various molecular targeted treatments are also being intensively explored (Stahel et al., 2015). As of yet, treatment decisions have been made based only on clinical parameters. However, due to the variable clinical staging of the disease and its heterogeneity, not all patients benefit from these treatments. Thus, molecular biomarkers that could assist in the treatment selection need to be intensively explored and validated.
MPM is accompanied by numerous genetic alterations, but a common oncogenic driver has yet to be identified. Nevertheless, nearly half of MPM tumors share the same feature being the defects in Neurofibromatosis type II (NF2) tumor suppressor gene. Heterozygous loss of chromosome 22q12.2 containing the NF2 gene as well as inactivating mutations have been detected in 40–50% of MPM patients (Bott et al., 2011; Bueno et al., 2016; Flejter et al., 1989). This highlights the importance of NF2 alterations as one of the major driving forces for MPM tumorigenesis.
Germline alterations of NF2 have been associated with tumors of the nervous system, primarily schwannomas and meningiomas (Evans et al., 1992). NF2 encodes Neurofibromin‐2 (Merlin), which suppresses tumorigenesis by regulating several pathways such as the mammalian target of rapamycin (mTOR) (James et al., 2009) and the Hippo signaling pathway (Rouleau et al., 1993). The Hippo signaling pathway controls organ size, development and differentiation (Saucedo and Edgar, 2007). Merlin activates the Hippo pathway (Bao et al., 2011; Pan, 2010) to induce cytoplasmic retention of the oncogenic Yes Associated Protein1 (YAP1). The dephosphorylated closed conformation of Merlin has been shown to be in its active, growth inhibitory state (Li et al., 2012). Active Merlin migrates into the nucleus and inhibits the ubiquitination of LATS1/2, key players of the Hippo pathway, thereby preventing nuclear retention of YAP1 (Li et al., 2014, 2010). The active nuclear fraction of YAP1, a transcriptional co‐activator, binds to TEA‐domain family member (TEAD) transcription factors to induce transcription of target genes such as BIRC5 (encoding apoptosis inhibitor Survivin) and CTGF (connective tissue growth factor) which are in turn involved in tumor progression and oncogenic transformation (Mizuno et al., 2012; Zhao et al., 2008).
In addition to being deregulated by Merlin loss of function, a component of Hippo pathway, LATS2, was found to be deleted and mutated in 12% of MPM patients (Murakami et al., 2011). Immunohistochemical analysis showed that more than 70% of MPM patients have constitutive activation of YAP1, as demonstrated by nuclear YAP1 being higher or equal to the cytoplasmic fraction (Murakami et al., 2011).
We therefore hypothesized that Merlin loss of function and alterations of Hippo pathway are related to the aggressiveness of MPM and can serve as prognostic biomarkers to be incorporated in treatment selection criteria. In addition to cytoplasmic expression, we assessed whether nuclear Merlin (the functionally active fraction) and constitutive YAP1 activation could be associated with survival outcomes. To date the active nuclear Merlin has not been assessed for its prognostic impact in cancer. YAP1/TEAD target genes, Survivin and CTGF were also assessed for their prognostic implications.
2. Materials and methods
2.1. Patients
Cohort 1: Tumor samples from 145 MPM patients were collected between 1999 and 2009. All patients were intended to be treated with induction CTX followed by surgery at the University Hospital of Zürich as previously described (Opitz et al., 2015). The study was approved, and waiver of consent was granted by the Ethical Committee Zürich (StV 29‐2009 and EK‐ZH 2012‐0094).
Cohort 2: Tumor samples from 59 patients treated with EPP at the Brigham and Women's Hospital in Boston were collected between 2002 and 2006. After giving informed consent, patients were enrolled on a specimen and data collection protocol (98‐063) that was approved by the Dana Farber/Harvard Cancer Center Institutional Review Board.
2.2. TMA construction and immunohistochemistry
Tumor samples were assembled on tissue microarrays (TMAs) (cohort 1: pre‐CTX and post‐CTX, 2 and 4 cores per biopsy, respectively) (cohort 2: chemo naïve, 4 cores per biopsy) as previously described (Hinterberger et al., 2007). Merlin and CTGF immunohistochemistry was performed manually by employing the following protocol: 2 μm TMA tissue sections were deparaffinized and rehydrated. Antigen retrieval was performed by boiling in a microwave oven (700 W) for 20 min in citrate buffer 0.01 M pH6.0. The TMAs were incubated with primary antibodies for Merlin (A‐19, Santa Cruz Biotechnology; 1:100) and CTGF (#88430, R&D Systems; 1:1000) overnight at 4 °C. Sections were washed and incubated with the corresponding secondary antibody followed by Vectastain ABC Reagent (Biotin/Avidin system, Vector laboratories). DAB chromogenic system (Dako) was applied for peroxidase‐based visualization of the signal. All intermediate washing steps were done with PBS pH 7.2, and all antibodies were diluted in PBS pH 7.2 with 2% BSA (Sigma–Aldrich), 2.5% normal serum and 0.2% Triton X‐100. Slides were counterstained with hematoxylin, dehydrated and coversliped with xylene based mounting medium. Anti‐Survivin (Biorbyt; 1:500) and anti‐YAP1 (EP1674Y, Abcam limited; 1:200) were applied for the staining using automated Ventana Bench Mark Ultra System after pretreatment with CC1 Solution (Ventana) for 60 min and 30 min, respectively.
2.3. Assessment of marker expression
Immunohistochemical evaluation of the TMAs was conducted in a blinded fashion (by M.M., B.B. and K.B.) and cross checked by two senior pathologists (AS and BV). The staining intensity was semi‐quantitatively scored 0 (negative), 0.5–1 (weak), 1.5–2 (moderate), or 2.5–3 (strong). Furthermore, the percentage of cells having any positivity was proportionally scored 0 (0%), 0.1 (1–9%), 0.5 (10–49%), or 1.0 (50% and more) as previously described (Sidi et al., 2011). The H‐score was obtained by multiplication of intensity with staining frequency (final range 0–3, per core). In addition, nuclear Survivin staining was also evaluated using a labeling index (% of positive tumor cells) in the representative tumor area or “hot spot” exhibiting higher number of positive cells than the rest of the tumor (Bitanihirwe et al., 2014). Few tissues were lost during the sectioning and staining, resulting in the variation in patient number between analyses.
2.4. Statistical analysis
Nonparametric tests were used to analyze the association of marker expression and histological subtype as well as tumor stage (Mann–Whitney U test). Spearman ranks correlation was used to assess the relationship of different marker expressions. Median survival time was estimated by employing the Kaplan–Meier method and the difference between the survival curves was analyzed by log rank‐test. OS was measured from the first cycle of chemotherapy to death. If no event occurred, the OS was measured until last follow up and censored in the analysis. Freedom from recurrence (FFR) of patients from cohort 1 was calculated from the first cycle of chemotherapy until tumor recurrence. FFR of patients from cohort 2 was determined from the date of surgery to the date of recurrence. If no recurrence occurred, the FFR was calculated until death or last follow up and was censored in the analysis. In order to study the joint influence of different factors on OS and FFR in a multivariate analysis, a stepwise Cox regression was performed including prognostic factors being significant in the univariate analysis. P‐values of less than 0.05 were considered as statistically significant. All analyses were carried out using IBM SPSS Statistics, version 22 (IBM Corp., Armonk, NY, USA).
2.5. Nuclear and cytoplasmic fractionation, protein extraction and western blot analysis
For total protein extraction, sparsely growing cells were harvested, lysed with RIPA buffer containing proteinase and phosphatase inhibitor (Sigma). After chromatin shearing by sonication, total protein extract was collected after centrifugation at 16,000g for 10 min. For subcellular fractionation, cells were harvested and incubated with cytoplasmic extraction buffer containing 10 mM Tris pH 7.5, 1.5 mM CaCl2, 10 mM NaCl, 0.3% TritonX‐100 and protease and phosphatase inhibitor cocktail (Sigma). After centrifugation at 1000g for 10 min, the supernatant (cytoplasmic extract) was collected. The nuclear pellet was washed twice in cytoplasmic extraction buffer without TritonX‐100. Afterwards, the nuclear pellet was re‐suspended in nuclear extraction buffer (10 mM Tris pH 7.9, 1.5 mM MgCl2, 10 mM KCl, 400 mM NaCl, 0.5% Triton X‐100 and protease and phosphatase inhibitor cocktail) and sonicated. Nuclear extract was collected after centrifugation at 16,000g for 5 min. For western blot analysis, 20 μg protein from each fraction was used.
3. Results
3.1. Patients' characteristics
The characteristics of the patient cohorts are summarized in Table 1. In both cohorts, mainly males were affected and the most frequent histological subtype was epithelioid. All patients in cohort 1 (n = 145) received platinum based induction chemotherapy with or without surgery. Seventy‐two patients received adjuvant radiotherapy and 80 patients received second line treatment. Cohort 2 consists of 59 patients. Forty‐five patients received intraoperative hyperthermic cisplatin following surgical removal of the specimen (Tilleman et al., 2009). Thirty‐one patients received adjuvant chemotherapy, 30 received adjuvant radiotherapy, and for three patients adjuvant therapy status was not known. Twenty‐two patients received additional treatment following disease recurrence.
Table 1.
Patient's characteristics.
| Cohort | 1 | 2 |
|---|---|---|
| Number of patients | 145 | 59 |
| Median age at diagnosis (range) | 61 (36–72) | 61 (36–77) |
| Gender | ||
| Male | 133 (92%) | 48 (81%) |
| Female | 12 (8%) | 11 (19%) |
| Induction chemotherapy | none | |
| Platinum/gemcitabine | 59 (41%) | |
| Platinum/pemetrexed | 85 (58%) | |
| Platinum/other | 1 (1%) | |
| Kind of surgery | ||
| EPP | 107 (74%) | 59 (100%) |
| P/D | 1 (1%) | |
| Palliative surgery | 23 (16%) | |
| No surgery | 14 (9%) | |
| Histological subtype | ||
| Epithelioid | 75 (64%) | 43 (73%) |
| Sarcomatoid | 5 (4%) | 2 (3%) |
| Biphasic | 38 (32%) | 14 (24%) |
| Adjuvant chemotherapy | ||
| No | 145 (100%) | 25 (42%) |
| Yes (platinum/gemcitabine) | 7 (12%) | |
| Yes (platinum/pemetrexed) | 20 (34%) | |
| Yes (unknown) | 4 (7%) | |
| Unknown | 3 (5%) | |
| Adjuvant radiotherapy | ||
| No | 70 (48%) | 26 (44%) |
| Yes | 72 (50%) | 30 (51%) |
| Unknown | 3 (2%) | 3 (5%) |
| Second line treatment | ||
| No | 53 (37%) | 22 (37%) |
| Yes | 80 (55%) | 22 (37%) |
| Unknown | 12 (8%) | 15 (25%) |
| IMIG stage | ||
| IMIG I | 10 (8%) | 1 (2%) |
| IMIG II | 30 (23%) | 7 (12%) |
| IMIG III | 72 (55%) | 34 (57%) |
| IMIG IV | 18 (14%) | 17 (29%) |
3.2. Markers expression and their association with clinical and pathological status
To establish the staining for Merlin in human formalin fixed paraffin embedded (FFPE) specimens, we generated FFPE cell blocks from two cell lines, positive (Met5A) and negative (Mero‐82) for Merlin (Supplementary Figure 1A). Immunoblotting showed that Merlin was present in both cytoplasmic and nuclear fraction of Met5A cells, whereas it was negative in Mero‐82 (Supplementary Figure 1B). By immunohistochemistry, the immunoreactivity of Merlin was also detected in both cytoplasmic and nuclear fractions of Met5A and was negative in Mero‐82 cells (Supplementary Figure 1C). Tumors derived from orthotopic implantation of rat MPM cells (IL45; Merlin positive) collected in our previous study (Meerang et al., 2015) were positively stained, mainly in the cytoplasm. Xenograft tumors, derived from a human MPM cell line negative for Merlin (ZL55), show very weak‐negative staining in both nuclear and cytoplasmic fractions (Supplementary Figure 1C). Altogether, these results implied the specificity of nuclear and cytoplasmic immunoreactivity generated by this antibody.
In human MPM specimens, Merlin immunoreactivity was also detected in both cytoplasmic and nuclear fractions (Figure 1). In cohort 1, the expression levels of nuclear and cytoplasmic Merlin were correlated (p < 0.001, r = 0.50). In the majority of MPM cases, weak‐moderate immunoreactivity of Merlin was detected in both the sub cellular fractions. A similar pattern was observed in cohort 2 of which most samples exhibited a weak cytoplasmic expression of Merlin. In addition, a correlation between nuclear and cytoplasmic Merlin was also detected (p = 0.005, r = 37). In cohort 1, for which post‐CTX tissues were available, we detected a significant decrease of post‐CTX nuclear Merlin in higher T stages (Supplementary Figure 2).
Figure 1.
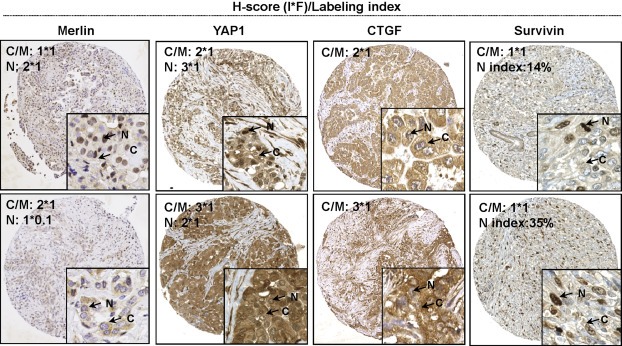
Representative immunohistochemical analysis in MPM TMAs showing low and high expression of each marker. H‐score (I*F) was applied for the quantification of cytoplasmic and nuclear Merlin, YAP1, cytoplasmic Survivin and CTGF. Staining index was only applied for nuclear Survivin. (I:Intensity, F:Frequency, N:Nucleus, C/M:Cytoplasm/Membrane).
CTGF was strongly expressed in the majority of samples assessed. No association between CTGF expression and patients' clinico‐pathological status was detected.
Survivin was expressed in >99% of patients of both cohorts. Survivin expression was present in both nuclear and cytoplasmic fractions of cells and was strongly positive in mitotic cells. Survivin was quantified as a total expression (H‐score), or labeling index (%). We detected no association between Survivin H‐score and clinical parameters. In patient cohort 1, Survivin analyzed in post‐CTX tissues of patient cohort 1 was increased in pT4 stages (Supplementary Figure 2).
YAP1 was strongly expressed in MPM tissues and showed constitutive activation (total H‐score ≥ 2 and nucleus ≥ cytoplasmic (Miyanaga et al., 2015)) in 59% of cohort 1 and in 24% of cohort 2 patients, respectively.
Correlation between marker expression in pre‐CTX tissues of patient cohort 1, is shown in Supplementary Table 2. Surprisingly, we found a moderate positive correlation between YAP1 activation (as a ratio of nuclear YAP1 to YAP1 total) with nuclear Merlin and a weak negative correlation between YAP1 activation and CTGF.
3.3. Cytoplasmic and nuclear Merlin expression are associated with clinical outcomes
Kaplan–Meier survival curves revealed an association between low cytoplasmic Merlin expression in pre‐CTX tissues and shorter OS (Figure 2A) and FFR (Figure 2B) of the patients from cohort 1. Cytoplasmic Merlin expression in post‐CTX tissues of patients from cohort 1 did not show any association with clinical outcomes. Although we observed a similar trend for low cytoplasmic Merlin being associated with shorter survival (Figure 3) in patients from cohort 2, this however did not reach statistical significance.
Figure 2.
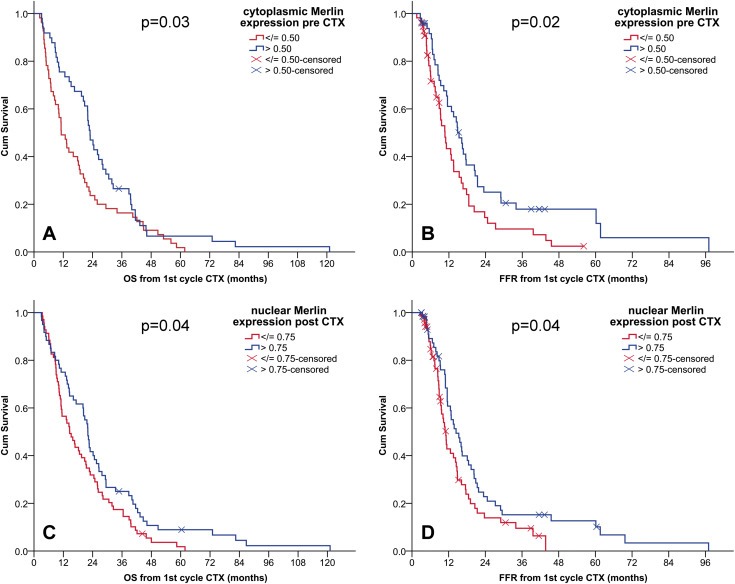
Low Merlin expression is associated with poor clinical outcome in MPM patients. Kaplan–Meier survival curves according to dichotomized expression of cytoplasmic Merlin in pre‐CTX samples (A: OS, B: FFR) and nuclear Merlin in post‐CTX samples (C: OS, D: FFR). CI, confidence interval; CTX, chemotherapy; OS, overall survival; FFR, freedom from recurrence. (A) median OS (months) (95% CI) low (n = 55): 11(8–14) vs high (n = 49): 23(20–26). (B) median FFR (months) (95% CI) low (n = 55): 11(8–13) vs high (n = 49): 15(12–18). (C) median OS (months) (95% CI) low (n = 69): 15(11–19) vs high (n = 60): 22(20–24). (D) median FFR (months) (95% CI) low (n = 69): 11(10–12) vs high (n = 60): 14(11–18).
Figure 3.
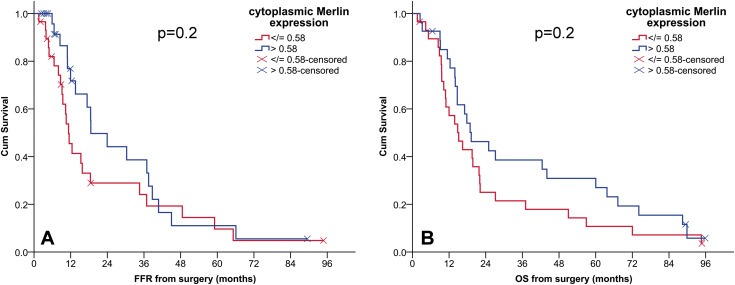
The association between cytoplasmic Merlin expression and FFR and OS in cohort 2. Kaplan–Meier survival curves according to dichotomized expression of cytoplasmic Merlin in chemo naïve samples in cohort 2. OS, overall survival; FFR, freedom from recurrence; CI, confidence interval. (A) median FFR (months) (95% CI) low (n = 29) vs high (n = 27), 11(9–14) vs19(8–30). (B) median OS (months) (95% CI) low (n = 29) vs high (n = 27), 15(9–21) vs19(9–29).
Nuclear Merlin expression levels in chemo naïve tissues from both patient cohorts were not associated with clinical outcomes. However, in cohort 1 for which post‐CTX tissues were available, we detected an association between low nuclear Merlin expression and shorter OS and FFR (Figure 2C and 2D).
3.4. Nuclear Survivin labeling index is associated with clinical outcomes in both cohorts
We observed a positive correlation between nuclear Survivin labeling index and another marker for proliferation, Ki‐67, which we have previously analyzed in the same patient cohort (Bitanihirwe et al., 2014). This correlation was present in both pre‐ (p < 0.001, r = 0.57) and post‐CTX tissue samples (p < 0.001, r = 0.32). Consistent with our previous report for Ki‐67, high nuclear Survivin labeling index in both pre‐ and post‐CTX tissues was associated with shorter FFR (Figure 4A and 4B). This is also consistent in the second cohort where nuclear Survivin labeling index was associated with FFR and OS (Figure 4C and 4D). Survivin expression quantified as H‐score did not show any association with clinical outcomes.
Figure 4.
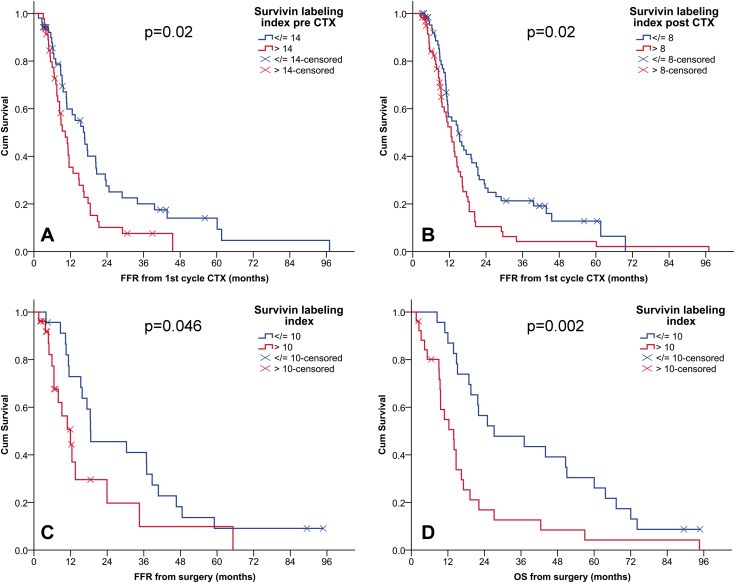
High nuclear Survivin positive index is associated with poor clinical outcome in patients from both cohorts. Kaplan–Meier survival curves according to dichotomized labeling index of nuclear Survivin, showing the association of high Survivin positive index in pre‐CTX (A) and post‐CTX (B) of cohort 1 with short FFR. Survivin positive index in chemo naïve tumors of MPM patient cohort 2 is associated with both FFR and OS (C, D). CTX, chemotherapy; OS, overall survival; FFR, freedom from recurrence; CI: confidence interval. (A) median FFR (months) (95% CI) low (n = 52): 17(12–21) vs high (n = 46): 10(8–13). (B) median FFR (months) (95% CI) low (n = 67): 15(10–19) vs high (n = 61): 13(10–15). (C) median FFR (months) (95% CI) low (n = 23): 19(4–33) vs high (n = 26): 12(7–17). (D) median OS (months) (95% CI) low (n = 23): 27(4–51) vs high (n = 26): 14(9–19).
3.5. Association between YAP1 constitutive activation and CTGF expression with clinical outcomes
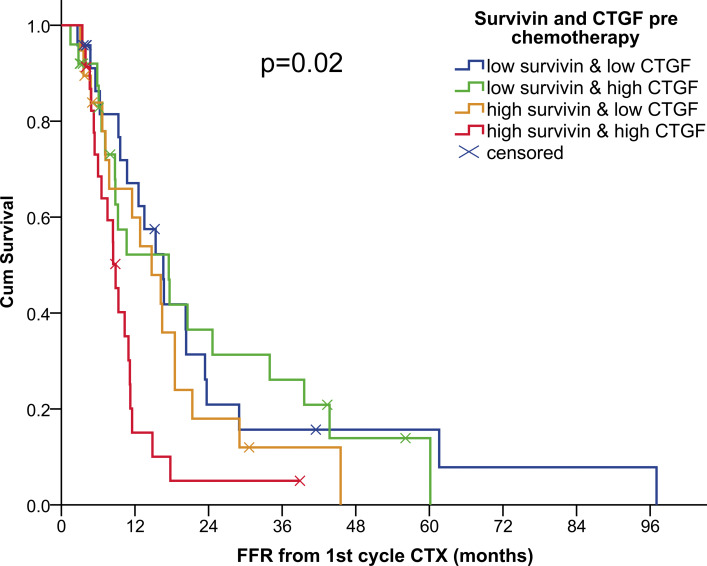
In addition to Survivin, we evaluated the activation of YAP1 and the expression of CTGF, biomarkers representing Hippo pathway alterations in our current set of TMAs. In this regard, constitutive YAP1 activation (H score ≥ 2 and nucleus ≥ cytoplasmic (Miyanaga et al., 2015)) was not associated with clinical outcomes in both cohorts of MPM patients, either analyzed in pre‐ or post‐CTX tissues. Our analysis revealed no association between CTGF expression levels with survival outcome parameters, OS and FFR, in cohort 1, thus this analysis was omitted from cohort 2. When patients were stratified based on YAP1 target gene (Survivin and CTGF) co‐expression, patients with high Survivin and high CTGF co‐expression had the worst FFR (Supplementary Figure 3).
3.6. Multivariate analysis
Multivariate analysis using the forward and backward stepwise Cox regression model included all variables that showed a significant association with OS in univariate analysis (Supplementary Table 1) (gender (male vs female), surgery type (EPP vs no EPP), pT stage (categorical: pT1 vs. pT2/pT1 vs pT3/pT1 vs pT4), pN stage (pN0 vs pN1/2), histological subtype pre‐CTX (categorical: epithelioid vs. sarcomatoid/epithelioid vs. biphasic), cytoplasmic Merlin pre‐CTX (≤0.5 vs > 0.5), nuclear Merlin post‐CTX (≤0.75 vs > 0.75)). The model revealed that: female gender, high cytoplasmic Merlin pre‐CTX expression (>0.5), epithelioid histotype and low pT stage were independent prognosticators for prolonged OS. In the multivariate analysis for FFR the following factors were included: gender (male vs female), surgery type (EPP vs no EPP), pT stage (categorical: pT1 vs. pT2/pT1 vs pT3/pT1 vs pT4), pN stage (pN0 vs pN1/2), cytoplasmic Merlin pre‐CTX (≤0.5 vs > 0.5), nuclear Merlin post‐CTX (≤0.75 vs > 0.75), nuclear Survivin labeling index pre‐CTX (≤14 vs > 14), nuclear Survivin labeling index post‐CTX (≤8 vs > 8). The analysis showed that low nuclear Survivin labeling index (≤14%), high cytoplasmic Merlin expression pre‐CTX (>0.5) and low pT stage were independent prognosticators for prolonged FFR (Table 2). Multivariate analysis including clinical, pathological factors and Survivin/CTGF co‐expression revealed independent prognostic impact of high Survivin and high CTGF co‐expression for short FFR (p < 0.001; HR: 4.00 (95% CI: 1.84–8.74). In cohort 2, nuclear Survivin labeling index and age at diagnosis are independent prognostic factors for OS. For FFR, age and gender remained as independent prognostic factors (Table 2).
Table 2.
Merlin expression levels and nuclear Survivin labeling index are independent prognosticators for clinical outcomes. Multivariate analysis (MV) of overall survival (OS) and freedom from recurrence (FFR). Parameters included in the analysis showed significant results in the univariate analysis.
| Cohort 1 | |||
|---|---|---|---|
| MV for OS | HRa | (95% CI b ) | p |
| Gender | |||
| (Male vs female) | 3.3 | (1.5–7.7) | 0.005 |
| Cytoplasmic NF2 pre‐CTX | |||
| (High expression (>0.5) vs low expression (≤0.5)) | 0.5 | (0.3–0.9) | 0.01 |
| Histological subtype pre CTX | 0.003 | ||
| Sarcomatoid vs epithelioid | 7.7 | (1.5–41.0) | 0.02 |
| Biphasic vs epithelioid | 2.1 | (1.2–3.6) | 0.006 |
| pT stage | 0.04 | ||
| pT2 vs. pT1 | 1.2 | (0.5–2.9) | 0.6 |
| pT3 vs. pT1 | 1.0 | (0.4–2.4) | 1.0 |
| pT4 vs. pT1 | 3.3 | (1.1–9.6) | 0.03 |
| MV for FFR | HR | (95% CI) | p |
| Cytoplasmic NF2 pre‐CTX | |||
| (high expression (>0.5) vs low expression (≤0.5)) | 0.5 | (0.3–1.0) | 0.04 |
| Survivin labeling index pre‐CTX | |||
| (High expression (>14%) vs low expression (≤14%)) | 3.4 | (1.7–6.8) | 0.001 |
| pT stage | 0.001 | ||
| pT2 vs. pT1 | 2.9 | (0.7–11.5) | 0.1 |
| pT3 vs. pT1 | 7.9 | (2.0–32.0) | 0.004 |
| pT4 vs. pT1 | 18.3 | (3.5–96.7) | 0.001 |
| Cohort 2 | |||
| MV for OS | HR | (95% CI) | p |
| Age at diagnosis | |||
| > 61 years vs. ≤ 61 years | 2.40 | (1.28–4.50) | 0.006 |
| Survivin labeling index | |||
| > 10 vs. ≤ 10 | 2.35 | (1.27–4.33) | 0.006 |
| MV for FFR | HR | (95% CI) | p |
| Age at diagnosis | |||
| > 61 years vs. ≤ 61 years | 2.17 | (1.06–4.42) | 0.034 |
| Gender | |||
| Male vs. female | 3.03 | (1.24–7.41) | 0.015 |
HR, hazard ratio.
CI, confidence interval.
4. Discussion
Our study uncovers the prognostic significance of low cytoplasmic levels of Merlin for a poor prognosis of MPM patients, independent of other clinical and pathological variables. Our novel data also reveal prognostic implication of nuclear Merlin when analyzed in tumor tissues of patients previously treated with chemotherapy. Immunohistochemical assessment of YAP1 activation was not associated with the patient's survival but high staining index of nuclear Survivin, one of YAP/TEAD target genes, was an independent prognostic factor for a shorter FFR. Our data was confirmed using 2 independent cohorts of MPM patients receiving different treatment regimens.
We demonstrated a significant association between low cytoplasmic Merlin expression and shorter OS as well as FFR of patients intended to be treated with induction chemotherapy followed by surgery. It remained an independent prognosticator of OS and FFR as revealed by multivariate analysis. In an independent cohort of MPM patients, more than half of whom received intrapleural cisplatin perfusion following EPP, we observed a tendency of an association between low cytoplasmic Merlin and shorter survival. The lack of statistical significance could arise from the smaller size of this patient cohort and different treatment regimens. So far as we are aware, this is the first report showing the relationship between Merlin expression and MPM clinical outcomes. Although, a recent study employing the same antibody (Lo Iacono et al., 2015) did not report prognostic significance of Merlin, the difference may stem from different immunohistochemical scoring or treatment regimens of the patients.
In this study, we also discovered the prognostic value of nuclear Merlin that has not been described in cancer so far. Nuclear Merlin represents its active and growth inhibitory fraction (Li et al., 2010). The detection of nuclear Merlin was shown to be difficult, nevertheless 2 studies employing various antibodies and fluorescent tagged‐Merlin constructs could demonstrate that Merlin is indeed localized in the nucleus of a small proportion of cells in vitro (Kressel and Schmucker, 2002; Muranen et al., 2005). In our study, the antibody against the N‐terminal epitope of Merlin generated clear nuclear staining in FFPE tumor specimens. The same clone of Merlin antibody also generated positive cytoplasmic and nuclear staining with good (73%) concordance with NF2 genomic status in Schwannoma tissues (Begnami et al., 2007). Merlin antibodies against C‐terminal epitope did not produce nuclear immunoreactivity (unpublished data). One reason explaining the lack of nuclear immunoreactivity using the antibodies against C‐terminal Merlin may stem from the closed conformation that masks the epitope. Another reason may be due to the existence of Merlin splice variants that confer different nuclear translocation capacity (Kressel and Schmucker, 2002; Thurneysen et al., 2009). Indeed, these splice variants have been detected in MPM cells (Beatrice et al., 1999). Merlin is shuttled into the nucleus during G1 phase of the cell cycle (Muranen et al., 2005). The prognostic significance of nuclear Merlin in the post chemotherapy tissues may stem from its reflection of cells halted in G1 phase; resulting from the treatment with chemotherapy. Indeed we detect reduced tumor cell proliferation in the post chemotherapy tissues of this patient cohort demonstrated by reduced nuclear Survivin labeling [paired samples analysis in 82 patients; median percentage (interquartile range); pre‐CTX, 12.75 (8.38–23.13) vs post‐CTX, 8.25 (6.46–10.44) (Wilcoxon signed rank test: p < 0.001)] and Ki‐67 indices (Bitanihirwe et al., 2014). Moreover, low nuclear Merlin in the post CTX‐tissues was associated with advanced disease stage. This may reflect the functional inactivation of Merlin during disease progression, nevertheless, this needs to be explored in further detail.
Labeling index of nuclear Survivin was associated with FFR. This marker is quite robust as it showed consistent association with FFR when analyzed in both pre‐ or post‐CTX tissues. Another recent report employing a cohort of 101 mesothelioma patients could not demonstrate prognostic impact of nuclear Survivin positive index for OS (Hmeljak et al., 2013). However, this study showed slightly but statistically significant higher Survivin expression in patients who showed response to chemotherapy compared to non‐responders. In our study, there was no difference in Survivin staining index between chemotherapy responders and non‐responders (data not shown). Of note, the median Survivin staining index was higher in Hmeljak et al. compared to our study (median Survivin staining 67% vs 14%, respectively). This difference might stem from the different staining and the quantification technique and may explain the differences regarding association of Survivin expression with response to chemotherapy between Hmeljak et al. and our study. The quantification of cytoplasmic Survivin levels by H‐score did not provide prognostic impact. This can be explained by the fact that the functional role of Survivin in cells is highly dependent on its compartmentalization. Survivin belongs to apoptosis inhibitor family proteins where its cytoplasmic and mitochondria fractions represent cytoprotective pool (Altieri, 2008). In the nucleus Survivin is one of the major components of the chromosome passenger complex that regulates spindle formation during mitosis (Altieri, 2008). The levels of Survivin were shown to peak in G2‐M phase of the cell cycle (Stauber et al., 2007) and could thus potentially reflect cells undergoing mitosis. Nuclear fraction of Survivin was predominant in a subset of cancer cells undergoing proliferation (Preusser et al., 2005). The literature contains numerous reports of Survivin expression and its association with poor clinical outcome in several human cancers, (review in (Li et al., 2005)). Although the findings are controversial, depending on the type of cancer and the analysis employed, various studies reported that nuclear Survivin expression was associated with cell proliferation, advanced disease stage and poor prognosis (eg. hepatocellular carcinoma, ovarian carcinoma). We indeed observed a positive correlation between nuclear Survivin and Ki‐67 positive index previously analyzed in our patient cohort (Bitanihirwe et al., 2014). High nuclear Survivin labeling index analyzed in the post‐CTX tissues was also associated with advanced disease stage.
Previous experimental data revealed that Hippo pathway alterations and activation of YAP1 promoted MPM cell growth (Fujii et al., 2012; Mizuno et al., 2012). Together with the recent data showing frequent alterations of Hippo pathway in MPM (Bueno et al., 2016), it is more than obvious that Hippo pathway alterations is one of the factors promoting MPM aggressiveness. This is also demonstrated in our patient cohorts where most of the specimens showed strong nuclear YAP1 expression (median H score = 2.5 (cohort 1) and 1.8 (cohort 2)) and its constitutive activation was detected in 59% of patients in cohort 1 and 24% of patients in cohort 2. The reason explaining the lack of association between YAP1 activation and clinical outcomes may stem from the small size of the cohorts used. Another scenario may be related to the requirement of more comprehensive analysis for such a complex pathway that can be regulated at multiple levels. Indeed, a recent study employed a set of 199 YAP1/TAZ/TEAD target genes expression signature to uncover a prognostic implications of the Hippo pathway in colorectal cancer (Lee et al., 2015). Thus, combined immunohistochemical expression signature of various proteins involved in this pathway network such as LATS1/2, TAZ and other Hippo pathway target genes may provide better prognostic implications.
A few hundred genes regulated by YAP were detected in MPM cells, most of them are associated with cell cycle regulation (Mizuno et al., 2012). CTGF, YAP‐TEAD target gene, was highly expressed in most of the MPM tissues but its expression was also not associated with survival outcomes. A recent study reported that CTGF was crucial for MPM growth and highly expressed in sarcomatoid compared to epithelioid subtype (Fujii et al., 2012). In our study, we could not observe any difference in the expression of CTGF when comparing the three histological types. This may stem from the limited sarcomatoid tissues of our study and the different antibodies employed. Fujji, M., et al. also demonstrated that CTGF transcription was regulated by the synergism between YAP1 and TGF‐β signaling in MPM cells (Fujii et al., 2012). While investigation of TGF‐β is beyond the scope of our study, based on the data from Fujii, we would speculate that CTGF expression in our patient cohort was influenced by TGF‐β signaling. This may explain the lack of correlation between CTGF and Survivin, which are both YAP‐TEAD target genes. High CTGF and Survivin co‐expression was associated with short FFR in our study, suggesting that high expression level of both proteins in MPM cells may increase resistance to chemotherapy.
Although our study provides novel data using 2 large independent cohorts of MPM patients, it has limitations. These include minimal number of the rare sarcomatoid subtype which may limit the power in terms of the comparison of marker expression between histotypes. The patient cohorts received different first line and second line treatments that could result in differences in prognostic impact of the biological and clinical markers. The study employed a retrospective cohort of patients, thus a confirmation using a prospective validation cohort is required. The analysis of correlation between markers using the overall expression may be insufficient to identify relationship between these markers. Cytoplasmic YAP1 expression was quite homogeneous but the nuclear (active) fraction of YAP1 was variable between cells (see Figure 1). The may suggest an ongoing dynamic of YAP1 activity in MPM cells. Thus, single cell comparison should be a better method of choice however this is not feasible for the data and the analysis we employed.
Together, these data revealed that low cytoplasmic Merlin expression and high nuclear Survivin labeling index are associated with shorter survival of MPM patients. In the light of a recent study demonstrating synthetic lethality between Merlin loss of function and the focal adhesion kinase (FAK) pathway inhibition, it might be possible to improve the survival of MPM patients with low Merlin expression by pharmacological inhibition of the FAK pathway. The aforementioned study demonstrated both in vitro and in vivo that the inhibition of FAK by a small molecule (VS‐4718) induced apoptosis and tumor growth delay preferentially in Merlin negative MPM cells (Shapiro et al., 2014). FAK inhibitors are currently being evaluated in clinical trials in patients with MPM. A clinical trial with VS‐6063 (Defactinib) for patients with resectable MPM tumor (window‐of‐opportunity; NCT02004028) also aimed to assess response biomarkers. Results from these trials are not yet available, nevertheless new therapeutic options by pharmacological inhibition of FAK may soon be established for a subgroup of MPM patients with Merlin deficiency. Treatment targeting Survivin is also feasible using direct inhibition by antisense or transcriptional repressors, or indirectly by inhibiting pathways regulating Survivin functions and expression (Altieri, 2008). Thus, these agents represent interesting treatment options which still remain to be intensively investigated for their benefit in combatting MPM. If proven successful, the expression of Merlin could help in clinical decision to identify patients with poor prognosis who could profit more from a novel targeted treatment against FAK pathway.
Supporting information
The following are the supplementary data related to this article:
Supplementary data
Supplementary data
Supplementary Figure 1 Merlin expression can be detected in the nuclear and cytoplasmic fractions of formalin fixed paraffin embedded (FFPE) specimens. A) Merlin expression status of 4 cell lines analyzed by western blotting using antibody against C‐terminal epitope (Santa Cruz, c‐18) and loading control, actin (MP Biomedicals; C4). B) Sparsely growing Met5A and Mero‐82 cells were subjected to total (T), cytoplasmic (C) and nuclear (N) protein extraction. Immunoblotting was performed for Merlin (Santa Cruz, c‐18) and loading control for nuclear and cytoplasmic fractions (LaminB1 (Abcam, ab133741) and beta‐tubulin (Abcam, ab6046), respectively). Merlin expression levels in Met5A cells were quantified as its' ratio to respective loading control of each subcellular fraction. C) FFPE sections from cell blocks of Met‐5A (transformed human mesothelial cells; Merlin positive) and Mero‐82 (human MPM cells; Merlin negative) and tumors derived from in vivo experiments (orthotopic allograft and subcutaneous xenograft implantation) using IL45 (rat MPM cells; Merlin positive) and ZL55 (human MPM cells; Merlin negative) were processed for immunohistochemical staining of Merlin (Santa Cruz, A‐19; brown) followed by nuclear counterstaining with hematoxylin (blue). All images were captured using 40X objective. (N:Nucleus, C:Cytoplasm).
Supplementary Figure 2 Merlin expression and nuclear Survivin labeling index analyzed in post‐CTX samples of cohort 1 are associated with pT stage: Box plot of marker expression across different pT stages A) The expression of nuclear Merlin is significantly lower in pT3 and pT4 compared to pT1. B) Survivin positive index is significantly increased in pT4 compared to pT2 and pT3. (Mann Whitney U test). CTX, chemotherapy.
Supplementary Figure 3 High co‐expression of Survivin and CTGF in pre‐chemotherapy tissues was associated with poor FFR. Kaplan–Meier survival curves according to co‐expression of Survivin positive index and CTGF expression in pre‐CTX samples (Survivin/CTGF: Low/Low, Low/High, High/Low and High/High). CI, confidence interval; CTX, chemotherapy; FFR, freedom from recurrence. Median FFR (months) (95% CI): Low/Low (n = 24): 17 (12–21). Low/High (n = 25): 18 (6–29). High/Low (n = 19): 15 (9–21). High/High (n = 23): 9 (7–11).
Acknowledgments
The present study was supported by Krebsliga Zürich, the Swiss National Science Foundation grants (grant number: PP00P3_159269), and matching funds from the University of Zürich to Prof. Dr. Isabelle Opitz. We thank Martina Storz for the excellent technical assistance with TMA construction and immunohistochemistry. We are also indebted to Dr. Chloé Spichiger for her editorial assistance in the preparation of the manuscript and Dr. Michaela Kirschner for critically reading the manuscript. We thank Dr. Sandra Tomaszek and Dr. Olivia Lauk for providing us with ZL55 xenograft sample. We extend our thanks to the following Institutes of Pathology for providing archival paraffin blocks: University Hospital Bern (Prof. Perren), University Hospital Basel (Prof. Bubendorf), Cantonal Hospital St. Gallen (Prof. W. Jochum), Cantonal Hospital Luzern (Prof. J. Diebold), City Hospital Triemli (Prof. P. Komminoth), Cantonal Hospital Aarau (Prof. Grobholz), Cantonal Hospital Baden (Prof. G. Singer), Cantonal Hospital Winterthur (Dr. R. Flury).
Supplementary data 1.
1.1.
Supplementary data related to this article can be found at http://dx.doi.org/10.1016/j.molonc.2016.06.005.
Meerang Mayura, Bérard Karima, Friess Martina, Bitanihirwe Byron K.Y., Soltermann Alex, Vrugt Bart, Felley-Bosco Emanuela, Bueno Raphael, Richards William G., Seifert Burkhardt, Stahel Rolf, Weder Walter, Opitz Isabelle, (2016), Low Merlin expression and high Survivin labeling index are indicators for poor prognosis in patients with malignant pleural mesothelioma, Molecular Oncology, 10, doi: 10.1016/j.molonc.2016.06.005.
References
- Altieri, D.C. , 2008. Survivin, cancer networks and pathway-directed drug discovery. Nat. Rev. Cancer 8, 61–70. [DOI] [PubMed] [Google Scholar]
- Bao, Y. , Hata, Y. , Ikeda, M. , Withanage, K. , 2011. Mammalian Hippo pathway: from development to cancer and beyond. J. Biochem. 149, 361–379. [DOI] [PubMed] [Google Scholar]
- Beatrice, S. , Yong, T. , Michael, K. , 1999. Novel alternatively spliced isoforms of the neurofibromatosis type 2 tumor suppressor are targeted to the nucleus and cytoplasmic granules. Hum. Mol. Genet. 8, 1561–1570. [DOI] [PubMed] [Google Scholar]
- Begnami, M.D. , Palau, M. , Rushing, E.J. , Santi, M. , Quezado, M. , 2007. Evaluation of NF2 gene deletion in sporadic schwannomas, meningiomas, and ependymomas by chromogenic in situ hybridization. Hum. Pathol. 38, 1345–1350. [DOI] [PMC free article] [PubMed] [Google Scholar]
- Bitanihirwe, B.K. , Meerang, M. , Friess, M. , Soltermann, A. , Frischknecht, L. , Thies, S. , Felley-Bosco, E. , Tsao, M.S. , Allo, G. , de Perrot, M. , Seifert, B. , Moch, H. , Stahel, R. , Weder, W. , Opitz, I. , 2014. PI3K/mTOR signaling in mesothelioma patients treated with induction chemotherapy followed by extrapleural pneumonectomy. J. Thorac. Oncol. 9, 239–247. [DOI] [PubMed] [Google Scholar]
- Bott, M. , Brevet, M. , Taylor, B.S. , Shimizu, S. , Ito, T. , Wang, L. , Creaney, J. , Lake, R.A. , Zakowski, M.F. , Reva, B. , Sander, C. , Delsite, R. , Powell, S. , Zhou, Q. , Shen, R. , Olshen, A. , Rusch, V. , Ladanyi, M. , 2011. The nuclear deubiquitinase BAP1 is commonly inactivated by somatic mutations and 3p21.1 losses in malignant pleural mesothelioma. Nat. Genet. 43, 668–672. [DOI] [PMC free article] [PubMed] [Google Scholar]
- Bueno, R. , Stawiski, E.W. , Goldstein, L.D. , Durinck, S. , De Rienzo, A. , Modrusan, Z. , Gnad, F. , Nguyen, T.T. , Jaiswal, B.S. , Chirieac, L.R. , Sciaranghella, D. , Dao, N. , Gustafson, C.E. , Munir, K.J. , Hackney, J.A. , Chaudhuri, A. , Gupta, R. , Guillory, J. , Toy, K. , Ha, C. , Chen, Y.J. , Stinson, J. , Chaudhuri, S. , Zhang, N. , Wu, T.D. , Sugarbaker, D.J. , de Sauvage, F.J. , Richards, W.G. , Seshagiri, S. , 2016. Comprehensive genomic analysis of malignant pleural mesothelioma identifies recurrent mutations, gene fusions and splicing alterations. Nat. Genet. 48, 407–416. [DOI] [PubMed] [Google Scholar]
- Evans, D.G. , Huson, S.M. , Donnai, D. , Neary, W. , Blair, V. , Newton, V. , Harris, R. , 1992. A clinical study of type 2 neurofibromatosis. Q. J. Med. 84, 603–618. [PubMed] [Google Scholar]
- Flejter, W.L. , Li, F.P. , Antman, K.H. , Testa, J.R. , 1989. Recurring loss involving chromosomes 1, 3, and 22 in malignant mesothelioma: possible sites of tumor suppressor genes. Genes Chromosomes Cancer 1, 148–154. [DOI] [PubMed] [Google Scholar]
- Fujii, M. , Toyoda, T. , Nakanishi, H. , Yatabe, Y. , Sato, A. , Matsudaira, Y. , Ito, H. , Murakami, H. , Kondo, Y. , Kondo, E. , Hida, T. , Tsujimura, T. , Osada, H. , Sekido, Y. , 2012. TGF-beta synergizes with defects in the Hippo pathway to stimulate human malignant mesothelioma growth. J. Exp. Med. 209, 479–494. [DOI] [PMC free article] [PubMed] [Google Scholar]
- Hinterberger, M. , Reineke, T. , Storz, M. , Weder, W. , Vogt, P. , Moch, H. , 2007. D2-40 and calretinin – a tissue microarray analysis of 341 malignant mesotheliomas with emphasis on sarcomatoid differentiation. Mod. Pathol. 20, 248–255. [DOI] [PubMed] [Google Scholar]
- Hmeljak, J. , Erculj, N. , Dolzan, V. , Pizem, J. , Kern, I. , Kovac, V. , Cemazar, M. , Cor, A. , 2013. Is survivin expression prognostic or predictive in malignant pleural mesothelioma?. Virchows Arch. 462, 315–321. [DOI] [PubMed] [Google Scholar]
- James, M.F. , Han, S. , Polizzano, C. , Plotkin, S.R. , Manning, B.D. , Stemmer-Rachamimov, A.O. , Gusella, J.F. , Ramesh, V. , 2009. NF2/merlin is a novel negative regulator of mTOR complex 1, and activation of mTORC1 is associated with meningioma and schwannoma growth. Mol. Cell. Biol. 29, 4250–4261. [DOI] [PMC free article] [PubMed] [Google Scholar]
- Kressel, M. , Schmucker, B. , 2002. Nucleocytoplasmic transfer of the NF2 tumor suppressor protein merlin is regulated by exon 2 and a CRM1-dependent nuclear export signal in exon 15. Hum. Mol. Genet. 11, 2269–2278. [DOI] [PubMed] [Google Scholar]
- Lee, K.W. , Lee, S.S. , Kim, S.B. , Sohn, B.H. , Lee, H.S. , Jang, H.J. , Park, Y.Y. , Kopetz, S. , Kim, S.S. , Oh, S.C. , Lee, J.S. , 2015. Significant association of oncogene YAP1 with poor prognosis and cetuximab resistance in colorectal cancer patients. Clin. Cancer Res. 21, 357–364. [DOI] [PMC free article] [PubMed] [Google Scholar]
- Li, F. , Yang, J. , Ramnath, N. , Javle, M.M. , Tan, D. , 2005. Nuclear or cytoplasmic expression of survivin: what is the significance?. Int. J. Cancer 114, 509–512. [DOI] [PMC free article] [PubMed] [Google Scholar]
- Li, W. , Cooper, J. , Karajannis, M.A. , Giancotti, F.G. , 2012. Merlin: a tumour suppressor with functions at the cell cortex and in the nucleus. EMBO Rep. 13, 204–215. [DOI] [PMC free article] [PubMed] [Google Scholar]
- Li, W. , Cooper, J. , Zhou, L. , Yang, C. , Erdjument-Bromage, H. , Zagzag, D. , Snuderl, M. , Ladanyi, M. , Hanemann, C.O. , Zhou, P. , Karajannis, M.A. , Giancotti, F.G. , 2014. Merlin/NF2 loss-driven tumorigenesis linked to CRL4(DCAF1)-mediated inhibition of the Hippo pathway kinases Lats1 and 2 in the nucleus. Cancer Cell 26, 48–60. [DOI] [PMC free article] [PubMed] [Google Scholar]
- Li, W. , You, L. , Cooper, J. , Schiavon, G. , Pepe-Caprio, A. , Zhou, L. , Ishii, R. , Giovannini, M. , Hanemann, C.O. , Long, S.B. , Erdjument-Bromage, H. , Zhou, P. , Tempst, P. , Giancotti, F.G. , 2010. Merlin/NF2 suppresses tumorigenesis by inhibiting the E3 ubiquitin ligase CRL4(DCAF1) in the nucleus. Cell 140, 477–490. [DOI] [PMC free article] [PubMed] [Google Scholar]
- Lo Iacono, M. , Monica, V. , Righi, L. , Grosso, F. , Libener, R. , Vatrano, S. , Bironzo, P. , Novello, S. , Musmeci, L. , Volante, M. , Papotti, M. , Scagliotti, G.V. , 2015. Targeted next-generation sequencing of cancer genes in advanced stage malignant pleural mesothelioma: a retrospective study. J. Thorac. Oncol. 10, 492–499. [DOI] [PubMed] [Google Scholar]
- Meerang, M. , Boss, A. , Kenkel, D. , Broggini-Tenzer, A. , Berard, K. , Lauk, O. , Arni, S. , Weder, W. , Opitz, I. , 2015. Evaluation of imaging techniques for the assessment of tumour progression in an orthotopic rat model of malignant pleural mesothelioma. Eur J Cardiothorac Surg. 47, e34–e41. [DOI] [PubMed] [Google Scholar]
- Miyanaga, A. , Masuda, M. , Tsuta, K. , Kawasaki, K. , Nakamura, Y. , Sakuma, T. , Asamura, H. , Gemma, A. , Yamada, T. , 2015. Hippo pathway gene mutations in malignant mesothelioma: revealed by RNA and targeted exon sequencing. J. Thorac. Oncol. 10, 844–851. [DOI] [PubMed] [Google Scholar]
- Mizuno, T. , Murakami, H. , Fujii, M. , Ishiguro, F. , Tanaka, I. , Kondo, Y. , Akatsuka, S. , Toyokuni, S. , Yokoi, K. , Osada, H. , Sekido, Y. , 2012. YAP induces malignant mesothelioma cell proliferation by upregulating transcription of cell cycle-promoting genes. Oncogene 31, 5117–5122. [DOI] [PubMed] [Google Scholar]
- Murakami, H. , Mizuno, T. , Taniguchi, T. , Fujii, M. , Ishiguro, F. , Fukui, T. , Akatsuka, S. , Horio, Y. , Hida, T. , Kondo, Y. , Toyokuni, S. , Osada, H. , Sekido, Y. , 2011. LATS2 is a tumor suppressor gene of malignant mesothelioma. Cancer Res. 71, 873–883. [DOI] [PubMed] [Google Scholar]
- Muranen, T. , Gronholm, M. , Renkema, G.H. , Carpen, O. , 2005. Cell cycle-dependent nucleocytoplasmic shuttling of the neurofibromatosis 2 tumour suppressor merlin. Oncogene 24, 1150–1158. [DOI] [PubMed] [Google Scholar]
- Opitz, I. , Friess, M. , Kestenholz, P. , Schneiter, D. , Frauenfelder, T. , Nguyen-Kim, D.L. , Seifert, B. , Hoda, M.A. , Klepetko, W. , Stahel, R.A. , Weder, W. , 2015. A new prognostic score supporting treatment allocation for multimodality therapy for malignant pleural mesothelioma – a review of 12 years' experience. J. Thorac. Oncol. 10, 1634–1641. [DOI] [PubMed] [Google Scholar]
- Pan, D. , 2010. The hippo signaling pathway in development and cancer. Dev. Cell 19, 491–505. [DOI] [PMC free article] [PubMed] [Google Scholar]
- Park, E.K. , Takahashi, K. , Hoshuyama, T. , Cheng, T.J. , Delgermaa, V. , Le, G.V. , Sorahan, T. , 2011. Global magnitude of reported and unreported mesothelioma. Environ. Health Perspect. 119, 514–518. [DOI] [PMC free article] [PubMed] [Google Scholar]
- Peto, J. , Decarli, A. , La Vecchia, C. , Levi, F. , Negri, E. , 1999. The European mesothelioma epidemic. Br. J. Cancer 79, 666–672. [DOI] [PMC free article] [PubMed] [Google Scholar]
- Preusser, M. , Wolfsberger, S. , Czech, T. , Slavc, I. , Budka, H. , Hainfellner, J.A. , 2005. Survivin expression in intracranial ependymomas and its correlation with tumor cell proliferation and patient outcome. Am. J. Clin. Pathol. 124, 543–549. [DOI] [PubMed] [Google Scholar]
- Robinson, B.M. , 2012. Malignant pleural mesothelioma: an epidemiological perspective. Ann. Cardiothorac. Surg. 1, 491–496. [DOI] [PMC free article] [PubMed] [Google Scholar]
- Rouleau, G.A. , Merel, P. , Lutchman, M. , Sanson, M. , Zucman, J. , Marineau, C. , Hoang-Xuan, K. , Demczuk, S. , Desmaze, C. , Plougastel, B. , 1993. Alteration in a new gene encoding a putative membrane-organizing protein causes neuro-fibromatosis type 2. Nature 363, 515–521. [DOI] [PubMed] [Google Scholar]
- Saucedo, L.J. , Edgar, B.A. , 2007. Filling out the Hippo pathway. Nat. Rev. Mol. Cell Biol. 8, 613–621. [DOI] [PubMed] [Google Scholar]
- Shapiro, I.M. , Kolev, V.N. , Vidal, C.M. , Kadariya, Y. , Ring, J.E. , Wright, Q. , Weaver, D.T. , Menges, C. , Padval, M. , McClatchey, A.I. , Xu, Q. , Testa, J.R. , Pachter, J.A. , 2014. Merlin deficiency predicts FAK inhibitor sensitivity: a synthetic lethal relationship. Sci. Transl. Med. 6, 237ra268 [DOI] [PMC free article] [PubMed] [Google Scholar]
- Sidi, R. , Pasello, G. , Opitz, I. , Soltermann, A. , Tutic, M. , Rehrauer, H. , Weder, W. , Stahel, R.A. , Felley-Bosco, E. , 2011. Induction of senescence markers after neo-adjuvant chemotherapy of malignant pleural mesothelioma and association with clinical outcome: an exploratory analysis. Eur. J. Cancer 47, 326–332. [DOI] [PubMed] [Google Scholar]
- Stahel, R.A. , Weder, W. , Felley-Bosco, E. , Petrausch, U. , Curioni-Fontecedro, A. , Schmitt-Opitz, I. , Peters, S. , 2015. Searching for targets for the systemic therapy of mesothelioma. Ann. Oncol. 26, 1649–1660. [DOI] [PubMed] [Google Scholar]
- Stauber, R.H. , Mann, W. , Knauer, S.K. , 2007. Nuclear and cytoplasmic survivin: molecular mechanism, prognostic, and therapeutic potential. Cancer Res. 67, 5999–6002. [DOI] [PubMed] [Google Scholar]
- Thurneysen, C. , Opitz, I. , Kurtz, S. , Weder, W. , Stahel, R.A. , Felley-Bosco, E. , 2009. Functional inactivation of NF2/merlin in human mesothelioma. Lung Cancer 64, 140–147. [DOI] [PubMed] [Google Scholar]
- Tilleman, T.R. , Richards, W.G. , Zellos, L. , Johnson, B.E. , Jaklitsch, M.T. , Mueller, J. , Yeap, B.Y. , Mujoomdar, A.A. , Ducko, C.T. , Bueno, R. , Sugarbaker, D.J. , 2009. Extrapleural pneumonectomy followed by intracavitary intraoperative hyperthermic cisplatin with pharmacologic cytoprotection for treatment of malignant pleural mesothelioma: a phase II prospective study. J. Thorac. Cardiovasc. Surg. 138, 405–411. [DOI] [PubMed] [Google Scholar]
- van Meerbeeck, J.P. , Scherpereel, A. , Surmont, V.F. , Baas, P. , 2011. Malignant pleural mesothelioma: the standard of care and challenges for future management. Crit. Rev. Oncol. Hematol. 78, 92–111. [DOI] [PubMed] [Google Scholar]
- Weder, W. , Opitz, I. , 2012. Multimodality therapy for malignant pleural mesothelioma. Ann. Cardiothorac. Surg. 1, 502–507. [DOI] [PMC free article] [PubMed] [Google Scholar]
- Zhao, B. , Ye, X. , Yu, J. , Li, L. , Li, W. , Li, S. , Lin, J.D. , Wang, C.Y. , Chinnaiyan, A.M. , Lai, Z.C. , Guan, K.L. , 2008. TEAD mediates YAP-dependent gene induction and growth control. Genes Dev. 22, 1962–1971. [DOI] [PMC free article] [PubMed] [Google Scholar]
Associated Data
This section collects any data citations, data availability statements, or supplementary materials included in this article.
Supplementary Materials
The following are the supplementary data related to this article:
Supplementary data
Supplementary data
Supplementary Figure 1 Merlin expression can be detected in the nuclear and cytoplasmic fractions of formalin fixed paraffin embedded (FFPE) specimens. A) Merlin expression status of 4 cell lines analyzed by western blotting using antibody against C‐terminal epitope (Santa Cruz, c‐18) and loading control, actin (MP Biomedicals; C4). B) Sparsely growing Met5A and Mero‐82 cells were subjected to total (T), cytoplasmic (C) and nuclear (N) protein extraction. Immunoblotting was performed for Merlin (Santa Cruz, c‐18) and loading control for nuclear and cytoplasmic fractions (LaminB1 (Abcam, ab133741) and beta‐tubulin (Abcam, ab6046), respectively). Merlin expression levels in Met5A cells were quantified as its' ratio to respective loading control of each subcellular fraction. C) FFPE sections from cell blocks of Met‐5A (transformed human mesothelial cells; Merlin positive) and Mero‐82 (human MPM cells; Merlin negative) and tumors derived from in vivo experiments (orthotopic allograft and subcutaneous xenograft implantation) using IL45 (rat MPM cells; Merlin positive) and ZL55 (human MPM cells; Merlin negative) were processed for immunohistochemical staining of Merlin (Santa Cruz, A‐19; brown) followed by nuclear counterstaining with hematoxylin (blue). All images were captured using 40X objective. (N:Nucleus, C:Cytoplasm).
Supplementary Figure 2 Merlin expression and nuclear Survivin labeling index analyzed in post‐CTX samples of cohort 1 are associated with pT stage: Box plot of marker expression across different pT stages A) The expression of nuclear Merlin is significantly lower in pT3 and pT4 compared to pT1. B) Survivin positive index is significantly increased in pT4 compared to pT2 and pT3. (Mann Whitney U test). CTX, chemotherapy.
Supplementary Figure 3 High co‐expression of Survivin and CTGF in pre‐chemotherapy tissues was associated with poor FFR. Kaplan–Meier survival curves according to co‐expression of Survivin positive index and CTGF expression in pre‐CTX samples (Survivin/CTGF: Low/Low, Low/High, High/Low and High/High). CI, confidence interval; CTX, chemotherapy; FFR, freedom from recurrence. Median FFR (months) (95% CI): Low/Low (n = 24): 17 (12–21). Low/High (n = 25): 18 (6–29). High/Low (n = 19): 15 (9–21). High/High (n = 23): 9 (7–11).