

Abstract
1. Background
The tumour suppressor p53 is a central player in transcription regulation and cell fate determination. By interacting with p53 and altering its sequence‐specific binding to the response elements, the hepatitis B virus X protein (HBx) was reported to re‐direct p53 regulation of some genes.
2. Results
Coupling massively parallel deep sequencing with p53 chromatin immunoprecipitation, we demonstrate that HBx modulates global p53 site selection and that this was strongly influenced by altered interaction with transcription co‐factors/co‐regulators as well as post‐translational modifications. Specifically, HBx attenuated p53‐TBP‐RB1 transcription complex recruitment and interaction and this was associated with hyper‐phosphorylation of p53 at serine 315 by HBx. Concurrently, HBx enhanced p53 DNA occupancy to other response elements either alone by displacing specific transcription factors such as CEBPB and NFkB1, or in complex with distinct interacting co‐factors Sp1, JUN and E2F1. Importantly, re‐wiring of p53 transcription regulation by HBx was linked to the deregulation of genes involved in cell proliferation and death, suggesting a role of HBx in errant cell fate determination mediated by altered p53 site selection of target genes.
3. Conclusions
Our study thus presents first evidence of global modes of p53 transcription alteration by HBx and provides new insights to understand and potentially curtail the viral oncoprotein.
Keywords: P53 transcription, HBx, ChIP-Seq, Phosphorylation, p53 serine 315
Highlights
HBx deregulates p53 genes by modulating global p53 site selection.
HBx modulates p53 genes by altering its interaction with transcription cofactors.
HBx modulates p53 genes through post‐translational modifications.
HBx rewires p53 transcription to deregulate proliferation and death genes.
Abbreviations
- ChIP
chromatin immunoprecipitation
- HBx
hepatitis B virus X protein
- IPA
ingenuity pathway analysis
- LC-MS/MS
liquid chromatography-tandem mass spectrometry
- MS
mass spectrometry
- PLA
proximity ligation assay
- qPCR
quantitative real time polymerase chain reaction
- Seq
high throughput sequencing
1. Introduction
The p53 tumour suppressor is a sequence‐specific transcription factor that governs gene regulation (Lane, 1992). Its prominence as the ‘guardian of the genome’ underscores the key role of p53 in determining the appropriate cell fate in response to various cell stressors – limiting the propagation of damaged DNA by arresting the cell and initiating repair of the damaged DNA or eliminating the cell by programmed cell death if the damage is irreparable (Levine, 1997; Jackson et al., 2011; Riley et al., 2008). Although it is not fully understood how p53 decides cell fate, it directs regulation of its target genes through binding to its motif consisting of two cognate half‐sites 5′‐RRRCWWGYYY‐3′ where R denotes a purine (adenine or guanine, A/G), Y denotes a pyrimidine (cytosine or thymine, C/T) and W denotes A/T, separated by a DNA spacer sequence of varying lengths (0–13 bases) (Menendez et al., 2009; el‐Deiry et al., 1992). The intrinsic degeneracy of the p53 motif eludes to additional factors that can fine tune p53 site selection including the interaction of p53 with other transcription partners or cofactors in transcription complexes (Farmer et al., 1996), post‐translational modifications of the p53 protein (Gu and Roeder, 1997; Luo et al., 2004; Chuikov et al., 2004) and the accessibility of the p53 binding site that may be influenced by gross chromatin structure (Li et al., 2007). The intricate dynamics of these factors dictate appropriate spatial and temporal selection of p53 for specific DNA binding sites of selected classes of target genes to elicit a specific cellular response.
Viral proteins are known to modulate the function of p53 and are thought to be key ways by which viruses facilitate neoplastic transformation. For instance, the human papillomavirus E7 protein and adenovirus E1A protein inhibit p53 transcriptional activity (Massimi and Banks, 1997; Somasundaram and El‐Deiry, 1997). Hepatitis B virus X protein (HBx), a small 17kD transcription cofactor that is strongly implicated in hepatitis B virus (HBV)‐associated hepatocellular carcinoma (HCC) has been reported to interact with p53 and alter the recruitment of p53 to its binding sites (Truant et al., 1995; Wang et al., 1994; Chung et al., 2003; Chan et al., 2013; Lee et al., 2005). We and others have found that HBx abolished as well as enhanced p53‐DNA binding at distinct binding sites of p53 target genes such as p53‐regulated apoptosis inducing protein 1 p53AIP1, phosphatase and tensin homologue (PTEN) and excision repair cross‐complementation group 3 (ERCC3) (Chan et al., 2013; Truant et al., 1995; Wang et al., 1994; Chung et al., 2003; Ogden et al., 2000). Importantly, these studies demonstrated that altered p53 site selection by the viral X protein resulted in aberrant expression of target genes, underscoring the biological relevance of HBx‐induced p53 transcription deregulation. As tightly coordinated regulation of p53 is central to the regulation of critical cellular processes, viral‐induced aberrant p53 transcription will plausibly disrupt the maintenance of cellular integrity.
To date, studies investigating the modulation of p53 site selection by HBx have been limited to either a single gene of interest or array‐specific promoter regions of genes. However, the increasing number of novel functional p53 binding sites discovered as well as the finding that these can reside outside of the typical gene promoter region underscores the importance of understanding global p53 transcription deregulation by HBx (Wei et al., 2006; Smeenk et al., 2008; Nikulenkov et al., 2012). In this study, we therefore sought to obtain a comprehensive genome‐wide profile of deregulated p53 transcription complex‐DNA binding by the viral X protein using massively parallel deep sequencing coupled to p53 chromatin immunoprecipitation (ChIP‐Seq) on HBx‐expressing and control HepG2 liver cell culture model system previously developed in our lab. P53‐associated transcription complex maps were subsequently constructed by systematic characterization of in silico‐predicted p53 transcription co‐factors/co‐regulators. Here, we report distinct patterns of global HBx‐altered p53 transcription complex recruitment: HBx attenuated p53‐TBP/TFAP2A‐RB1 transcription complex‐DNA binding but enhanced p53‐Sp1/JUN/E2F1 binding to DNA. Additionally, HBx induced a switch in transcription factor binding preference from NFkB1/CEBPB to p53 in a subset of binding sites. Mechanistically, we found that HBx‐attenuated p53‐TBP‐RB1 recruitment was specifically associated with hyper‐phosphorylation of p53 serine 315 (S315), highlighting the convergence of multiple levels of p53 modulation on transcription regulation by the viral X protein. Together, these findings provide a paradigm that reveals the complex interaction of p53 transcription partners and post‐translational modifications that underpin altered p53 site selection and transcription regulation by the viral X protein.
2. Results
2.1. Global p53 occupancy is altered in the presence of HBx
The viral X protein modulates p53‐DNA binding. To obtain a comprehensive genome‐wide profile of deregulated p53‐DNA binding by HBx, p53 ChIP‐Seq was performed on HBx‐expressing and control HepG2 liver cell culture model system previously developed in our lab (Figure 1A) (Lee et al., 2005).
Figure 1.
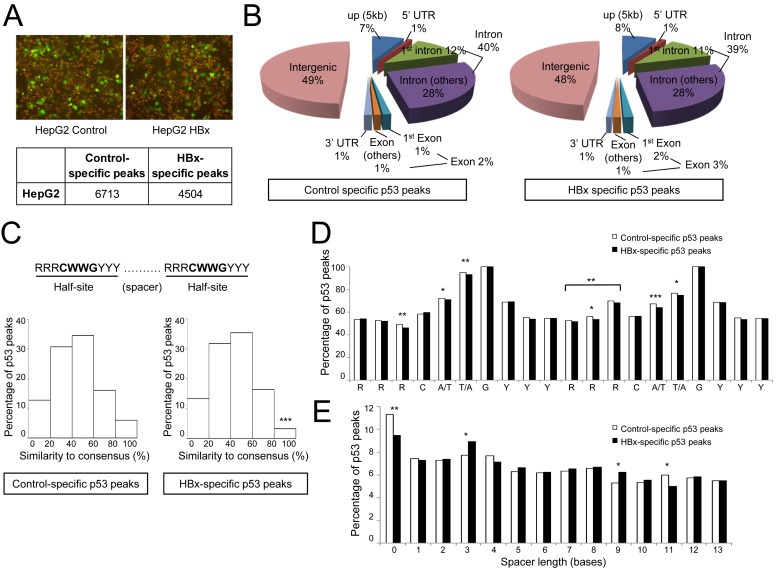
HBx confers p53 a preference for less conserved response elements. (A) Control and HBx‐expressing HepG2 cells employed for ChIP‐Seq and expression profiling (upper panel). UV‐treated HepG2 cells successfully transduced with either control or HBx‐expressing recombinant adenovirus harbouring the GFP gene. Comparable high levels of HBx and control adenovirus transduction efficiencies were achieved as seen from the green fluorescing cells. Number of ChIP‐Seq control‐ and HBx‐specific peaks containing a p53MH‐predicted p53 motif is tabulated (lower panel). (B) Genomic distribution of control‐ and HBx‐specific p53 peaks using criteria detailed in Experimental procedures. (C) Illustration of the p53 consensus sequence comprising two half‐sites, where R denotes purine, Y denotes pyrimidine and W denotes A/T (top). Distribution of p53 peaks based on their similarity to the consensus sequence, in 20% intervals (bottom). (D and E) Distribution of p53 peaks according to the p53 motif position‐specific bases (D) and spacer lengths (E). Statistically significant findings are denoted as *p < 0.05, **p < 0.01 and ***p < 0.001.
To examine the patterns of altered p53 binding site selection, only ChIP‐Seq peaks exclusive to either control or HBx dataset was retained for further analysis, while those common to both conditions (approximately 2500 peaks) were removed. To further obtain high confidence control‐ and HBx‐specific p53 binding sites, control‐ and HBx‐specific peaks were probed for the presence of the p53 motif using p53MH – an algorithm that permits versatile identification of potential p53 motifs with varying degrees of conservation. This was done to avoid the premature elimination of potential p53 binding sites from our analysis that may exhibit low sequence identity to the consensus motif. Indeed, ChIP‐qPCR validation of at least 40 randomly chosen control‐ and HBx‐specific p53 peaks from our dataset confirmed that p53 bound to less conserved p53 response elements as well (Figure S1 in Supplementary file 1), validating our p53 peak‐identification strategy. In total, HBx abolished p53 binding to 6713 distinct sites (termed ‘control‐specific p53 peaks’) and enhanced p53 binding to another 4504 distinct sites (termed ‘HBx‐specific p53 peaks’) as identified from the p53 ChIP‐Seq dataset and used for subsequent analysis here (Figure 1A).
Further interrogation of the alterations in global p53‐DNA binding by HBx revealed several interesting patterns. First, the distribution of p53‐DNA binding events across the functional regions of the genome as well as across chromosomes was comparable in the presence or absence of HBx, indicating that any gross alterations at the chromosome level were unlikely to have influenced HBx‐altered p53‐DNA binding (Figure 1B). Second, examination of the p53 motifs of control‐ and HBx‐specific p53 peaks revealed a preference for less conserved p53 motifs in the presence of HBx. This was evidenced by a lower proportion of HBx‐specific p53 peaks containing highly conserved p53 motifs (80–100% overall similarity to the consensus sequence) compared to control‐specific p53 peaks (Figure 1C). Upon closer examination of the composition of the p53 motifs, HBx‐specific p53 peaks showed a greater deviation of base distribution from the consensus sequence (Figure 1D). Specifically, the core A/T and T/A (positions 5 and 6) of both half‐sites as well as at the flanking nucleotides at positions 3 (first half‐site) and 2 (second half‐site) was significantly less conserved in HBx‐specific p53 peaks compared to the control (Figure 1D). Notably, the triple purine sequence flanking the core sequence of the second half‐site was similarly less conserved in HBx‐specific p53 peaks (Figure 1D). Third, the preference for less conserved p53 motifs was evident in the lower proportion of HBx‐specific p53 peaks without an intervening spacer, which is associated with a well‐conserved p53 motif (Figure 1E). Taken together, genome‐wide profiling of HBx‐altered p53‐DNA binding patterns revealed a greater capacity of p53 to bind to less conserved p53 motifs in the presence of HBx.
2.2. HBx attenuates recruitment of P53‐TBP/TFAP2A‐RB1 transcription complexes to DNA
P53 recruitment to DNA can be influenced by association with other transcription factors. The interplay of sequence‐specific transcription factors and subsequently‐recruited transcription co‐regulators that do not bind DNA directly typically work together in transcription complexes. We had previously demonstrated that p53 forms distinct transcription complexes in the presence of HBx, switching from a transcriptionally repressive p53‐YY1‐GATA1‐HDAC1 complex to a transcriptionally activating p53‐Sp1‐PCAF complex to direct HBx‐induced p53‐regulated apoptosis‐inducing protein 1 (p53AIP1) transcription (Chan et al., 2013).
To identify global perturbations of p53‐associated transcription complexes by HBx, a complementary two‐pronged in silio approach was employed (Figure 2A). In the first approach, potential p53‐associated sequence‐specific transcription factors were identified by probing control‐ and HBx‐specific p53 peaks for co‐enriched transcription factors using CENTDIST, and this predicted shortlist was then further queried using GeneMANIA association network tool to identify other associated factors including non‐DNA‐binding transcription co‐regulators (Figure S2A in Supplementary file 1). In the second approach, significantly (p < 0.01) deregulated genes identified from expression profiling of control and HBx‐expressing HepG2 cells were queried for potential upstream regulators (that included both transcription co‐factors and co‐regulators) using Ingenuity Pathway Analysis (IPA) (Figure S2B in Supplementary file 1). Transcription factors and co‐regulators predicted by both approaches were considered as high confidence p53‐associated factors and are shown in Figure 2A. TATA‐box‐binding protein (TBP) and co‐regulator, retinoblastoma‐associated protein (RB1) were over‐represented exclusively in the absence of HBx; early growth response protein 1 (EGR1), CCAAT/enhancer‐binding protein beta (CEBPβ) and nuclear factor NF‐kappa‐B p105 subunit (NFkB1) and co‐regulator, CREB‐binding protein (CBP) were over‐represented exclusively in the presence of HBx; while transcription factors E2F1, AP‐1 (JUN), Sp1 and AP‐2‐alpha (TFAP2A) were found to be over‐represented in both conditions (Figure 2A,B). We then proceeded to further examine the above‐mentioned protein factors, except for EGR1 due to the very low frequency (1.1%) of EGR1 motif co‐enrichment (Figure 2B) and the lack of good antibodies for experimental validation.
Figure 2.
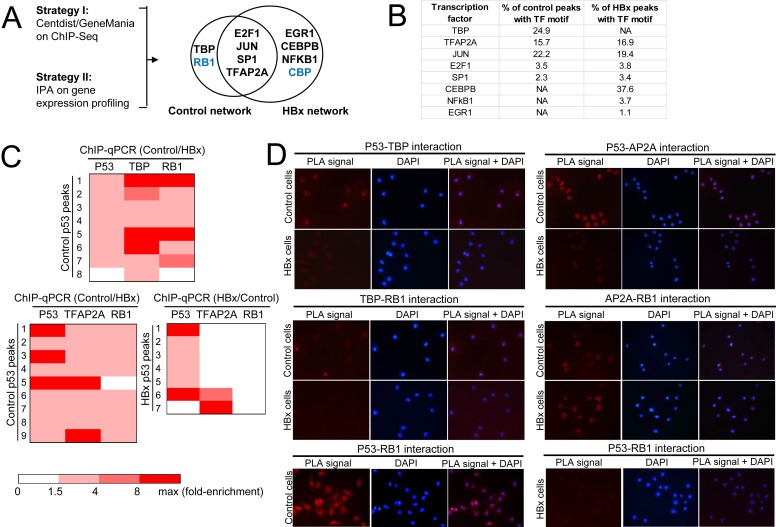
HBx disrupts p53‐TBP and p53‐TFAP2A transcription complex‐DNA binding and subsequent recruitment of RB1. (A) Schematic diagram showing the in silico strategies employed to shortlist high confidence p53 co‐localizing transcription factors and regulators. Bold: predicted by Centdist, GeneMania and IPA; Blue: predicted by GeneMania and IPA. (B) Shortlist of high confidence p53 co‐localizing transcription factors identified and their frequency of occurrence in control‐ and HBx‐specific p53 peaks are tabulated. (C) p53‐TBP‐RB1 (top panel) and p53‐TFAP2A‐RB1 (bottom left and right panels) DNA co‐occupancy in control cells is abolished in the presence of HBx. The strength of TF‐DNA binding is indicated by the gradient heat map of ChIP‐qPCR fold enrichment of the respective transcription factor. ChIP‐qPCR validation was performed using three independent ChIP experiments of the respective transcription factors/regulators. (D) Interaction of indicated proteins determined by PLA. Red PLA signals indicate sites of protein–protein interaction observed by fluorescence microscopy (left panel), blue DAPI signals indicate the cell nucleus (middle panel), merged PLA and DAPI images (right panel).
Several patterns of p53‐associated transcription complex co‐occupancy emerged from ChIP‐qPCR characterization of the in silico predictions. First, transcription factors TBP and TFAP2A were found to co‐localize with p53 at a subset of p53 binding sites that further recruited transcription co‐regulator RB1, and this binding of p53‐TBP‐RB1 and p53‐TFAP2A‐RB1 transcription complexes was attenuated in the presence of HBx (Figure 2C). Although the TFAP2A motif was predicted to be co‐enriched together with p53 in 16.9% of HBx‐specific p53 peaks, these consistently could not be validated using TFAP2A ChIP‐qPCR (Figure 2C). The control‐specific p53‐TBP/TFAP2A‐RB1 transcription complex was further supported by protein–protein interaction studies using proximity ligation assay (PLA) that afforded greater sensitivity than traditional co‐immunoprecipitation methods for detecting interactions between endogenous, low expression transcription factors. The interactions between p53 and TBP, TFAP2A and RB1 were markedly attenuated in the presence of HBx, suggesting that HBx induces the dissociation of the p53‐TBP/TFAP2A‐RB1 complex (Figure 2D). Since RB1 does not interact directly with p53 but indirectly through adaptors such as TBP and TFAP2A, disruption of the interaction of p53 with its transcription co‐factors TBP and TFAP2A by the viral X protein effectively abolishes the recruitment of RB1 to the p53‐associated transcription complex. Together, the data suggest that the HBx‐disrupted recruitment of the p53‐TBP/TFAP2A‐RB1 transcription complex to DNA may be influenced by the dissociation of p53 with its transcription co‐factors TBP and TFAP2A.
2.3. HBx enhances DNA recruitment of p53‐associated transcription complexes
We had previously reported that HBx favoured the co‐recruitment of p53 with transcription factor Sp1 in modulating the regulation of the p53AIP1 gene (Chan et al., 2013). In this study, ChIP‐qPCR characterization of p53 and Sp1 recruitment at control‐ and HBx‐specific p53 binding sites showed consistent p53‐Sp1 co‐recruitment in the presence of HBx (Figure 3A). This genome‐wide ChIP‐Seq data demonstrates for the first time, exemplified by the HBx‐enhanced partnership of p53 and Sp1, global modes of p53‐TF deregulation by the viral X protein.
Figure 3.
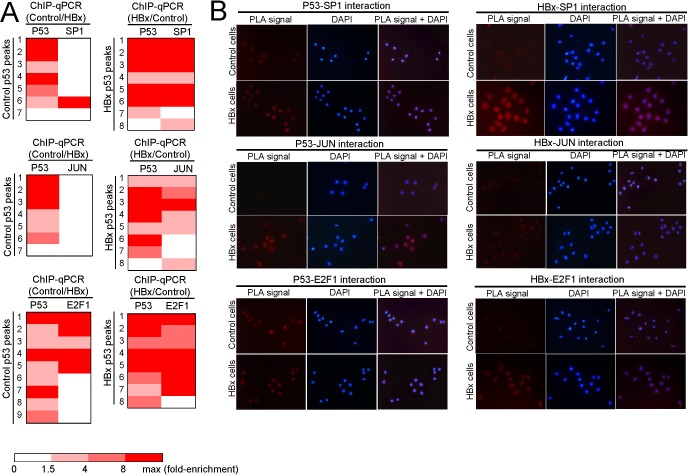
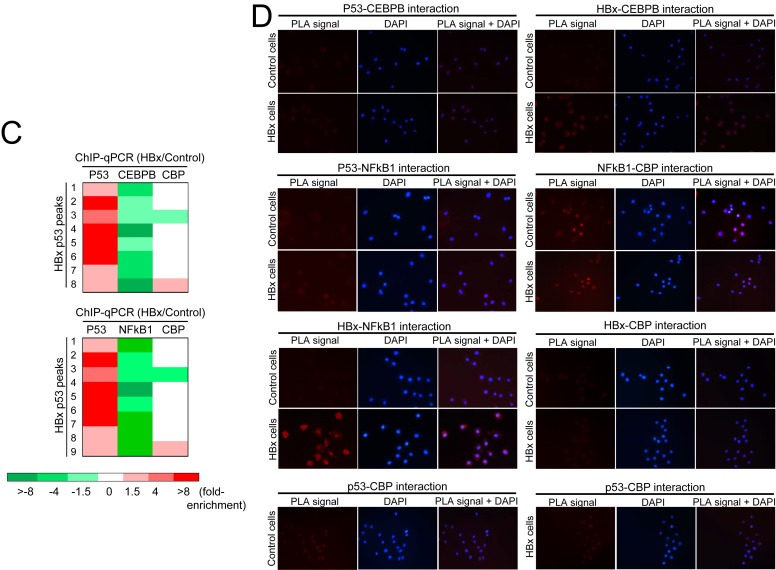
HBx enhances p53 recruitment to DNA. (A) p53‐Sp1 (top), JUN (middle) and E2F1 (bottom) DNA co‐occupancy is enhanced in the presence of HBx. The strength of TF‐DNA binding is indicated by the gradient heat map of ChIP‐qPCR fold enrichment of the respective transcription factor. (B) Interaction of indicated proteins determined by PLA. Red PLA signals indicate sites of protein–protein interaction observed by fluorescence microscopy (left), blue DAPI signals indicate the cell nucleus (middle), merged PLA and DAPI images (right). (C) p53‐DNA occupancy excludes NFkB1 and CEBPβ DNA occupancy in the presence of HBx. (D) Interaction of indicated proteins determined by PLA.
Figure 3.
(continued).
Additionally, further ChIP‐Seq characterization studies revealed that HBx also favoured the co‐recruitment of p53 with JUN and E2F1 to distinct p53 binding sites (Figure 3A). This was evident from the greater number of ChIP‐qPCR‐validated JUN/E2F1 binding at the HBx‐specific p53 peaks compared to control‐specific p53 peaks, despite the presence of JUN/E2F1 motifs in both control‐ and HBx‐specific p53 peaks (Figure 3A). We further hypothesized that HBx may enhance the association of p53 with Sp1, Jun and E2F1, resulting in enhanced co‐recruitment on DNA. Indeed, the interaction of p53 with Sp1 and Jun was enhanced in the presence of HBx as detected by PLA (Figure 3B), suggesting that HBx favours the interaction of p53 with Sp1, Jun and to a lesser extent E2F1 in transcription complexes that facilitate binding to DNA.
An unexpected pattern emerged from the p53 ChIP‐Seq profiling whereby HBx induced a change in transcription factor/regulator binding preference in favour of p53 occupancy (Figure 3C). Although our initial in silico analysis predicted the co‐enrichment of p53 with CEBPB and NFkB1 in the presence of HBx, ChIP‐qPCR characterization revealed selective enrichment of p53 binding in HBx‐expressing cells but selective enrichment of CEBPB or NFkB1 binding in control cells at the same binding sites (Figure 3C). This suggests that the viral X protein may alter gene transcription by switching from a CEBPB‐ or NFkB1‐CBP‐directed transcription control to a p53‐regulated control. Consistent with a competitive binding model of p53 and CEBPB/NFkB1, we did not detect interaction between p53 and CEBPB or NFkB1 (Figure 3D). In summary, characterization of p53 and its transcription co‐factor/co‐regulator DNA occupancy profiles demonstrates different modes by which the viral X protein modulates global p53‐associated transcription complex site selection that may re‐direct transcriptional regulation of genes.
2.4. Altered p53‐associated transcription complex site selection is linked to deregulated cell proliferation/death and protein phosphorylation
The complex interplay and delicate balance of gene regulation can influence cellular outcome. To assess the biological relevance of altered p53 transcription complex site selection characterized in our study, significantly (p < 0.01) deregulated genes associated to the p53 transcription complexes studied here were queried using the functional annotation tool DAVID. Importantly, genes linked to altered p53 transcription complex‐DNA binding were found to be chiefly involved critical cellular processes including the regulation of cell proliferation, cell death and cellular protein phosphorylation (phosphorus metabolic process) (Figure 4A). Notably, modulated p53 transcription complex site selection was associated with up‐regulation of known oncogenes such as myc, sox4 and mdm4 and concurrent down‐regulation of tumour suppressor genes including foxp1 and trim24, suggesting possible tumour promoting consequences of p53 deregulation by the viral X protein (Figure 4A). Interestingly, HBx‐altered recruitment of the p53‐associated transcription complex by the viral X protein was also linked to the deregulation of genes coding for a variety of kinases including G2 checkpoint kinase WEE1, dual specificity protein kinase MAP2K5 and serine/threonine kinases STK3/24 as well as phosphatases such as dual specificity protein phosphatase DUSP5 and protein tyrosine phosphatases PTPN1/3 (Figure 4A). As post‐translational modifications of cellular proteins serve as important signals for a myriad of processes, wide‐spread deregulation of the delicate balance of protein phosphorylation in the cell may present an important mechanism by which the viral X protein modulates cellular processes.
Figure 4.
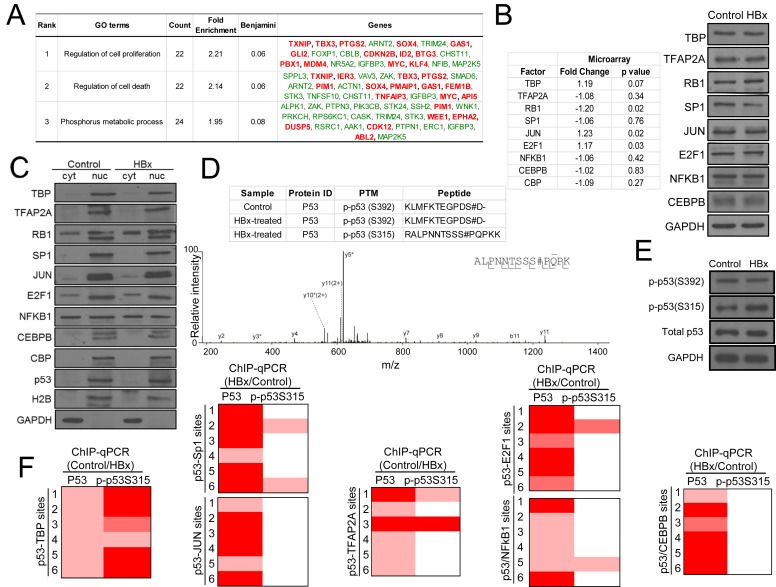
P53 serine 315 phosphorylation is associated with HBx‐disrupted p53‐TBP‐RB1 transcription complex. (A) Gene Ontology terms (GO) enriched (Benjamini <0.1) for significantly (p < 0.01) deregulated genes linked to altered p53‐associated transcription complexes, as assessed by DAVID. (B) Gene expression levels of the shortlisted p53 transcription co‐factors and co‐regulators in control and HBx‐expressing HepG2 cells, determined using microarray expression profiling is tabulated. Corresponding protein levels of the respective p53 transcription co‐factors and co‐regulators in control and HBx‐expressing HepG2 cells determined by western blotting is shown (right). (C) Subcellular localization of p53 and the specific p53 transcription co‐factors and co‐regulators in control and HBx‐expressing HepG2 cells, determined using fractionation and western blotting using specific antibodies. (D) Serine 315‐ and 392‐phosphorylated p53 peptides identified using mass spectrometry of p53 proteins immunoprecipitated from control and HBx‐expressing cells (table, top). Mass spectrum of p53 peptide containing phosphorylated serine 315 from HBx‐expressing cells (bottom). (E) Western blot validation of elevated p‐p53(S315) levels in HBx‐expressing cells compared to control cells using phospho‐specific p53 antibodies. Total p53 protein levels are shown and GAPDH protein expression was used as loading control for western blotting. (F) p‐p53(S315) ChIP‐qPCR occupancy on control and HBx‐expressing cells exhibiting identical recruitment patterns to that of p53‐TBP‐RB1 transcription complex. The strength of TF‐DNA binding is indicated by the gradient heat map of ChIP‐qPCR fold enrichment of the respective transcription factor.
2.5. Enhanced phosphorylation of p53 at Ser315 is associated with attenuated p53‐DNA binding
We explored several factors that may influence the differential association of p53 with the transcription co‐factors and co‐regulators examined in this study, including gene and protein abundance and availability. Gene expression of the respective transcription co‐factors/co‐regulators were examined using microarray profiling, while their protein expression levels and subcellular localization were determined using fractionation followed by immunoblotting with specific antibodies against the respective proteins. Comparable levels of the transcription co‐factors and co‐regulators were detected in HBx‐expressing and control cells, suggesting that the viral X protein does not alter the expression and/or the stability of the transcription factors and regulators examined here (Figure 4B). Further investigation into the localization of the proteins showed that HBx did not alter their subcellular localization (Figure 4C). TBP, TFAP2A, Sp1, JUN, E2F1, CEBPB and CBP remained largely in the nucleus in both control and HBx‐expressing cells while RB1 and NFkB1 were consistently detected in both the cytosol and nucleus in the presence or absence of HBx (Figure 4C). Together, these data suggest that HBx modulates the association of p53 with distinct transcription partners through mechanisms independent of transcription co‐factor/co‐regulator abundance and availability in the nucleus.
We had previously reported that post‐translational modification of the p53 protein, specifically HBx‐enhanced p53 lysine 320 acetylation together with its associated transcription partners Sp1 and PCAF are involved in modulating p53‐DNA binding and deregulation of the pro‐apoptotic gene p53AIP1 (Chan et al., 2013). Further, we had found that altered p53 target gene regulation by HBx was associated with global deregulation of cellular protein phosphorylation (Figure 4A), supporting the importance of protein post‐translational modification in HBx‐induced aberrations. To identify HBx‐altered p53 post‐translational modifications, we employed liquid chromatography‐tandem mass spectrometry (LC‐MS/MS) coupled with bioinformatics interrogation of peptides for protein modifications. Interestingly, we identified elevated levels of p53 phosphorylation at serine 315 (S315) in HBx‐expressing cells (Figure 4D) and this was validated by immunoblotting using antibodies specific for phosphorylated p53 S315 (p‐p53(S315)) (Figure 4E). This was in contrast to p53 phosphorylation at serine 392 that was MS‐identified in both control and HBx‐expressing cells and detected at comparable levels in HBx‐expressing cells and control cells by immunoblotting (Figure 4D,E). We next asked if p‐p53(S315) is linked to specific transcription complexes characterized in this study. To explore this possibility, p‐p53(S315) ChIP‐qPCR was performed on HBx‐expressing and control cells and screened for binding at the respective p53‐associated transcription complex‐bound sites. Notably, p‐p53(S315) showed identical recruitment patterns exclusively with the p53‐TBP‐RB1 transcription complex (Figure 4F), strongly suggesting that HBx‐elevated p53(S315) phosphorylation is linked to attenuated DNA binding of the p53‐TBP‐RB1 complex.
3. Discussion
Tightly co‐ordinated control of the ‘cellular gatekeeper’ p53 transcription regulation is essential for maintaining cellular integrity (Levine, 1997). Accordingly, breaches of this control could plausibly compromise the ability of the cell to mount an adequate or appropriate response to cellular stresses. An increasing body of evidence implicates viral onco‐proteins such as the hepatitis B virus X protein in hijacking the p53 circuitry, altering its regulation of target genes chiefly through modulating its DNA binding site selection (Chan et al., 2013; Chung et al., 2003; Ogden et al., 2000; Truant et al., 1995; Wang et al., 1994).
In this study, using an unbiased genome‐wide strategy, we report for the first time a global re‐wiring of the p53‐DNA binding architecture induced by a physiologically relevant level of the viral X protein. We demonstrate that HBx modulates p53‐DNA binding by both enhancing and attenuating p53 occupancy at distinct sites and that this is strongly influenced by its interaction with specific transcription partners and its post‐translational modifications (Figure 5). Specifically, HBx attenuated p53‐TBP/TFAP2A‐RB1 transcription complex recruitment and this was associated with concurrent disruption of the interaction of p53 with transcription co‐factors TBP and TFAP2A and their subsequent recruitment of RB1 to the p53 transcription complex. In contrast, HBx favoured the recruitment of p53 in association with other sequence‐specific transcription factors including Sp1, JUN and E2F1. This is the first report to demonstrate a global shift in p53‐transcription factor preferences, consistent with and extending from our previous finding that HBx enhanced recruitment of the p53‐Sp1 transcription complex to the regulatory region of an apoptosis‐inducing gene p53AIP1 and thus alluding to a universal mode of p53 deregulation by the viral X protein. Although it is not fully understood how the viral X protein selectively favours DNA‐binding of specific p53‐transcription factor combinations, our data suggest that this may be partly determined by HBx‐enhanced interactions between p53 and its transcription co‐factors, exemplified by Sp1 and JUN. We hypothesize that p53 association with various sequence‐specific transcription co‐factors in multi‐protein complexes affords greater versatility in binding less conserved/low affinity p53 response elements, a pattern observed in HBx‐specific p53 binding sites identified from our global ChIP‐Seq study. Furthermore, it is plausible that HBx may complement the function of ‘sticky’ proteins such as transcription factor Sp1 and JUN that mediate DNA looping of distal to proximal transcription‐factor bound sites near TATA boxes to influence gene transcription (Mastrangelo et al., 1991; Su et al., 1991; Becker et al., 1995). We further unravelled a novel mode of global HBx‐favoured p53 recruitment that displaced DNA‐bound transcription factors CEBPB and NFkB1‐CBP, suggesting that the viral X protein may be able to further induce a ‘switch’ between competing transcription regulation circuitries of target genes to ultimately re‐direct cellular outcomes. Indeed, altered recruitment of p53‐associated transcription complexes identified in this study was linked with aberrant expression of genes mainly involved in cell proliferation and death that are critical cellular processes governing proper cell homeostasis.
Figure 5.

Model illustrating modes of p53‐associated transcription complex modulation by HBx. HBx attenuates p53‐TBP/TFAP2A‐RB1 DNA‐binding (left panel). HBx conversely enhances other p53‐TF binding to DNA including Sp1, JUN and E2F1 (middle panel). In other cases, HBx favours p53‐DNA binding while concurrently excluding the binding of TFs including CEBPB and NFkB1 to their binding sites (right panel). Together, altered p53 site selection results in the deregulation of genes chiefly involved in cell proliferation and death.
P53 is regarded as a sentinel upon which cellular stress signals converge in the form of a ‘post‐translational code’, directing p53 site selection and the appropriate regulation of specific classes of target genes. The p53 ‘post‐translational code’ thus presents an avenue by which viral onco‐proteins can alter the fine‐tuning of p53 transcription regulation (Kao et al., 2004; Li et al., 2012; Lin et al., 2000), illustrated by the hijacking of PCAF‐mediated acetylation of p53 lysine 320 by the hepatitis B virus X protein to deregulate p53AIP1 (Chan et al., 2013). Here, we further identified a HBx‐enhanced phosphorylation of p53 specifically at serine 315 using LC‐MS/MS that was exclusively associated with disrupted p53‐TBP‐RB1 transcription complex recruitment to DNA by HBx. The selective association of hyper‐phosphorylated p53 S315 with HBx‐attenuated TBP‐RB1 DNA occupancy and not with attenuated TFAP2A‐RB1 DNA occupancy suggests that distinct p53‐associated transcription complexes may be uniquely post‐translationally marked and directed to regulate specific classes of target genes (Figure S3). This finding further implies that the interplay of multiple levels of p53 fine‐tuning including post‐translational modification marks as well as its interacting co‐factors would determine p53 site selection and consequent cell fate, opening opportunities for selected and directed re‐setting of proper p53 transcription regulation. The complexity of the p53 response may account for the lack of strong associations between changes in transcription factor occupancy examined in this study and changes in the expression of the associate gene (Figure S7). For example, of the 8 ChIP‐qPCR‐validated sites where DNA occupancy of p53‐TBP‐RB1 was attenuated in HBx‐expressing cells (Figure 2C), 4 of the associated genes were found to be upregulated (>1.5‐fold) while the other 4 associated genes were downregulated (>1.5‐fold). Another example is in the switch in transcription factor occupancy from CEBPB to p53 HBx‐expressing cells. Here, of the 8 ChIP‐qPCR‐validated sites, 2 of the associated genes were upregulated (>1.5‐fold), 3 of the associated genes were downregulated (>1.5 fold) and 3 genes remained unchanged in their expression. Further stratification of the patterns of p53‐associated transcription factor complexes identified here including but not limited to post‐translational modifications of the recruited transcription factors, chromatin remodelers, interactions with distal enhancers may unravel the detailed mechanistics of fine‐tuning the p53 response.
4. Conclusions
In summary, we have elucidated specific p53 transcription regulatory programs that are re‐wired by the hepatitis B virus X protein, culminating in the deregulation of genes involved in determining cell fate. Importantly, our study has mapped out a conceptual framework by which the viral X protein can modulate the fine‐tuning of global p53 site selection at different yet interlinked levels including altering its association with transcription partners as well as its post‐translational marks. These findings present a paradigm by which we can understand the virus' mode of host cellular transcription deregulation and tailor molecular‐based strategies to interfere with the viral oncoprotein‐induced transcription aberrations.
5. Experimental procedures
5.1. Cell culture
Human HCC cell line HepG2 obtained from American Type Culture Collection was routinely cultured in Dulbecco's modified Eagle's medium (DMEM) containing 10% foetal calf serum (FCS). The cells were transduced with HBx‐expressing or control adenovirus, treated with UVC (254 nm) irradiation 48 h post‐transduction and harvested 24 h after UV irradiation, as previously described (Lee et al., 2005) and expressed physiological levels of HBx (Chan et al., 2013).
5.2. Immunoblotting and antibodies
3‐20 μg of protein sample was electrophoresed on a 12% SDS poly‐acrylamide gel. The following primary antibodies were used for western blotting: mouse anti‐p53 (DO‐1, 1:1000 dilution), rabbit anti‐p‐p53(S315) (1:10000 dilution), mouse anti‐RB1 (IF8, 1:1000 dilution), rabbit anti‐CBP (A‐22, 1:10000 dilution), rabbit anti‐AP‐2α (H‐79, 1:10000 dilution), rabbit anti‐JUN (H‐79, 1:10000), mouse anti‐E2F1 (KH95, 1:1000 dilution), mouse anti‐SP1 (1C6, 1:1000 dilution) and rabbit anti‐C/EBPβ (C19, 1:10000 dilution) purchased from Santa Cruz Biotechnology (CA, USA); rabbit anti‐TBP (1:10000 dilution) and rabbit anti‐p65 (1:10000 dilution) purchased from Abcam (UK); rabbit anti‐p‐p53(S392) (1:1000 dilution) and mouse anti‐GAPDH (1:100000 dilution) purchased from Millipore (MA, USA); rabbit anti‐HBx antibody (1:10000 dilution) generated in our lab (Lee et al., 2005).
5.3. In Situ proximity ligation assay
2 × 10⁴ HepG2 cells were seeded in each well of an 8‐well glass chamber (Thermo Scientific, MA, USA). Cells were transduced with HBx or control adenovirus, UV‐treated 48 h post‐transduction and fixed using 4% paraformaldehyde for 15 min at 4 °C. Protein–protein interactions were subsequently detected using PLA (Duolink in situ PLA™; Olink Bioscience, Uppsala, Sweden) according to the manufacturer's instructions. Briefly, cells were permeabilised using 0.3% Triton X‐100 for 10 min at room temperature, washed twice with PBS and blocked for 30 min at 37 °C. Appropriate pairs of mouse and rabbit antibodies specific for the respective proteins of interest were added and incubated overnight at 4 °C. Following washing, PLA plus and minus probes for mouse and rabbit (Olink Bioscience) were added and incubated for 30 min at 37 °C, washed and incubated with ligation and then amplification mixes (Duolink Detection Kit HRP/NovaRED). After a series of washings, cells were mounted with Duolink DAPI Mounting Medium (Olink Bioscience) and observed for red PLA signals indicating sites of protein–protein interaction using a fluorescence microscope (Olympus, Japan) at 200× magnification.
5.4. Chromatin immunoprecipitation‐real‐time PCR (ChIP‐qPCR)
ChIP was performed on control and HBx‐expressing UV‐treated HepG2 cell lysates according to the manufacturer's instructions (Upstate, Millipore). Briefly, protein and DNA were cross‐linked with 1% formaldehyde for 10 min at room temperature and the cross‐linking reaction was quenched by adding glycine to a final concentration of 125 mM glycine for 5 min. 2 × 10⁶ cells were lysed using SDS lysis buffer supplemented with protease inhibitors (Roche Molecular Biochemicals, USA) and chromatin sheared to approximately 300 bp using a Bioruptor® sonicator (Diagenode, NJ, USA) at medium setting for 12 cycles of 30 s ‘on’ followed by 30 s ‘off’. Cell lysate was pre‐cleared with BSA‐blocked protein G beads (Upstate) following removal of cell debris by centrifugation at 10 000×g. A 100 μl aliquot of the cell lysate was saved as ‘Input DNA’. Clarified lysates were immunoprecipitated with 1 μg of antibody at 4 °C overnight, followed by 2–3 h with BSA‐blocked protein G beads. Complexes were washed according to the manufacturer's instructions. Both ChIP and Input complexes were eluted by reverse cross‐linking using 5 M NaCl, 65 °C, overnight and subsequently recovered using phenol chloroform extraction and ethanol precipitation. Enrichment of ChIP DNA at the respective regions was measured by quantitative real‐time PCR (qPCR) using QuantiTect™ SYBR® Green Master PCR mix (Qiagen) and primer sets detailed in Table S1 (Additional file 2). Input DNA was used to normalize for differences in the starting amount of DNA in each sample. qPCR reaction conditions were as follows: 95 °C for 10 min, followed by 45 cycles of 95 °C for 30 s, 58 °C for 30 s and 72 °C for 30 s.
5.5. ChIP‐Sequencing (ChIP‐Seq)
P53 ChIP, library preparation and sequencing of ChIP DNA were performed by Active Motif, USA. Essentially, 30 μg of control and HBx‐expressing UV‐treated HepG2 cell lysates were immunoprecipitated using 4 μg of p53 FL‐393 antibody (Santa Cruz Biotechnology). Successful p53 ChIP enrichment was determined by qPCR validation of p53 occupancy at known p53 binding sites including Bax (−230), Mdm2 (+990) and PLK2 but not in a non‐p53 binding region. The subsequent yield and size of the ChIP library generated was quantified, followed by sequencing using HiSeq (Illumina, CA, USA) to read counts of 7.7 M total reads (Figure S4A in Additional file 1).
5.6. ChIP‐Seq analysis, motif analysis and genomic distribution of binding events
Each sequenced ChIP‐Seq sample yielded standard fastq file outputs. Fastq files were mapped to Human Reference Genome version GRCh37/hg19 and indexed using BWA (Li and Durbin, 2009). Samtools was employed to compress SAM to BAM files (Li et al., 2009). Subsequently, peak calling was performed on individual ChIP‐Seq experiments using Model‐based Analysis of ChIP‐Seq MACS (version 2.0.9) to identify p53 binding sites (Zhang et al., 2008). Peaks overlapping between conditions were considered unaffected by HBx treatment and removed using the bedtools intersect function (Quinlan and Hall, 2010). The resulting control‐ and HBx‐specific peaks are defined as follows: control‐specific peaks refer to peaks enriched only in control ChIP‐Seq dataset, HBx‐specific peaks refer to peaks enriched only in HBx ChIP‐Seq dataset. Motif enrichment software CENTDIST (Zhang et al., 2011) was employed to confirm enrichment of p53 motifs over all peak areas in each condition (Figure S4B in Additional file 1). Putative p53 motif and their location within each peak were determined using p53MH software (Hoh et al., 2002). The p53 motif with the highest p53 motif score for each peak was used for further analysis. Peaks without a p53 motif or with a negative p53 motif score as predicted by p53MH were not considered for further analysis. P53 control‐ and HBx‐specific peaks were annotated to the nearest gene on either strand. Genomic distributions of p53 peaks were analysed using the cis‐regulatory element annotation system (CEAS) (Ji et al., 2006) and classified as follows: 5′ untranslated region (5′ UTR), promoter (5 kb upstream of RefSeq 5′ start), coding exon, intron, 3′ untranslated region (3′ UTR) and intergenic (if the peak does not fall within the above‐mentioned categories). The numbers of reads obtained and aligned are detailed in Figure S4A in Additional file 1. At least 40 randomly chosen control‐ and HBx‐specific p53 peaks from our dataset was successfully validated using p53 ChIP‐qPCR (Figure S1 in Additional file 1). For the control‐specific peaks selected for validation, the mean and median percentage similarity to p53 consensus as determined by p53MH was 58.03 and 59.80 respectively. For the HBx‐specific peaks selected for validation, the mean and median percentage similarity to p53 consensus as determined by p53MH was 54.93 and 56.03 respectively. The percentage similarity to the p53 consensus sequence is indicative of the quality of the p53 binding site. Majority of the control‐ and HBx‐specific peaks randomly selected for validation were not located near transcription start sites, reflective of the overall distribution in functional regions of peaks in both data sets as shown in Figure 1B.
5.7. Microarray expression profiling and analysis
Three independent biological replicates of control and HBx UV‐treated HepG2 cells were prepared, RNA extracted using RNeasy Kit (Qiagen) and employed for whole genome expression profiling on Human GE 8 × 60 K microarray v2 (Agilent). Gene expression profiles were analysed using the Bioconductor/Limma pipeline (Smyth et al., 2005). First, raw data was loaded into an R session. Raw intensity values were background corrected (normexp) and quantile‐normalized between arrays. Control probes were removed, and replicate probes were averaged. Probes were annotated using an annotation file provided by Agilent. Finally, significant differential gene expression between control and HBx‐expressing cells were calculated. P‐values were corrected for multiple testing using the Benjamini‐Hochberg false discovery rate (FDR) method. Genes were considered significantly differentially expressed with a fold difference >1.5 and FDR <0.05. Gene ontology (GO) analyses were performed using Ingenuity Pathway Analysis (IPA) as well as the database for annotation, visualization and integrated discovery (DAVID) (http://david.abcc.ncifcrf.gov).
5.8. Reverse‐transcription‐qPCR (RT‐qPCR)
Total RNA was prepared using RNeasy Mini Kit (Qiagen, Hilden, Germany) according to the manufacturer's instructions. Reverse transcription (RT) was performed using Superscript® II (Invitrogen, CA, USA). Transcript abundance was measured by quantitative real‐time PCR (qPCR) using QuantiTect™ SYBR® Green Master PCR mix (Qiagen), and normalized against β‐actin housekeeping gene. Twenty‐seven significantly deregulated genes were randomly chosen and validated using RT‐qPCR, using the respective primers sets detailed in Table S2 in Additional file 2 (Figure S5 in Additional file 1).
5.9. Liquid chromatography‐tandem mass spectrometry (LC‐MS/MS)
In gel digested peptides were separated and analysed on a LC‐MS/MS system with a Dionex UltiMate 3000 UHPLC coupled to a linear quadrupole ion trap‐Fourier transform (LTQ‐FT) Ultra mass spectrometer (Thermo Electron, Bremen, Germany). Separation was performed using a reverse phase Acclaim PepMap RSL column (75 μm ID × 15 cm, 2 μm particles, Thermo Scientific) with 0.1% formic acid (FA) as buffer A and 80% acetonitrile 0.1% FA as buffer B in a 60‐min gradient comprised of 2 min of 3% B, followed by 47 min of 3–30% B, 4 min of 30%–50% B, 1 min of 50–80% B, 2 min of 80% B followed by re‐equilibration at 3% B for 7 min. Peptides were ionized online using a Michrom CaptiveSpray ion source (Bruker‐Michrom Inc, Auburn, USA) at an electrospray potential of 1.5 KV to an ion transfer tube at temperature of 180 °C. The LTQ‐FT Ultra was set to positive ion mode and MS scan (350–1600 m/z range) were acquired in the FT‐ICR cell at resolution of 100,000 and maximum ion injection time of 1000 ms. The AGC target for FT was set to 1e+06 and precursor ion charge state screening was enabled. The ten most intense ions with a 500 counts threshold were selected for fragmentation by collision‐activated dissociation with normalized collision energy 35%, activation Q 0.25 and activation time 30 ms. The MS/MS spectra were acquired in the linear ion trap with an AGC target for full MS of 3.0e+04 and MSn of 1e+04 with maximum injection time of 200 ms. Dynamic exclusion list was activated with a repeat count of 1 and an exclusion duration of 40 s. Single charged peptides were excluded for fragmentation. Isolation width for precursor ion was set to 2 Da. Data was acquired in centroid mode with Xcalibur version 2.0 SR2 (Thermo Electron, Bremen, Germany).
5.10. Bioinformatics analysis for LC‐MS/MS
Raw data obtained by LC‐MS/MS was first converted to Mascot Generic Format (.mgf files) using Thermo Proteome Discoverer (version 1.4.1.14, Thermo Fisher Scientific Inc.). The search against human UniProt database containing the sequence and the reversed (decoy) complement sequences of proteins was performed using an in‐house Mascot server (version 2.3.02, Matrix Science, MA, USA) with precursor ion tolerance of 10 ppm and MS/MS fragment ion tolerance of 0.8 Da. Two missed cleavage sites of trypsin were allowed. Carbamidomethylation (C) was set as a fixed modification, and oxidation (M), phosphorylation (S, T, and Y), methylation (R and L) and deamidation (N and Q) were set as variable modifications. The false discovery rate (FDR) of peptide identification was estimated to be less than 1% (FDR = 2.0 × decoy_hits/total_hits). The obtained peptide and protein lists were exported to Microsoft Excel for further analysis. The spectra of phospho‐peptides of the P53 protein were manually verified.
5.11. Bioinformatics analysis for p53‐associated transcription co‐factor/co‐regulator
Co‐localized sequence‐specific transcription factors around p53 ChIP‐Seq peaks were identified using CENTDIST. The specific motif locations of the respective enriched transcription factors were predicted using TRANSFAC (Matys et al., 2006). The quality of the respective TRANSFAC‐predicted transcription factor motif in each validated site shown in 2, 3A and C is included in Figure S6. Transcription co‐regulators that are potentially recruited via transcription factors to DNA were identified using GeneMANIA (www.genemania.org). Potential upstream regulators of significantly deregulated genes from microarray expression profiling were identified using IPA Upstream Regulator analysis (Figure S2 in Additional file 1).
5.12. Statistical analysis of experimental data
Student's t test was performed to analyse the significance of differences between sample means obtained from at least three independent experiments. Two‐tailed Chi‐Squared test was performed to analyse the significance of differences in spacer lengths and base distribution of p53 response elements in control‐ and HBx‐specific peaks.
5.13. Data access
The p53 ChIP‐Seq data and microarray expression data have been submitted to NCBI Gene Expression Omnibus (GEO) under accession number GSE64878.
Competing interests
The authors declare that they have no competing interests.
Authors' contributions
C.G.L supervised and managed the project. C.G.L and C.C designed the study and wrote the manuscript. C.C performed the lab experiments and analysed the data. X.G.P and N.S.K.S prepared samples, performed mass spectrometry (MS) experiments and analysed the (MS) data. S.R, T.T and W.J performed the bioinformatic analyses. All authors read and approved the final manuscript.
Supporting information
The following are the supplementary data related to this article:
Additional file 1 Supplementary figures and corresponding legends.
Additional file 2 Supplementary tables and corresponding legends.
Acknowledgements
This work was supported by a grant from the BioMedical Research Council (BMRC) (BMRC06/1/21/19/449), National Medical Research Council (NMRC) (NMRC/1238/2009) and the Singapore Millennium Foundation (SMF) as well as block funding from National Cancer Center, Singapore and Duke‐NUS Graduate Medical School to A/P Caroline G.L. LEE. We thank Way‐Champ Mah for the help in the preparation of the manuscript.
Supplementary data 1.
1.1.
Supplementary data related to this article can be found at http://dx.doi.org/10.1016/j.molonc.2016.05.006.
Chan Cheryl, Thurnherr Thomas, Wang Jingbo, Gallart-Palau Xavier, Sze Siu Kwan, Rozen Steve, Lee Caroline G., (2016), Global re-wiring of p53 transcription regulation by the hepatitis B virus X protein, Molecular Oncology 10, doi: 10.1016/j.molonc.2016.05.006.
References
- Becker, J.C. , Nikroo, A. , Brabletz, T. , Reisfeld, R.A. , 1995. DNA loops induced by cooperative binding of transcriptional activator proteins and preinitiation complexes. Proc. Natl. Acad. Sci. U. S. A. 92, 9727–9731. [DOI] [PMC free article] [PubMed] [Google Scholar]
- Chan, C. , Wang, Y. , Chow, P.K. , Chung, A.Y. , Ooi, L.L. , Lee, C.G. , 2013. Altered binding site selection of p53 transcription cassettes by hepatitis B virus X protein. Mol. Cell Biol. 33, 485–497. [DOI] [PMC free article] [PubMed] [Google Scholar]
- Chuikov, S. , Kurash, J.K. , Wilson, J.R. , Xiao, B. , Justin, N. , Ivanov, G.S. , Mckinney, K. , Tempst, P. , Prives, C. , Gamblin, S.J. , Barlev, N.A. , Reinberg, D. , 2004. Regulation of p53 activity through lysine methylation. Nature 432, 353–360. [DOI] [PubMed] [Google Scholar]
- Chung, T.W. , Lee, Y.C. , Ko, J.H. , Kim, C.H. , 2003. Hepatitis B virus X protein modulates the expression of PTEN by inhibiting the function of p53, a transcriptional activator in liver cells. Cancer Res. 63, 3453–3458. [PubMed] [Google Scholar]
- El-Deiry, W.S. , Kern, S.E. , Pietenpol, J.A. , Kinzler, K.W. , Vogelstein, B. , 1992. Definition of a consensus binding site for p53. Nat. Genet. 1, 45–49. [DOI] [PubMed] [Google Scholar]
- Farmer, G. , Colgan, J. , Nakatani, Y. , Manley, J.L. , Prives, C. , 1996. Functional interaction between p53, the TATA-binding protein (TBP), and TBP-associated factors in vivo. Mol. Cell. Biol. 16, 4295–4304. [DOI] [PMC free article] [PubMed] [Google Scholar]
- Gu, W. , Roeder, R.G. , 1997. Activation of p53 sequence-specific DNA binding by acetylation of the p53 C-terminal domain. Cell 90, 595–606. [DOI] [PubMed] [Google Scholar]
- Hoh, J. , Jin, S. , Parrado, T. , Edington, J. , Levine, A.J. , Ott, J. , 2002. The p53MH algorithm and its application in detecting p53-responsive genes. Proc. Natl. Acad. Sci. U. S. A. 99, 8467–8472. [DOI] [PMC free article] [PubMed] [Google Scholar]
- Jackson, J.G. , Post, S.M. , Lozano, G. , 2011. Regulation of tissue- and stimulus-specific cell fate decisions by p53 in vivo. J. Pathol. 223, 127–136. [DOI] [PubMed] [Google Scholar]
- Ji, X. , Li, W. , Song, J. , Wei, L. , Liu, X.S. , 2006. CEAS: cis-regulatory element annotation system. Nucleic Acids Res. 34, W551–W554. [DOI] [PMC free article] [PubMed] [Google Scholar]
- Kao, C.F. , Chen, S.Y. , Chen, J.Y. , Wu Lee, Y.H. , 2004. Modulation of p53 transcription regulatory activity and post-translational modification by hepatitis C virus core protein. Oncogene 23, 2472–2483. [DOI] [PubMed] [Google Scholar]
- Lane, D.P. , 1992. Cancer. p53, guardian of the genome. Nature 358, 15–16. [DOI] [PubMed] [Google Scholar]
- Lee, A.T. , Ren, J. , Wong, E.T. , Ban, K.H. , Lee, L.A. , Lee, C.G. , 2005. The hepatitis B virus X protein sensitizes HepG2 cells to UV light-induced DNA damage. J. Biol. Chem. 280, 33525–33535. [DOI] [PubMed] [Google Scholar]
- Levine, A.J. , 1997. p53, the cellular gatekeeper for growth and division. Cell 88, 323–331. [DOI] [PubMed] [Google Scholar]
- Li, B. , Carey, M. , Workman, J.L. , 2007. The role of chromatin during transcription. Cell 128, 707–719. [DOI] [PubMed] [Google Scholar]
- Li, H. , Durbin, R. , 2009. Fast and accurate short read alignment with Burrows-Wheeler transform. Bioinformatics 25, 1754–1760. [DOI] [PMC free article] [PubMed] [Google Scholar]
- Li, H. , Handsaker, B. , Wysoker, A. , Fennell, T. , Ruan, J. , Homer, N. , Marth, G. , Abecasis, G. , Durbin, R. , Genome Project Data Processing, S, 2009. The sequence alignment/map format and SAMtools. Bioinformatics 25, 2078–2079. [DOI] [PMC free article] [PubMed] [Google Scholar]
- Li, L. , Li, W. , Xiao, L. , Xu, J. , Chen, X. , Tang, M. , Dong, Z. , Tao, Q. , Cao, Y. , 2012. Viral oncoprotein LMP1 disrupts p53-induced cell cycle arrest and apoptosis through modulating K63-linked ubiquitination of p53. Cell Cycle 11, 2327–2336. [DOI] [PubMed] [Google Scholar]
- Lin, C.S. , Kuo, H.H. , Chen, J.Y. , Yang, C.S. , Wang, W.B. , 2000. Epstein-barr virus nuclear antigen 2 retards cell growth, induces p21(WAF1) expression, and modulates p53 activity post-translationally. J. Mol. Biol. 303, 7–23. [DOI] [PubMed] [Google Scholar]
- Luo, J. , Li, M. , Tang, Y. , Laszkowska, M. , Roeder, R.G. , Gu, W. , 2004. Acetylation of p53 augments its site-specific DNA binding both in vitro and in vivo. Proc. Natl. Acad. Sci. U. S. A. 101, 2259–2264. [DOI] [PMC free article] [PubMed] [Google Scholar]
- Massimi, P. , Banks, L. , 1997. Repression of p53 transcriptional activity by the HPV E7 proteins. Virology 227, 255–259. [DOI] [PubMed] [Google Scholar]
- Mastrangelo, I.A. , Courey, A.J. , Wall, J.S. , Jackson, S.P. , Hough, P.V. , 1991. DNA looping and Sp1 multimer links: a mechanism for transcriptional synergism and enhancement. Proc. Natl. Acad. Sci. U. S. A. 88, 5670–5674. [DOI] [PMC free article] [PubMed] [Google Scholar]
- Matys, V. , Kel-Margoulis, O.V. , Fricke, E. , Liebich, I. , Land, S. , Barre-Dirrie, A. , Reuter, I. , Chekmenev, D. , Krull, M. , Hornischer, K. , Voss, N. , Stegmaier, P. , Lewicki-Potapov, B. , Saxel, H. , Kel, A.E. , Wingender, E. , 2006. TRANSFAC and its module TRANSCompel: transcriptional gene regulation in eukaryotes. Nucleic Acids Res. 34, D108–D110. [DOI] [PMC free article] [PubMed] [Google Scholar]
- Menendez, D. , Inga, A. , Resnick, M.A. , 2009. The expanding universe of p53 targets. Nat. Rev. Cancer 9, 724–737. [DOI] [PubMed] [Google Scholar]
- Nikulenkov, F. , Spinnler, C. , Li, H. , Tonelli, C. , Shi, Y. , Turunen, M. , Kivioja, T. , Ignatiev, I. , Kel, A. , Taipale, J. , Selivanova, G. , 2012. Insights into p53 transcriptional function via genome-wide chromatin occupancy and gene expression analysis. Cell Death Differ 19, 1992–2002. [DOI] [PMC free article] [PubMed] [Google Scholar]
- Ogden, S.K. , Lee, K.C. , Barton, M.C. , 2000. Hepatitis B viral transactivator HBx alleviates p53-mediated repression of alpha-fetoprotein gene expression. J. Biol. Chem. 275, 27806–27814. [DOI] [PubMed] [Google Scholar]
- Quinlan, A.R. , Hall, I.M. , 2010. BEDTools: a flexible suite of utilities for comparing genomic features. Bioinformatics 26, 841–842. [DOI] [PMC free article] [PubMed] [Google Scholar]
- Riley, T. , Sontag, E. , Chen, P. , Levine, A. , 2008. Transcriptional control of human p53-regulated genes. Nat. Rev. Mol. Cell Biol. 9, 402–412. [DOI] [PubMed] [Google Scholar]
- Smeenk, L. , Van Heeringen, S.J. , Koeppel, M. , Van Driel, M.A. , Bartels, S.J. , Akkers, R.C. , Denissov, S. , Stunnenberg, H.G. , Lohrum, M. , 2008. Characterization of genome-wide p53-binding sites upon stress response. Nucleic Acids Res. 36, 3639–3654. [DOI] [PMC free article] [PubMed] [Google Scholar]
- Smyth, G.K. , Michaud, J. , Scott, H.S. , 2005. Use of within-array replicate spots for assessing differential expression in microarray experiments. Bioinformatics 21, 2067–2075. [DOI] [PubMed] [Google Scholar]
- Somasundaram, K. , El-Deiry, W.S. , 1997. Inhibition of p53-mediated transactivation and cell cycle arrest by E1A through its p300/CBP-interacting region. Oncogene 14, 1047–1057. [DOI] [PubMed] [Google Scholar]
- Su, W. , Jackson, S. , Tjian, R. , Echols, H. , 1991. DNA looping between sites for transcriptional activation: self-association of DNA-bound Sp1. Genes Dev. 5, 820–826. [DOI] [PubMed] [Google Scholar]
- Truant, R. , Antunovic, J. , Greenblatt, J. , Prives, C. , Cromlish, J.A. , 1995. Direct interaction of the hepatitis B virus HBx protein with p53 leads to inhibition by HBx of p53 response element-directed transactivation. J. Virol. 69, 1851–1859. [DOI] [PMC free article] [PubMed] [Google Scholar]
- Wang, X.W. , Forrester, K. , Yeh, H. , Feitelson, M.A. , Gu, J.R. , Harris, C.C. , 1994. Hepatitis B virus X protein inhibits p53 sequence-specific DNA binding, transcriptional activity, and association with transcription factor ERCC3. Proc. Natl. Acad. Sci. U. S. A. 91, 2230–2234. [DOI] [PMC free article] [PubMed] [Google Scholar]
- Wei, C.L. , Wu, Q. , Vega, V.B. , Chiu, K.P. , Ng, P. , Zhang, T. , Shahab, A. , Yong, H.C. , Fu, Y. , Weng, Z. , Liu, J. , Zhao, X.D. , Chew, J.L. , Lee, Y.L. , Kuznetsov, V.A. , Sung, W.K. , Miller, L.D. , Lim, B. , Liu, E.T. , Yu, Q. , Ng, H.H. , Ruan, Y. , 2006. A global map of p53 transcription-factor binding sites in the human genome. Cell 124, 207–219. [DOI] [PubMed] [Google Scholar]
- Zhang, Y. , Liu, T. , Meyer, C.A. , Eeckhoute, J. , Johnson, D.S. , Bernstein, B.E. , Nusbaum, C. , Myers, R.M. , Brown, M. , Li, W. , Liu, X.S. , 2008. Model-based analysis of ChIP-Seq (MACS). Genome Biol. 9, R137 [DOI] [PMC free article] [PubMed] [Google Scholar]
- Zhang, Z. , Chang, C.W. , Goh, W.L. , Sung, W.K. , Cheung, E. , 2011. CENTDIST: discovery of co-associated factors by motif distribution. Nucleic Acids Res. 39, W391–W399. [DOI] [PMC free article] [PubMed] [Google Scholar]
Associated Data
This section collects any data citations, data availability statements, or supplementary materials included in this article.
Supplementary Materials
The following are the supplementary data related to this article:
Additional file 1 Supplementary figures and corresponding legends.
Additional file 2 Supplementary tables and corresponding legends.