

Abstract
Modern technologies enable detection and characterization of circulating tumor cells (CTC) in peripheral blood samples. Thus, CTC have attracted interest as markers for therapeutic response in breast cancer. First studies have incorporated CTC analyses to guide therapeutic interventions and stratification of breast cancer patients. Aim of this study was to analyze characteristic features of CTC as biomarker for predicting resistance to HER2‐targeted therapies. Therefore, CTC from metastatic breast cancer patients with HER2‐negative primary tumors screened for the prospective randomized phase III trial DETECT III were explored for their HER2 status and the presence of PIK3CA mutations. Detection and characterization of HER2 expression of CTC were conducted with the CellSearch® system. Fifteen of 179 CTC‐positive patients (8.4%) contained ≥1 CTC with strong HER2 expression. Genomic DNA from individual CTC isolated by micromanipulation was propagated by whole genome amplification and analyzed for PIK3CA mutations in exons 9 and 20 by Sanger sequencing. One or more CTC/7.5 mL were detected in 179/290 patients (61.7%). In 109 patients (34.8%), ≥5 CTC/7.5 mL were found. We detected at least one CTC with the mutation p.E542K, p.E545K, p.H1047R, p.H1047L or p.M1043V in 12/33 patients (36.4%). Thirty six of 114 CTC (31.6%) harbored one of these mutations. CTC in individual patients exhibited heterogeneity concerning PIK3CA mutations and HER2 expression. In conclusion, clinically relevant genomic aberrations such as mutations in the hotspot regions of exon 9 and 20 of the PIK3CA gene can be detected in single CTC and might provide insights into mechanisms of resistance to HER2‐targeted therapies.
Keywords: Metastatic breast cancer, HER2, Circulating tumor cells, PIK3CA
Highlights
HER2 positive CTC are rarely detected in HER2‐negative metastatic breast cancer.
PIK3CA mutations can be detected frequently in single CTC.
CTC HER2 and PIK3CA status might assist decision making for HER2‐targeted therapy.
Abbreviations
- CTC
circulating tumor cells
- mBC
metastatic breast cancer
- FISH
fluorescence in situ hybridization
- PIK3CA
phosphatidylinositol-4,5-bisphosphate 3-kinase catalytic subunit alpha
- WGA
whole genome amplification
1. Introduction
To improve cancer therapy, current research efforts are directed to develop targeted therapies to ensure highly efficient personalized treatment without severe side effects. In this context, strategies influencing e.g., epidermal growth factor receptor HER2‐and hormone‐dependent tumor growth have already become part of standard treatment schedules for breast cancer patients (Van Poznak et al., 2015).
Currently, treatment decisions are guided by evaluating primary tumor tissues or biopsies from single metastases for target expression. However, choosing the best suitable targeted therapy is hampered by the necessity to identify the aggressive, treatable tumor cells and the heterogeneity of target expression within a given tumor tissue. Moreover, primary tumors and recurrences or metastases can differ in the expression of these target molecules (Fehm et al., 2010; Van Poznak et al., 2015). Thus, in patients with accessible newly diagnosed metastases, also metastatic tumor tissue should be evaluated. If discrepancies in the expression of the target between primary tumors and metastasis are measured, consistent with the clinical situation and the patient's goal for care, preferentially the situation in the metastases should be used to guide therapy (Van Poznak et al., 2015). However, since it is not always possible to access metastases for biopsies and also a heterogeneity of different metastatic sites might occur, several ongoing studies investigate whether detecting and characterizing CTC in peripheral blood as a “liquid biopsy” can improve clinical care (Alix‐Panabieres and Pantel, 2014; Joosse et al., 2015).
During the last decade, HER2‐targeted therapies have significantly improved the outcome of breast cancer patients with HER2‐positive primary tumors and metastases (Rimawi et al., 2015). As clinical relevant evidence has been provided that the HER2 status can change during breast cancer progression and thereby differ between primary tumors and metastases (Van Poznak et al., 2015), the DETECT study was aimed to re‐evaluate the HER2 status by assessing HER2 expression of CTC in patients with metastatic disease (Fehm et al., 2010). This and other studies concordantly showed that HER2‐positive CTC can be detected in relevant numbers of patients with HER2‐negative primary tumors (Fehm et al., 2010; Wallwiener et al., 2015). Moreover, Georgoulias et al. (2012) showed for the first time that administration of trastuzumab in patients with HER2‐negative primary tumors could eliminate keratin 19‐positive/HER2‐positive CTC, thereby prolonging disease‐free survival of these patients.
Thus, several prospective large interventional studies were initiated to find out whether CTC detection and characterization from “liquid” biopsies might improve treatment strategies (Bidard et al., 2013; Schramm et al., 2016).
As one of the first interventional trials based on the assessment of CTC phenotypes, the still ongoing German multicentric phase III trial DETECT III aims to evaluate the efficacy of a HER2‐targeted therapy in metastatic breast cancer (mBC) patients with HER2‐negative primary tumors, but HER2‐positive CTC (Schramm et al., 2016). Here, patients are treated randomized with the HER2‐targeted therapy lapatinib, in combination with standard therapy versus standard therapy alone (https://clinicaltrials.gov/ct2/show/NCT01619111).
It is important to note that overcoming resistance against HER2‐targeted therapy that is frequently observed during the course of treatment has become a major challenge in tumor research (Ibrahim et al., 2015; Rexer and Arteaga, 2012; Wilks, 2015). To date, there is no routine biomarker available to predict resistance to HER2‐targeted therapies and to help therapy decision making when resistance occurs. However, mutations or silencing of the PTEN (phosphatase and tensin homolog) gene found in about 40% of HER2‐positive breast cancers have been described to induce disease progression and resistance against HER2‐targeting therapies (Burnett et al., 2015; Nagata et al., 2004; Sansal and Sellers, 2004). Moreover, there is a growing body of evidence that activation of the phosphoinositide‐3 (PI3) kinase pathway, e.g., by mutations in the PIK3CA (phosphatidylinositol‐4,5‐bisphosphate 3‐kinase catalytic subunit alpha) gene plays a pivotal role in this process (Ibrahim et al., 2015, 2011, 2015).
Schneck et al. analyzed the entire CTC pools from patients enrolled in the DETECT III study using the SNaPshot (Hurst et al., 2009) method to search for PIK3CA mutations. Here, mutations in 7/44 (15.9%) patients were found (Schneck et al., 2013). Other authors investigated single CTC from mBC patients and reported strong heterogeneity in the PIK3CA mutational status even among CTC from individual patients (Neves et al., 2014; Pestrin et al., 2015; Polzer et al., 2014). These single CTC analyses resulted in higher detection rates of PIK3CA mutations; however, more information about the occurrence of these mutations in the context of therapeutic interventions is urgently needed.
Despite a considerable number of studies dealing with the analysis of HER2 expression of CTC, there is still a controversial debate about immunocytochemical approaches for the detection of HER2 overexpression in CTC. Based on the situation in tumor tissues, where FISH is the gold standard for the determination of the HER2 status, we further aimed to analyze single CTC for HER2 gene amplification by FISH. To test the hypothesis that mutational analysis of single CTC might be a meaningful tool to predict resistance and influence therapeutic decision making, the present study was intended to explore the frequency and heterogeneity of PIK3CA mutations of exons 9 and 20 in single CTC from patients screened for the DETECT III trial. Our study demonstrates that the detection of PIK3CA mutations in the mutational hotspot regions indicative of resistance against HER2‐targeted therapies in CTC from mBC patients is feasible. Therefore, this study might contribute to the development of biomarkers for therapy response and resistance that reflect the actual state of the disease.
2. Materials and methods
2.1. Patient material
Blood samples (7.5 mL) for CTC enumeration and determination of HER2 expression of CTC were obtained from 290 patients with mBC screened for participation in the DETECT III study (Table 1). Within a translational spin‐off project, blood was drawn before the start of a new line of therapy. All patients gave their informed consent for the use of their blood samples. A web‐based data bank was designed for data management and documentation. By the use of this interface, clinical investigators were blinded for test results and the CTC test sites were blinded for the clinical data of the patients. The study was approved by local institutional review boards. The trial was registered in the Current Controlled Trials Registry (https://clinicaltrials.gov/ct2/show/NCT01619111).
Table 1.
Detection and characterization of HER2 expression of CTC (circulating tumor cells).
| Total number of patients analyzed for CTC | 290 |
|---|---|
| Number of CTC‐positive patients (≥1 CTC/7.5 mL) | 179/290 (61.7%) |
| Number of CTC‐positive patients (≥5 CTC/7.5 mL) | 101/290 (34.8%) |
| Number of patients with HER2‐strongly positive CTC (≥1 HER2‐strongly positive CTC/7.5 mL) | 15/179 (8.4%) |
| Number of patients with HER2‐strongly positive and/or HER2‐moderately positive CTC | 37/179 (20.7%) |
| Patients with 1 HER2‐strongly positive CTC/7.5 mL | 4/15 |
| Patients with >1 <10% HER2‐strongly positive CTC | 7/15 |
| Patients with ≥10% HER2‐strongly positive CTC | 4/15 |
| Patients with ≥30% HER2‐strongly positive CTC | 3/15 |
From 33 of these patients, CTC were analyzed for PIK3CA mutations. FISH analyses were conducted on CTC from 11 patients.
Blood was collected in CellSave Preservative tubes (Janssen Diagnostics, Raritan, NJ, USA) and processed with the CellSearch® system (Janssen Diagnostics) within 96 h.
2.2. CTC enumeration and HER2 expression analysis using the CellSearch® system
CTC enumeration by the CellSearch® system (Janssen Diagnostics) was performed using the CellSearch® Epithelial Cell Kit (Janssen Diagnostics). In brief, 7.5 mL blood were mixed with 6.5 mL Dilution Buffer and centrifuged for 10 min at 800 ×g prior to CellSearch® processing. During the automated CellSearch® procedure CTC were immunomagnetically captured by anti‐epithelial cell adhesion molecule (EpCAM)‐antibody coated ferrofluid and detected by immunofluorescent staining of keratins and 4′,6‐diamidino‐2‐phenylindole (DAPI) as well as by negativity for the leukocyte specific antigen CD45. CTC were identified by a trained person as round to oval, keratin‐positive/CD45−/DAPI‐positive cells.
For analyzing HER2 expression in detected CTC, the CellSearch® Tumor Phenotyping Reagent HER‐2/neu (Janssen, Veridex, USA) was used according to manufacturers' instructions. Immunoscoring of HER2 expression by fluorescence intensity was performed as previously described (Riethdorf et al., 2010), however, with the difference that here CTC with intense and moderate HER2‐specific immunofluorescence signal (2+ and 3+, Riethdorf et al., 2010) were designated strongly HER2‐positive (3+). HER2 gene amplification could only be detected in CTC with strong intensity of immunofluorescence and nearly black background of HER2 images (Figure 1A,B CTC 8 and 9 and C,D). Cases with at least one CTC displaying strong HER2 immunofluorescence were considered HER2‐CTC‐positive.
Figure 1.
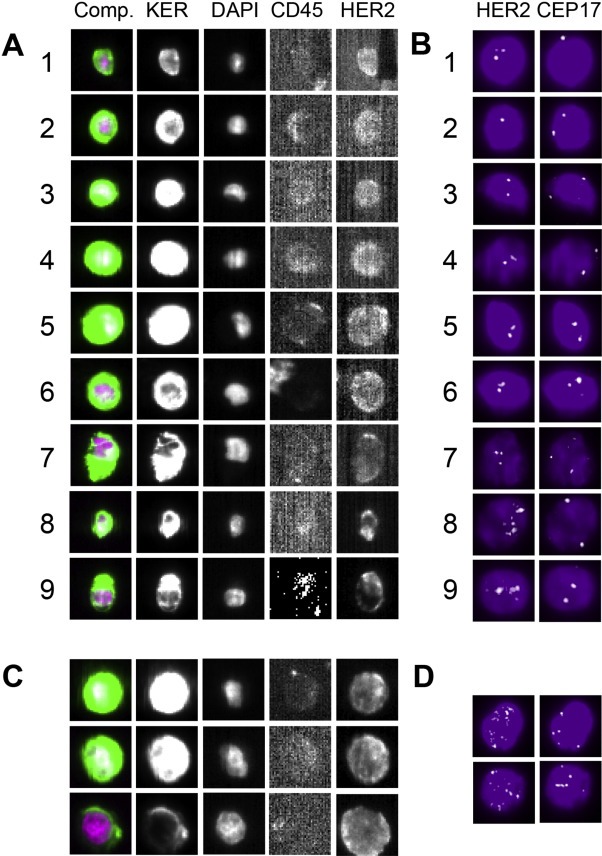
Analysis of HER2 expression with the CellSearch® system. A: CTC 1–7 display weak to moderate intensity of HER2 immunofluorescence and no HER2 gene amplification applying FISH (B). Only CTC 8 and 9 (from another study) exhibiting strong intensity of HER2 immunofluorescence present with HER2 gene amplification detected by FISH. C: Strong intensity of HER2 immunofluorescence displayed by BT474 breast cancer cell line cells characterized by HER2 gene amplification (D).
2.3. HER2 FISH in the CellSearch® cartridge
To assign HER2‐specific FISH (fluorescence in situ hybridization) results to individual CTC, cartridges were kept in the Magnest Cell Preservation device after CellSearch® processing. An automated buffer aspiration system (Neon, Janssen Diagnostics) was used for aspiration of fluids and fixation of the cells (Swennenhuis et al., 2009). Using this system, cells were fixed within the cartridges by carefully injecting 250 μL methanol:acetic acid (3:1) to the bottom of the cartridge and incubation for 2 min. After removing, another incubation in 250 μL methanol:acetic acid was followed by drying using forced air flow. The fixed and dried cartridges were stored at −20 °C.
In order to remove immunofluorescence signals remained from CellSearch® processing, cartridges were thawed at room temperature for at least 15 min, filled with 400 μL PBS and bleached for 20 min by Blue LED lights in the Bleaching Station (Janssen Diagnostics). After aspiration of PBS, cartridges were air‐dried using a forced air flow. To avoid leakage of cartridges, Fixogum (Marabu, Bietigheim‐Bissingen, Germany) was used to fix the glass coverslip within the plastic cartridge.
For hybridization, cartridges were incubated at 37 °C for 2 h and 50 μL probe mixture consisting of 45 μL FISH probe (HER2 and chromosome‐specific centromere probe CEP17, kindly provided by Janssen Diagnostics) and 5 μL KREAboost (Kreatech, Amsterdam, The Netherlands) was added in a way that it covers the whole glass surface. Denaturation was performed on a hot plate of the ThermoBrite device (Abbot Molecular, Des Plaines, IL, USA) for 5 min at 80 °C with the glass facing the hotplate followed by hybridization at 42 °C for 16 h.
To remove unspecific hybridization signals, slides were incubated loosely plugged in wash buffer (2× SSC buffer and deionized formamide mixed in 1:1 ratio), placed on the hot plate again (42 °C), and incubated for 10–15 min. After aspiration of stringent wash buffer a second wash step was performed in 400 μL CellSearch® dilution buffer for at least 20 min at room temperature followed by aspiration and addition of 450 μL dilution buffer. Rescanning of the cartridges was conducted after removing Fixogum and cleaning the glass coverslip.
Then cells were individually captured with a 40× objective in five Z‐stack images over 8 μm for each filter using the CellTracks AnalyzerII device (Janssen Diagnostics) (Attard et al., 2009; Swennenhuis et al., 2009). Flattened images were scored for copy numbers of HER2 and CEP17‐specific hybridization signals.
2.4. Isolation of single CTC for mutational analysis by micromanipulation
After detection with the CellSearch® system, CTC were prepared for further molecular characterization as described previously (Gasch et al., 2013). Briefly, CTC were re‐identified as keratin+/CD45−/DAPI+ with an Axiovert 200 inverted fluorescence microscope (Carl Zeiss AG, Jena, Germany). Single CTC were isolated by micromanipulation using the microinjector CellTram vario and the micromanipulator TransferMan NK2 (both Eppendorf AG, Hamburg, Germany) supplemented with custom‐made capillaries (40 μm in diameter, capillary type III, Eppendorf). Single cells were released into the cap of a PCR tube in 1 μL nuclease‐free water, spun down briefly (Galaxy Mini Microcentrifuge, VWR, Radnor, PA, USA) and stored at −20 °C until whole genome amplification (WGA).
2.5. WGA of DNA from single CTC
For 75 CTC, the GenomiPhi DNA Amplification kit (GE Healthcare, Chalfont St. Giles, UK) (Gasch et al., 2013, 2015) was used. After thawing CTC on ice, GenomPhi Sample Buffer was added (9 μL) and cells were lysed by protease digestion (10.7 μAU/μL protease, 15 min 50 °C, 15 min 70 °C). Following DNA denaturation (2 min, 95 °C), GenomiPhi amplification mix (9 μL reaction buffer and 1 μL enzyme mix) was added, and the DNA was amplified at 30 °C for 2.5 h. In a final step, the enzyme was inactivated at 65 °C for 10 min.
For 39 CTC, the Ampli1™ WGA Kit (Silicon Biosystems, Bolognia, Italy) was applied according to the instructions of the manufacturer. In brief, after thawing CTC on ice, Lysis Reaction Mix was added (2 μL) and consecutive incubation was performed for 45 min at 42 °C, 30 min at 65 °C and 15 min at 80 °C. After addition of Digestion Reaction Mix (2 μL), thermal incubation occurred for 5 min at 37 °C and 5 min at 65 °C. Before starting ligation for at least 1 h at 15 °C, Ligation Reaction Mix (5 μL) was added. Subsequently, primary PCR reaction was performed after adding 40 μL Primary PCR reaction Mix applying the thermal incubation protocol described in the manual (Silicon Biosystems).
WGA products were purified using NucleoSeq Columns (Macherey‐Nagel, Düren, Germany) as stated by the manufacturer.
The quality of WGA products was validated by multiplex PCR (Gasch et al., 2013; van Beers et al., 2006).
2.6. Detection of PIK3CA mutations in single CTC
DNA fragments containing either codons 542–546 or codon 1043–1047 of the PIK3CA gene were amplified from 20 ng purified WGA product in a standard PCR. PCR reactions were carried out as follows: 10 min at 94 °C, 35 cycles of 30 s at 94 °C, 30 s at the annealing temperature given below, 45 s at 72 °C followed by 7 min at 72 °C, in 1 × PCR Gold Buffer, 2 mM MgCl2, 0.67 mM dNTPs, 0.33 μM of each primer and 1.5 U TaqGold Polymerase (Applied Biosystems, Foster City, CA, USA).
For GenomiPhi WGA products the following PCR primers and conditions were used: exon 9 forward: CTGTAAATCATCTGTGAATCCAGAG; exon 9 reverse: CTGCTTTATTTATTCCAATAGGTATGG (annealing at 54 °C); exon 20 forward: CAGGAGATGTGTTACAAGGC, exon 20 reverse: GTGCAATTCCTATGCAATCG (annealing at 54 °C). To avoid co‐amplification of known pseudogene sequences at chromosomes 16 and 22 (Baker et al., 2012), additionally the following primers were applied for PCR of exon 9 at annealing temperature of 60 °C: forward: TTCTGTAAATCATCTGTGAATCC; reverse: CATTTTAGCACTTACCTGTGAC (Neves et al., 2014).
For amplification of Ampli1™ WGA products, the following primers were used: exon 9 forward: GGGAAAATGACAAAGAACAGCTC; exon 9 reverse: CATTTTAGCACTTACCTGTGAC (Neves et al., 2014), (annealing at 60 °C), exon 20 forward: CAGGAGATGTGTTACAAGGC; exon 20 reverse: ATTGTGTGGAAGATCCAATCC (annealing at 54 °C).
PCR products were separated on a preparative agarose gel and isolated using the Gel Extraction kit (peqlab GmbH, Erlangen, Germany) or the ExoSAP‐IT® PCR Product Cleanup reagent (Affymetrix, Cleveland, OH, USA).
DNA concentration was measured (NanoDrop Spectrophotometer, Thermo Scientific, Wilmington, DE, USA) and 50 ng/1000 bp PCR product were fluorescence‐labeled using the BigDye Terminator v3.1 Cycle Sequencing Kit (Applied Biosystems, Foster City, CA, USA) and the appropriate PCR primers. Subsequently, remaining components of the labeling reaction were removed by ethanol precipitation.
Analysis and evaluation of DNA sequences were performed on the Applied Biosystems 3130 Genetic Analyzer (Waltham, Massachusetts, USA) using the FinchTV 1.4. DNA sequence analysis program (GeoSpiza, Seattle, WA, USA).
3. Results
3.1. Detecting CTC and characterization of the HER2 status
Blood samples (7.5 mL) from a total number of 290 patients were analyzed for the presence of CTC using the CellSearch® system. One or more CTC/7.5 mL (range 1–20,000, mean: 93.5; median: 7) were detected in 179/290 patients (61.7%). In 101/290 patients (34.8%), ≥5 CTC/7.5 mL were found (Table 1).
To compare HER2 immunoscoring with the HER2 gene amplification status, FISH was performed in a subset of cases (n = 11) after fixation of cells in previously scanned CellSearch® cartridges followed by re‐scanning in the Cell Tracks AnalyzerII equipped with a 40× objective (Janssen Diagnostics). This procedure allowed us to count HER2‐and CEP17‐specific hybridization signals in individual CTC and to compare the FISH results with the intensity of HER2‐specific immunofluorescence in the same cells.
Only 2 CTC with a ratio of HER2‐specific to CEP17 signals of ≥2.2 (cut‐off for breast cancer tumor tissue) were observed in 2/11 samples (Supplementary Tables 1 and 2, patients 6 and 35). The 3 HER2‐strongly positive CTC from case 25 could not be relocated after FISH. No CTC with clusters of HER2‐specific signals clearly indicative for HER2 gene amplification were found within these samples (Figure 1, Supplementary Table 1). Data presented in Supplementary Table 2 demonstrate a good correlation of the intensity of HER2‐specific immunofluorescence and FISH results. In total, we analyzed 247 single CTC by FISH and found only 3 CTC with more than 3 HER2‐specific signals (Supplementary Table, case 6). Only one of these CTC displayed HER2 gene amplification of 2.5 fold (5 HER2/2 CEP17 signals). This CTC presented with a moderate intensity of HER2 immunofluorescence. All other CTC with HER2/CEP17 ratios of 2 or above had only one detectable CEN17‐specific signal, but no obvious HER2 gene amplification.
Applying the criteria displayed in Figure 1, 15/179 CTC‐positive patients (8.4%) contained at least one CTC with strong HER2 expression (Table 1). Four of these 15 patients had only one HER2‐positive CTC. In 7/15 CTC‐HER2‐positive patients >1, but <10% of all CTC were HER2‐strongly positive, and in 4/15 or 3/15 patients ≥10% or ≥30% of CTC presented with strong HER2‐positivity, respectively. CTC with at least moderate or with strong HER2‐specific immunofluorescence could be detected in 37/179 patients (20.7%, Table 1).
Circulating tumor cells from 33 mBC patients with >5 CTC/7.5 mL (Tables 2 and 3) were analyzed for PIK3CA mutations (Table 4). From 3 patients, CTC isolated from a second blood sample collected prior to the therapeutic intervention in the DETECT studies were also investigated (Tables 3 and 4, patients 7, 16, 19).
Table 2.
Clinicopathological parameters of patients analyzed for PIK3CA mutations in CTC (circulating tumor cells).
| Time | Age at CTC analysis | pT | N | M | Grading | Histology | ER | PR | HER2 | M at CTC analysis |
|---|---|---|---|---|---|---|---|---|---|---|
| At diagnosis of primary tumor | ||||||||||
| Pat.‐ID | ||||||||||
| 1 | 68 | IIIB | 1 | 0 | 2 | lobular | + | + | X | B, LN |
| 2 | 74 | IV | 2a | 1 | 2 | lobular | + | + | − | Liv, Lu, Lien |
| 3 | 45 | IV | 3a | 1 | 3 | lobular | + | + | − | B |
| 4 | 50 | x | x | x | x | lobular | + | + | − | Ov, B |
| 5 | 57 | IA | 0 | 0 | 2 | ductal | + | + | − | B, Lu, Liv, LN |
| 6 | 82 | IIIA | 2 | 0 | 2 | neuroendocrine | + | + | − | B, Liv |
| 7 | 41 | IIIC | 3a | 0 | 2 | lobular | + | + | − | B, Li, Kid |
| 8 | 64 | IA | 0 | 0 | 2 | lobular | + | + | X | Liv, Lu, B |
| 9 | 43 | X | 1 | 0 | 3 | ductal | − | + | − | LN |
| 10 | 51 | IIIC | 3a | 1 | 2 | lobular | + | + | − | B, LN |
| 11 | 52 | IV | 3a | 1 | 2 | lobular | + | + | − | B |
| 12 | 48 | IIIC | 3a | 0 | 3 | ductal | + | + | − | B |
| 13 | 41 | IV | 1 | 1 | 2 | ductal | + | + | − | B |
| 14 | 49 | IIIC | 3a | 0 | 2 | lobular | + | + | − | B, LN, Per |
| 15 | 83 | IV | 0 | 1 | 2 | lobular | + | + | equivocal | B |
| 16 | 60 | IIB | 1 | 0 | 1 | ductal | + | + | − | LN, B, Liv |
| 17 | 40 | IIIC | 3b | 0 | 3 | ductal | − | − | − | Axilla |
| 18 | 42 | IV | 1 | 1 | 3 | ductal | + | + | − | B |
| 19 | 71 | IV | 1 | 1 | 2 | ductal | + | + | − | B, Lu |
| 20 | 75 | X | 1 | 0 | X | ductal | − | − | − | Local Scarf |
| 21 | 74 | X | 0 | 0 | X | DCIS | + | + | − | B |
| 22 | 41 | X | X | 0 | 2 | ductal | + | + | X | Liv, B |
| 23 | 79 | X | 0 | 0 | 3 | ductal | + | + | X | B, Skin |
| 24 | 61 | IIIC | 3a | 0 | 2 | ductal | + | + | − | B |
| 25 | 57 | IA | 0 | 0 | 2 | lobular‐ductal | + | + | X | B, Per, Ov, Tube |
| 26 | 70 | IB | 0 | 0 | 2 | DCIS | + | + | X | LN, B |
| 27 | 71 | IIIB | 2a | 0 | 2 | DCIS | + | − | − | B, Liv |
| 28 | 72 | IIIB | 3a | 0 | 3 | lobular | + | + | − | Stomach |
| 29 | 65 | IVA | 3a | 1 | 2 | lobular | + | + | − | B, Skin, Brain |
| 30 | 34 | X | 0 | 0 | 2 | ductal | + | + | − | B |
| 31 | 44 | IIB | 1 | 0 | 2 | ductal | + | + | − | B, Liv |
| 32 | 59 | X | 0 | 0 | 2 | lobular | + | + | − | Adnexa |
| 33 | 47 | IV | X | 1 | X | ductal | + | + | equivocal | B, Liv, Skin |
X: unknown (metastases were tested HER2‐negative); −: negative; +: positive; equivocal: immunohistochemistry 2+; DCIS: Ductal carcinoma in situ; B: bone; LN: lymph node; LIV: liver; Lu: lung; Ov: ovary; Per: peritoneum; Kid: kidney; Pat: patient; ER: estrogen receptor; PR: progesterone receptor.
Table 3.
HER2 status of circulating tumor cells (CTC) in samples analyzed for PIK3CA mutations in CTC.
| Patient‐ID | Total number of CTC/7.5 mL | Weakly HER2‐positive | Moderately HER2‐positive | Strongly HER2‐positive |
|---|---|---|---|---|
| 1 | 32 | 5 | 0 | 0 |
| 2 | 231 | 146 | 40 | 5 |
| 3 | 13 | 0 | 0 | 0 |
| 4 | 120 | 66 | 12 | 0 |
| 5 | 76 | 0 | 0 | 0 |
| 6 | 419 | n.d. | n.d. | n.d. |
| 7 | 36 | 25 | 5 | 3 |
| 7A (5 Ma) | 64 | 18 | 0 | 0 |
| 8 | 13 | 0 | 0 | 0 |
| 9 | 606 | 130 | 4 | 1 |
| 10 | 66 | 32 | 0 | 0 |
| 11 | 67 | 26 | 410 | 0 |
| 12 | 27 | 13 | 4 | 2 |
| 13 | 34 | 26 | 0 | 2 |
| 14 | 108 | 28 | 0 | 0 |
| 15 | 10 | 3 | 3 | 0 |
| 16 | 603 | 260 | 260 | 33 |
| 16A (1 Ma) | 56 | 7 | 0 | 0 |
| 17 | 238 | 0 | 0 | 0 |
| 18 | 271 | 191 | 50 | 10 |
| 19 | 400 | 350 | 0 | 0 |
| 19A (2 Ma) | 100 | 40 | 0 | 0 |
| 20 | 7 | 1 | 0 | 0 |
| 21 | 63 | 14 | 0 | 0 |
| 22 | 180 | 60 | 20 | 0 |
| 23 | 42 | 7 | 0 | 0 |
| 24 | 115 | 40 | 10 | 0 |
| 25 | 246 | 140 | 52 | 10 |
| 26 | 11 | 7 | 2 | 0 |
| 27 | 41 | 12 | 2 | 2 |
| 28 | 213 | 113 | 50 | 20 |
| 29 | 950 | 500 | 0 | 0 |
| 30 | 105 | 60 | 0 | 0 |
| 31 | 14 | 10 | 0 | 0 |
| 32 | 6 | 2 | 3 | 0 |
| 32A (6 Ma) | 56 | 10 | 33 | 10 |
| 33 | 120 | 30 | 0 | 0 |
CTC analysis 5, 1, 2 or 6 months after the initial analysis of samples 7, 16, 19 and 32, respectively; n.d.: not determined; samples 32 and 32A were collected during treatment.
Table 4.
Detection of PIK3CA mutations in circulating tumor cells (CTC).
| Patient‐ID | CTC‐ID | PIK3CA‐Exon 9 – GenomiPhi | PIK3CA‐Exon 20 – GenomiPhi | ||
|---|---|---|---|---|---|
| E542 | E545 | M1043 | H1047 | ||
| 2 | 1 | WTa | WT | WT | WT |
| 3 | 1 | WT | WT | WT | WT |
| 4 | 1 | WT | WT | WT | p.H1047R (c.CAT > CGT) |
| 3 | WT | WT | WT | p.H1047R (c.CAT > CGT) | |
| 4 | n.e.b | n.e. | WT | p.H1047R (c.CAT > CGT) | |
| 5 | 2 | WT | WT | WT | WT |
| 6 | 1 | WT | WT | WT | WT |
| 4 | WT | WT | WT | WT | |
| 7 | 1 | WT | WT | WT | WT |
| 3 | n.e. | n.e. | WT | WT | |
| 7A | 1 | WT | WT | WT | WT |
| 3 | WT | WT | n.e. | n.e. | |
| 4 | WT | WT | n.e. | n.e. | |
| 6 | WT | WT | WT | WT | |
| 7 | WT | WT | WT | WT | |
| 8 | WT | WT | WT | WT | |
| 9 | WT | WT | WT | WT | |
| 8 | 1 | WT | p.E545K (c.GAG > AAG) | WT | WT |
| 2 | WT | p.E545K (c.GAG > AAG) | WT | WT | |
| 3 | WT | WT | WT | WT | |
| 9 | 1 | WT | WT | WT | WT |
| 4 | WT | WT | WT | WT | |
| 5 | n.e. | n.e. | WT | WT | |
| 8 | WT | WT | WT | WT | |
| 11 | 2 | WT | WT | WT | WT |
| 3 | WT | WT | WT | p.H1047R (c.CAT > CGT) | |
| 4 | WT | WT | WT | p.H1047R (c.CAT > CGT) | |
| 6 | WT | WT | WT | WT | |
| 7 | WT | WT | WT | WT | |
| 8 | WT | WT | WT | p.H1047R (c.CAT > CGT) | |
| 15 | 2 | WT | WT | WT | WT |
| 16 | 2 | n.e. | n.e. | WT | p.H1047R (c.CAT > CGT) |
| 8 | n.e. | n.e. | WT | WT | |
| 16A | 1 | n.e. | n.e. | WT | WT |
| 2 | WT | p.E545K (c.GAG > AAG) | WT | WT | |
| 17 | 1 | WT | WT | WT | WT |
| 3 | WT | WT | WT | WT | |
| 4 | WT | WT | n.e. | n.e. | |
| 5 | WT | WT | WT | WT | |
| 18 | 1 | WT | WT | WT | WT |
| 3 | WT | WT | n.e. | n.e. | |
| 4 | WT | WT | WT | WT | |
| 19 | Cluster | WT | WT | WT | WT |
| 19A | 4 | WT | WT | n.e. | n.e. |
| 20 | 1 | WT | WT | WT | WT |
| 21 | 6 | WT | WT | WT | WT |
| 7 | WT | WT | WT | WT | |
| 22 | 1 | WT | WT | n.e. | n.e. |
| 2 | WT | WT | WT | WT | |
| 23 | 1 | WT | WT | WT | WT |
| 4 | WT | WT | n.e. | n.e. | |
| 24 | 4 | WT | WT | WT | WT |
| 5 | WT | WT | WT | WT | |
| 25 | 2 | WT | WT | WT | WT |
| 26 | 3 | WT | WT | WT | WT |
| 28 | 1 | WT | WT | WT | WT |
| 2 | WT | WT | WT | WT | |
| 3 | p.E542K (c.GAA > AAA) | WT | WT | WT | |
| 4 | p.E542K (c.GAA > AAA) | WT | WT | WT | |
| 5 | p.E542K (c.GAA > AAA) | WT | WT | WT | |
| 6 | n.e. | n.e. | WT | WT | |
| 29 | 1 | WT | WT | WT | WT |
| 2 | WT | WT | WT | WT | |
| 3 | WT | WT | n.e. | n.e. | |
| 4 | WT | WT | WT | WT | |
| 30 | 1 | WT | WT | WT | WT |
| 31 | 1 | n.e. | n.e. | WT | WT |
| 2 | WT | WT | WT | WT | |
| 3 | WT | WT | n.e. | n.e. | |
| 32 | 4 | WT | WT | WT | WT |
| 32A | 1 | n.e. | n.e. | WT | WT |
| 5 | WT | WT | WT | WT | |
| 33 | 1 | WT | WT | p.M1043V (c.ATG > GTG) | WT |
| 4 | WT | WT | n.e. | n.e. | |
| 5 | WT | WT | p.M1043V (c.ATG > GTG) | WT | |
| Patient‐ID | CTC‐ID | PIK3CA‐Exon 9 – Ampli1™ | PIK3CA‐Exon 20 – Ampli1™ | ||
| E542 | E545 | M1043 | H1047 | ||
| 1 | 1 | WTa | WT | WT | WT |
| 7 | 6 | n.e. | n.e. | WT | WT |
| 7 | n.e. | n.e. | WT | WT | |
| 10 | 1 | WT | WT | WT | p.H1047R (c.CAT > CGT) |
| 3 | WT | WT | WT | p.H1047R (c.CAT > CGT) | |
| 8 | WT | WT | WT | p.H1047R (c.CAT > CGT) | |
| 9 | WT | WT | WT | p.H1047R (c.CAT > CGT) | |
| 12 | 1 | WT | p.E545K (c.GAG > AAG) | WT | WT |
| 3 | WT | p.E545K (c.GAG > AAG) | WT | WT | |
| 4 | WT | p.E545K (c.GAG > AAG) | WT | WT | |
| 6 | WT | p.E545K (c.GAG > AAG) | WT | WT | |
| 13 | 4 | WT | WT | WT | p.H1047L (c.CAT > CTT) |
| 5 | WT | WT | WT | p.H1047L (c.CAT > CTT) | |
| 7 | WT | WT | WT | p.H1047L (c.CAT > CTT) | |
| 8 | WT | WT | WT | p.H1047L (c.CAT > CTT) | |
| 14 | 2 | WT | WT | WT | WT |
| 3 | WT | WT | n.e. | n.e. | |
| 4 | WT | WT | WT | WT | |
| 6 | WT | WT | WT | p.H1047R (c.CAT > CGT) | |
| 9 | n.e. | n.e. | WT | WT | |
| 10 | n.e. | n.e. | WT | WT | |
| 17 | 6 | WT | WT | WT | WT |
| 7 | WT | WT | WT | WT | |
| 10 | n.e. | n.e. | WT | WT | |
| 27 | 2 | p.E542K (c.GAA > AAA) | WT | WT | WT |
| 3 | WT | WT | WT | WT | |
| 4 | WT | WT | WT | WT | |
| 5 | p.E542K (c.GAA > AAA) | WT | WT | WT | |
| 6 | n.e. | n.e. | WT | WT | |
| 7 | p.E542K (c.GAA > AAA | WT | WT | WT | |
| 8 | p.E542K (c.GAA > AAA) | WT | n.e. | n.e. | |
| 29 | 8 | WT | WT | WT | WT |
| 9 | WT | WT | WT | WT | |
| 10 | n.e. | n.e. | WT | p.H1047R (c.CAT > CGT) | |
| 33 | 6 | WT | WT | p.M1043V (c.ATG > GTG) | WT |
| 7 | WT | WT | WT | WT | |
| 8 | WT | WT | p.M1043V (c.ATG > GTG) | WT | |
| 9 | WT | WT | WT | WT | |
| 10 | n.e. | n.e. | p.M1043V (c.ATG > GTG) | WT | |
WT wildtype.
n.e. not evaluable; from cases 7, 17, 29 and 33 (italic), CTC were either analyzed by the GenomiPhi WGA or by the Ampli1™ WGA.
Table 3 displays the results of CTC detection and determination of the CTC HER2 status by immunocytochemistry for these 33 patients. Because of the presence of HER2‐strongly positive CTC in the screening sample, patients 7, 16 and 32 were enrolled in the DETECT III study and randomized for treatment with lapatinib. Interestingly, blood samples drawn at the second time point from patients 7 and 16, did not contain HER2‐strongly positive CTC anymore. Samples 32 and 32A were collected 5 and 11 months after the initial blood draw, respectively, during the course of treatment. Thus, our results show that HER2‐strongly positive CTC detected in the screening sample, were not eliminated during treatment of this patient (still blinded for receiving lapatinib or not).
3.2. Detection of PIK3CA mutations in CTC
Out of 37 blood samples collected from 33 patients (2, 3, 4), in total 259 (n = 1–20 per sample) CTC were recovered by micromanipulation. At initial diagnosis, most primary tumors were similarly distributed between ductal (n = 17) and lobular (n = 13) histological types and revealed to be estrogen and progesterone receptor positive (Table 2). As HER2 negativity of primary tumors was required for enrollment in the screening for DETECT III/IV studies, all accessible primary tumors were scored HER2‐negative or HER2‐equivocal. Detection of CTC PIK3CA mutations was not associated with the location and multiplicity of metastases at time of CTC analysis (2, 4).
In our study we applied two different WGA approaches to amplify DNA from single CTC, GenomiPhi and Ampli1™. Table 4 shows all individual CTC analyzed for PIK3CA mutations arranged according to the respective WGA. To compare both methods, we analyzed single isolated MCF‐7 breast cancer cell line cells (Riethdorf et al., 2016) processed by the CellSearch system for the known E545K mutation in exon 9. While this heterozygous mutation could be identified in 4/6 MCF‐7 cells after GenomiPhi WGA, it was detectable in 4/8 cells after Ampli1™ WGA in a heterozygous and in one cell in a homozygous manner. Moreover, from four patients individual CTC were analyzed for PIK3CA mutations in exons 9 and 20 after GenomiPhi and Ampli1™ WGA (Table 4, patients 7, 17, 29, and 33). Although it is not possible to analyze DNA from one CTC with two WGA approaches and heterogeneity among individual CTC from the same patient cannot be excluded, in these four cases similar detection rates of mutations were observed for GenomiPhi and Ampli1™ WGA products (Table 4).
In total, from 114 CTC, PIK3CA sequence results were obtained (Table 4). Both exon 9 and 20 were evaluable in 85 CTC from 33 patients. We detected at least one CTC with mutations in codons 542, 545, 1043 or 1047 in 12/33 patients (36.4%) and 36/114 CTC (31.6%) harbored one of these mutations (Figure 2, Table 4).
Figure 2.
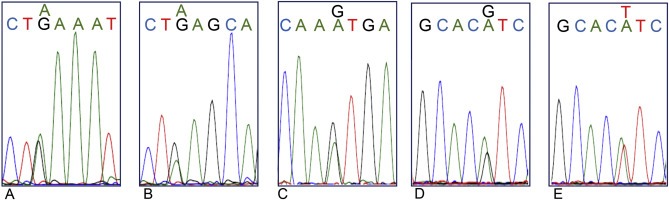
Hotspot mutations of the PIK3CA gene in exon 9 (nucleotide exchanges c.1624 G > A (A) or c.1633 G > A (B) leading to amino acid replacements of glutamic acid to lysine p.E542K and p.E545K, respectively) or exon 20 (c.3127 A > G (C), c.3140 A > G (D) or A > T (E) leading to replacement of methionine by valine p.M1043V or histidine by arginine or leucine p.H1047R or p.H1047L, respectively).
The hot spot mutation c.1624 G > A (p.E542K, glutamic acid to lysine) was only detected in CTC from two patients (27, 28, Table 4). While 4/6 evaluable CTC from patient 27 carried this mutation, this was true for 3/5 evaluable CTC from patient 28.
Point mutations leading to amino acid exchanges of glutamic acid to lysine in the mutational hot spot c.1633 (G > A, p.E545K) could be detected in three cases. All four CTC, 2/3 CTC and 1 CTC from cases 12, 8, and 16 respectively, harbored this mutation.
In six patients, CTC carrying the hotspot mutation c.3140 A > G (codon 1047 of exon 20, histidine to arginine) were identified. In two of these cases all analyzed CTC harbored the mutation (Table 4), while in the other four cases both CTC with wildtype or with the mutated codon were observed.
Besides the frequently occurring hot spot mutations, also the rare mutations c.3140 A > T (p.H1047L, histidine to leucine) and c. 3127 A > G (p.M1043V, methionine to valine) (Gymnopoulos et al., 2007) were identified in 4/4 CTC from patients 13 and 5/7 CTC from patient 33, respectively (Table 4).
In Table 4 the PIK3CA mutational status for all analyzed CTC is shown, demonstrating frequent heterogeneity regarding a particular mutation among individual CTC. In most CTC, the mutations were heterozygous with parallel appearance of wildtype and mutated allele, however, in a considerable number of CTC isolated from individual patients, both in GenomiPhi and Ampli1™ WGA products also mutations that appeared to be homozygous were detected suggesting that during WGA a preferential amplification of one allele might have occurred leading to allelic drop out. Thus, underestimation of mutation rates cannot be excluded.
From three patients CTC were analyzed at two time points before the start of study therapeutic intervention (Table 3). While all CTC from two out of these cases were detected with the wildtype sequences for exons 9 and 20, in case 16 one CTC with a mutation in codon 1047 of exon 20 was found, and one CTC of the second sample carried a mutation in codon 545 of exon 9 (Table 4).
4. Discussion
Targeted therapy that specifically eliminates cancer cells with less harm to normal cells has attracted increasing attention for treatment of breast cancer. However, identifying the appropriate target molecule in aggressive tumor cells is challenging. Thus, biomarkers predictive for treatment response reflecting the actual state of the disease are urgently needed. In this context, the question whether exploration of CTC could support guiding breast cancer therapy is intensively discussed. First studies incorporating detection and characterization of CTC for treatment decisions and stratification of patients have been initiated (Beije et al., 2015; Bidard et al., 2013) including the DETECT III–V studies (Beije et al., 2015; Bidard et al., 2013; Schramm et al., 2016). Also in the metastatic setting a benefit of HER2‐targeted therapies on clinical outcome for patients with HER2‐positive tumors has been observed (Mendes et al., 2015; Schramm et al., 2015). Thus, in DETECT III, patients with mBC diagnosed earlier with HER2‐negative primary tumors, but HER2‐positive CTC in metastatic disease are treated with the HER2‐targeted tyrosine kinase inhibitor lapatinib in a randomized fashion (Schramm et al., 2016). To get enrolled in this study, at least one CTC with strong HER2 positivity has to be detected in 7.5 mL of peripheral blood collected from these patients. Among the 290 patients screened in Hamburg for participation in the DETECT III study we detected ≥1 CTC/7.5 mL in 179 (61.7%) and ≥5 CTC/7.5 mL in 101 patients (34.8%). HER2‐strongly positive CTC were found in 15 CTC‐positive patients only.
Intrinsic or de novo acquired resistance to HER2‐therapies has been described (Rexer and Arteaga, 2012) and no screening test to predict resistance to these therapies is currently available. In previous experimental studies, as well as in breast cancer patients, the contribution of an inactivation of the PTEN gene to the development of resistance against HER2‐targeting therapies in patients with HER2‐positive tumors has been reported (Burnett et al., 2015; Ebbesen et al., 2016). Moreover, it has been suggested that mutations in the PIK3CA gene play an important role in mechanisms leading to this resistance (Ahmad et al., 2014). Thus, the aim of the present study was to screen CTC for mutations in the PIK3CA gene as one of previously identified resistance mechanisms (Ibrahim et al., 2015; Wilks, 2015).
In blood samples from 15 out of 179 CTC‐positive patients (8.4%) at least one CTC with strong HER2 expression was detected, but no patient with exclusively HER2‐strongly positive CTC could be identified. This low frequency compared to previous studies (Fehm et al., 2010) is probably due to differences in classifying CTC with moderate to strong intensity of HER2 immunofluorescence. Moreover, the analysis of repeated blood samples prior to the therapeutic intervention in the DETECT studies yielded in different CTC HER2 results and reflects strong heterogeneity regarding the HER2 status among the CTC from an individual patient. Based on these findings, we additionally applied a FISH test for 11 patient samples to validate HER2 gene amplification in CTC with known HER2 expression. Our results demonstrate that moderate intensity of HER2 immunofluorescence observed in a significant number of CTC was not due to an amplification of the HER2 gene. In conclusion, we show that there is a good correlation of the results obtained by immunofluorescence and FISH. Our analysis on a high number of CTC suggests that scoring of the HER2 status by immunofluorescence provides reliable results.
Although it is known that not all tumor cells with increased HER2 protein level also show HER2 gene amplification (Korkaya and Wicha, 2013), applying the optimal method for evaluating the HER2 status of CTC still needs further substantiation. In a previous study, Polzer et al. (2014) detected HER2 gene amplification in CTC by array CGH in 7/42 patients. Interestingly, in these cases all analyzed CTC homogeneously displayed HER2 gene amplification. In contrast, the HER2 amplification status was different between primary tumors and CTC from the majority of analyzed samples (Polzer et al., 2014).
Our study is the first to explore CTC for PIK3CA mutations at single cell level in patients screened or selected for enrollment in the DETECT III study. We detected mutations in the codons 542, 545 of exon 9 or 1043 and 1047 of exon 20 in at least one CTC of 12/33 (36.4%) patients. The same mutations were found by Polzer et al. (2014) for single CTC isolated with the DEPArray, however the blood samples were obtained from a heterogeneous cohort of patients diagnosed with primary or mBC. In our study, micromanipulation was performed manually while other systems work automatically with automatic scanning as well as relocalization of the previously identified CTC. Thus, single CTC analysis regardless of the CTC isolation technique and the WGA procedure used, might result in a higher detection rate of PIK3CA mutations than the SNaPshot method analyzing the whole CTC/leukocyte pool enriched by anti‐EpCAM antibodies with the CellSearch® system. Despite the SNaPshot technology being simple and fast, information about heterogeneity of individual CTC is not provided and finding the mutation in a low number of CTC is likely to be limited when high numbers of leukocytes were simultaneously enriched. Nevertheless, the authors were able to detect PIK3CA mutations in blood samples analyzed within the DETECT III study with as low as 2 CTC isolated from one CellSearch® cartridge (Schneck et al., 2013).
Heterogeneity of PIK3CA mutational status among CTC isolated from individual cases was observed in different studies including ours (Deng et al., 2014; Pestrin et al., 2015; Polzer et al., 2014). This finding is in accordance with the known genomic intra‐ and inter‐patient heterogeneity of CTC (Alix‐Panabieres and Pantel, 2014; Gasch et al., 2013). However, we cannot exclude that methodological problems might contribute to the observed heterogeneity, e.g., allelic drop out by preferential amplification of one allele during WGA leading to underestimation of the prevalence of heterozygous mutations remains to be elucidated. Although in our study the percentage of mutated CTC was higher in Ampli1™ compared to GenomiPhi WGA products, this difference could not be confirmed for MCF‐7 cell line cells with a known heterozygous mutation in exon 9. Moreover, a recently published study comparing 7 different WGA approaches did not describe higher detection rates of single nucleotide variants in Ampli1™ compared to GenomiPhi WGA products (Hou et al., 2015).
The most frequent mutations in our study occurred in codon 1047 of exon 20, where base substitutions affect the activation loop of the kinase domain, while mutations occurring in the hot spot regions of exon 9 have an impact on the helical domain of the PIK3CA protein. Mutated PIK3CA proteins possess increased catalytic activity resulting in enhanced downstream signaling and oncogenic transformation in vitro (Bader et al., 2006; Gymnopoulos et al., 2007). Recently, two studies reported that the mutation p.H1047R induces multipotency and dedifferentiation of tumor cells, thereby contributing to breast tumor heterogeneity in mouse models (Koren et al., 2015; Van Keymeulen et al., 2015).
Dysregulation of the PI3 kinase pathway has been described in 20–40% of primary breast tumors (Loi et al., 2010). Clinical relevance of these mostly gain of function mutations is still controversially discussed. A recently published meta‐analysis incorporating data from 19 studies and 1720 patients with early or metastatic HER2‐positive breast cancer demonstrated that carrying a PIK3CA mutation or not is not associated with a differential benefit from HER2‐targeted therapies (Ibrahim et al., 2015). In contrast, PIK3CA mutations were predictive for a better outcome in estrogen receptor‐positive, HER2‐negative breast cancer treated with endocrine therapy (Fu et al., 2013; Loi et al., 2010; Mukohara, 2015). We identified PIK3CA mutations only in CTC from patients with ER‐positive primary tumors and did not analyze ER expression of CTC. Moreover, we could not find a preferential detection of a particular PIK3CA mutation in association with the HER2 status of CTC.
In the present study we did not analyze the corresponding primary tumors for the presence of PIK3CA mutations. However, in a small number of studies, the occurrence of PIK3CA mutations in CTC and the corresponding primary tumors was compared. Concordantly, disparate results were obtained in a high number of cases (Deng et al., 2014; Markou et al., 2014; Pestrin et al., 2015; Polzer et al., 2014). However, the interpretation of these results is difficult. Besides, biological selection processes during the dissemination process technical issues might play an important role. Different technologies for enrichment, detection and isolation of CTC, WGA of single cell DNA, detection of mutational status and quality control have been applied in these studies. Thus, attention has to be focused to further improve and standardize the entire workflow.
In summary, our study shows that detection of PIK3CA mutations in hotspot regions of exon 9 and 20 in CTC is feasible and harbors the potential to be used as biomarker for predicting resistance to HER2‐targeted therapies. Our findings demonstrate strong heterogeneity regarding HER2 expression and PIK3CA mutational status of individual CTC in the same patient. Thus, combining enumeration and mutational profiling of CTC at single cell level might improve therapeutic decision‐making in mBC patients. Further investigation in future interventional studies are now required to assess the clinical utility of molecular characterization of CTC in breast cancer patients.
5. Conclusion
Here, we analyzed CTC from mBC patients with initially HER2‐negative primary tumors, but HER2‐positive CTC recruited for the DETECT III study for PIK3CA. Mutations in the hotspot regions of exon 9 and 20 of the PIK3CA gene can be detected frequently in CTC and might provide insights into mechanisms of resistance to HER2‐targeted therapies.
Disclosure
VM has received speaker honoraria and WJ has received speaker honoraria and research grant from Novartis Pharma GmbH Nürnberg, Germany. This study was partly funded by research grants from Novartis Pharma GmbH and Janssen Diagnostics, Huntington Valley, PA, USA to KP and SR.
Supporting information
The following are the supplementary data related to this article:
Supplementary data
Supplementary data
Acknowledgements
We thank Brad Foulk (Janssen Diagnostics) for providing FISH probes and protocols for FISH analysis as well as Doug Keene and Bryan Mosko (Janssen Diagnostics) for providing the Neon device and the bleaching station and technical support. This study was supported by the ERC‐2010‐AdG_20100317 DISSECT to KP, partly funded by research grants from Novartis Pharma GmbH, Nürnberg Germany and Janssen Diagnostics, Huntington Valley, PA, USA to KP and SR and supported from the Innovative Medicines Initiative Joint Undertaking under grant agreement no. 115749, resources of which are composed of financial contribution from the European Union's Seventh Framework Programme (FP7/2007‐2013) and EFPIA companies' in kind contribution to KP and TMG.
Supplementary data 1.
1.1.
Supplementary data related to this article can be found at http://dx.doi.org/10.1016/j.molonc.2016.07.005.
Gasch Christin, Oldopp Theresa, Mauermann Oliver, Gorges Tobias M., Andreas Antje, Coith Cornelia, Müller Volkmar, Fehm Tanja, Janni Wolfgang, Pantel Klaus, Riethdorf Sabine, (2016), Frequent detection of PIK3CA mutations in single circulating tumor cells of patients suffering from HER2-negative metastatic breast cancer, Molecular Oncology, 10, doi: 10.1016/j.molonc.2016.07.005.
References
- Ahmad, S. , Gupta, S. , Kumar, R. , Varshney, G.C. , Raghava, G.P. , 2014. Herceptin resistance database for understanding mechanism of resistance in breast cancer patients. Sci. Rep. 4, 4483 [DOI] [PMC free article] [PubMed] [Google Scholar]
- Alix-Panabieres, C. , Pantel, K. , 2014. Challenges in circulating tumour cell research. Nat. Rev. Cancer 14, 623–631. [DOI] [PubMed] [Google Scholar]
- Attard, G. , Swennenhuis, J.F. , Olmos, D. , Reid, A.H. , Vickers, E. , A'Hern, R. , Levink, R. , Coumans, F. , Moreira, J. , Riisnaes, R. , Oommen, N.B. , Hawche, G. , Jameson, C. , Thompson, E. , Sipkema, R. , Carden, C.P. , Parker, C. , Dearnaley, D. , Kaye, S.B. , Cooper, C.S. , Molina, A. , Cox, M.E. , Terstappen, L.W. , de Bono, J.S. , 2009. Characterization of ERG, AR and PTEN gene status in circulating tumor cells from patients with castration-resistant prostate cancer. Cancer Res. 69, 2912–2918. [DOI] [PubMed] [Google Scholar]
- Bader, A.G. , Kang, S. , Vogt, P.K. , 2006. Cancer-specific mutations in PIK3CA are oncogenic in vivo. Proc. Natl. Acad. Sci. U. S. A 103, 1475–1479. [DOI] [PMC free article] [PubMed] [Google Scholar]
- Baker, C.L. , Vaughn, C.P. , Samowitz, W.S. , 2012. A PIK3CA pyrosequencing-based assay that excludes pseudogene interference. J. Mol. Diagn. 14, 56–60. [DOI] [PubMed] [Google Scholar]
- Beije, N. , Jager, A. , Sleijfer, S. , 2015. Circulating tumor cell enumeration by the CellSearch system: the clinician's guide to breast cancer treatment?. Cancer Treat. Rev. 41, 144–150. [DOI] [PubMed] [Google Scholar]
- Bidard, F.C. , Fehm, T. , Ignatiadis, M. , Smerage, J.B. , Alix-Panabieres, C. , Janni, W. , Messina, C. , Paoletti, C. , Muller, V. , Hayes, D.F. , Piccart, M. , Pierga, J.Y. , 2013. Clinical application of circulating tumor cells in breast cancer: overview of the current interventional trials. Cancer Metastasis Rev. 32, 179–188. [DOI] [PMC free article] [PubMed] [Google Scholar]
- Burnett, J.P. , Korkaya, H. , Ouzounova, M.D. , Jiang, H. , Conley, S.J. , Newman, B.W. , Sun, L. , Connarn, J.N. , Chen, C.S. , Zhang, N. , Wicha, M.S. , Sun, D. , 2015. Trastuzumab resistance induces EMT to transform HER2(+) PTEN(−) to a triple negative breast cancer that requires unique treatment options. Sci. Rep. 5, 15821 [DOI] [PMC free article] [PubMed] [Google Scholar]
- Deng, G. , Krishnakumar, S. , Powell, A.A. , Zhang, H. , Mindrinos, M.N. , Telli, M.L. , Davis, R.W. , Jeffrey, S.S. , 2014. Single cell mutational analysis of PIK3CA in circulating tumor cells and metastases in breast cancer reveals heterogeneity, discordance, and mutation persistence in cultured disseminated tumor cells from bone marrow. BMC Cancer 14, 456 [DOI] [PMC free article] [PubMed] [Google Scholar]
- Ebbesen, S.H. , Scaltriti, M. , Bialucha, C.U. , Morse, N. , Kastenhuber, E.R. , Wen, H.Y. , Dow, L.E. , Baselga, J. , Lowe, S.W. , 2016. Pten loss promotes MAPK pathway dependency in HER2/neu breast carcinomas. Proc. Natl. Acad. Sci. U. S. A 113, 3030–3035. [DOI] [PMC free article] [PubMed] [Google Scholar]
- Fehm, T. , Muller, V. , Aktas, B. , Janni, W. , Schneeweiss, A. , Stickeler, E. , Lattrich, C. , Lohberg, C.R. , Solomayer, E. , Rack, B. , Riethdorf, S. , Klein, C. , Schindlbeck, C. , Brocker, K. , Kasimir-Bauer, S. , Wallwiener, D. , Pantel, K. , 2010. HER2 status of circulating tumor cells in patients with metastatic breast cancer: a prospective, multicenter trial. Breast Cancer Res. Treat 124, 403–412. [DOI] [PubMed] [Google Scholar]
- Fu, X. , Osborne, C.K. , Schiff, R. , 2013. Biology and therapeutic potential of PI3K signaling in ER+/HER2-negative breast cancer. Breast 22, (Suppl. 2) S12–S18. [DOI] [PMC free article] [PubMed] [Google Scholar]
- Gasch, C. , Bauernhofer, T. , Pichler, M. , Langer-Freitag, S. , Reeh, M. , Seifert, A.M. , Mauermann, O. , Izbicki, J.R. , Pantel, K. , Riethdorf, S. , 2013. Heterogeneity of epidermal growth factor receptor status and mutations of KRAS/PIK3CA in circulating tumor cells of patients with colorectal cancer. Clin. Chem. 59, 252–260. [DOI] [PubMed] [Google Scholar]
- Gasch, C. , Pantel, K. , Riethdorf, S. , 2015. Whole genome amplification in genomic analysis of single circulating tumor cells. Methods Mol. Biol. 1347, 221–232. [DOI] [PubMed] [Google Scholar]
- Georgoulias, V. , Bozionelou, V. , Agelaki, S. , Perraki, M. , Apostolaki, S. , Kallergi, G. , Kalbakis, K. , Xyrafas, A. , Mavroudis, D. , 2012. Trastuzumab decreases the incidence of clinical relapses in patients with early breast cancer presenting chemotherapy-resistant CK-19mRNA-positive circulating tumor cells: results of a randomized phase II study. Ann. Oncol. 23, 1744–1750. [DOI] [PubMed] [Google Scholar]
- Gymnopoulos, M. , Elsliger, M.A. , Vogt, P.K. , 2007. Rare cancer-specific mutations in PIK3CA show gain of function. Proc. Natl. Acad. Sci. U. S. A 104, 5569–5574. [DOI] [PMC free article] [PubMed] [Google Scholar]
- Hou, Y. , Wu, K. , Shi, X. , Li, F. , Song, L. , Wu, H. , Dean, M. , Li, G. , Tsang, S. , Jiang, R. , Zhang, X. , Li, B. , Liu, G. , Bedekar, N. , Lu, N. , Xie, G. , Liang, H. , Chang, L. , Wang, T. , Chen, J. , Li, Y. , Zhang, X. , Yang, H. , Xu, X. , Wang, L. , Wang, J. , 2015. Comparison of variations detection between whole-genome amplification methods used in single-cell resequencing. Gigascience 4, 37 [DOI] [PMC free article] [PubMed] [Google Scholar]
- Hurst, C.D. , Zuiverloon, T.C. , Hafner, C. , Zwarthoff, E.C. , Knowles, M.A. , 2009. A SNaPshot assay for the rapid and simple detection of four common hotspot codon mutations in the PIK3CA gene. BMC Res. Notes 2, 66 [DOI] [PMC free article] [PubMed] [Google Scholar]
- Ibrahim, E.M. , Kazkaz, G.A. , Al-Mansour, M.M. , Al-Foheidi, M.E. , 2015. The predictive and prognostic role of phosphatase phosphoinositol-3 (PI3) kinase (PIK3CA) mutation in HER2-positive breast cancer receiving HER2-targeted therapy: a meta-analysis. Breast Cancer Res. Treat 152, 463–476. [DOI] [PubMed] [Google Scholar]
- Joosse, S.A. , Gorges, T.M. , Pantel, K. , 2015. Biology, detection, and clinical implications of circulating tumor cells. EMBO Mol. Med. 7, 1–11. [DOI] [PMC free article] [PubMed] [Google Scholar]
- Koren, S. , Reavie, L. , Couto, J.P. , De Silva, D. , Stadler, M.B. , Roloff, T. , Britschgi, A. , Eichlisberger, T. , Kohler, H. , Aina, O. , Cardiff, R.D. , Bentires-Alj, M. , 2015. PIK3CA(H1047R) induces multipotency and multi-lineage mammary tumours. Nature 525, 114–118. [DOI] [PubMed] [Google Scholar]
- Korkaya, H. , Wicha, M.S. , 2013. HER2 and breast cancer stem cells: more than meets the eye. Cancer Res. 73, 3489–3493. [DOI] [PMC free article] [PubMed] [Google Scholar]
- Loi, S. , Haibe-Kains, B. , Majjaj, S. , Lallemand, F. , Durbecq, V. , Larsimont, D. , Gonzalez-Angulo, A.M. , Pusztai, L. , Symmans, W.F. , Bardelli, A. , Ellis, P. , Tutt, A.N. , Gillett, C.E. , Hennessy, B.T. , Mills, G.B. , Phillips, W.A. , Piccart, M.J. , Speed, T.P. , McArthur, G.A. , Sotiriou, C. , 2010. PIK3CA mutations associated with gene signature of low mTORC1 signaling and better outcomes in estrogen receptor-positive breast cancer. Proc. Natl. Acad. Sci. U. S. A 107, 10208–10213. [DOI] [PMC free article] [PubMed] [Google Scholar]
- Markou, A. , Farkona, S. , Schiza, C. , Efstathiou, T. , Kounelis, S. , Malamos, N. , Georgoulias, V. , Lianidou, E. , 2014. PIK3CA mutational status in circulating tumor cells can change during disease recurrence or progression in patients with breast cancer. Clin. Cancer Res. 20, 5823–5834. [DOI] [PubMed] [Google Scholar]
- Mendes, D. , Alves, C. , Afonso, N. , Cardoso, F. , Passos-Coelho, J.L. , Costa, L. , Andrade, S. , Batel-Marques, F. , 2015. The benefit of HER2-targeted therapies on overall survival of patients with metastatic HER2-positive breast cancer – a systematic review. Breast Cancer Res. 17, 140 [DOI] [PMC free article] [PubMed] [Google Scholar]
- Mukohara, T. , 2011. Mechanisms of resistance to anti-human epidermal growth factor receptor 2 agents in breast cancer. Cancer Sci. 102, 1–8. [DOI] [PubMed] [Google Scholar]
- Mukohara, T. , 2015. PI3K mutations in breast cancer: prognostic and therapeutic implications. Breast Cancer (Dove Med Press) 7, 111–123. [DOI] [PMC free article] [PubMed] [Google Scholar]
- Nagata, Y. , Lan, K.H. , Zhou, X. , Tan, M. , Esteva, F.J. , Sahin, A.A. , Klos, K.S. , Li, P. , Monia, B.P. , Nguyen, N.T. , Hortobagyi, G.N. , Hung, M.C. , Yu, D. , 2004. PTEN activation contributes to tumor inhibition by trastuzumab, and loss of PTEN predicts trastuzumab resistance in patients. Cancer Cell 6, 117–127. [DOI] [PubMed] [Google Scholar]
- Neves, R.P. , Raba, K. , Schmidt, O. , Honisch, E. , Meier-Stiegen, F. , Behrens, B. , Mohlendick, B. , Fehm, T. , Neubauer, H. , Klein, C.A. , Polzer, B. , Sproll, C. , Fischer, J.C. , Niederacher, D. , Stoecklein, N.H. , 2014. Genomic high-resolution profiling of single CKpos/CD45neg flow-sorting purified circulating tumor cells from patients with metastatic breast cancer. Clin. Chem. 60, 1290–1297. [DOI] [PubMed] [Google Scholar]
- Pestrin, M. , Salvianti, F. , Galardi, F. , De Luca, F. , Turner, N. , Malorni, L. , Pazzagli, M. , Di Leo, A. , Pinzani, P. , 2015. Heterogeneity of PIK3CA mutational status at the single cell level in circulating tumor cells from metastatic breast cancer patients. Mol. Oncol. 9, 749–757. [DOI] [PMC free article] [PubMed] [Google Scholar]
- Polzer, B. , Medoro, G. , Pasch, S. , Fontana, F. , Zorzino, L. , Pestka, A. , Andergassen, U. , Meier-Stiegen, F. , Czyz, Z.T. , Alberter, B. , Treitschke, S. , Schamberger, T. , Sergio, M. , Bregola, G. , Doffini, A. , Gianni, S. , Calanca, A. , Signorini, G. , Bolognesi, C. , Hartmann, A. , Fasching, P.A. , Sandri, M.T. , Rack, B. , Fehm, T. , Giorgini, G. , Manaresi, N. , Klein, C.A. , 2014. Molecular profiling of single circulating tumor cells with diagnostic intention. EMBO Mol. Med. 6, 1371–1386. [DOI] [PMC free article] [PubMed] [Google Scholar]
- Rexer, B.N. , Arteaga, C.L. , 2012. Intrinsic and acquired resistance to HER2-targeted therapies in HER2 gene-amplified breast cancer: mechanisms and clinical implications. Crit. Rev. Oncog. 17, 1–16. [DOI] [PMC free article] [PubMed] [Google Scholar]
- Riethdorf, S. , Frey, S. , Santjer, S. , Stoupiec, M. , Otto, B. , Riethdorf, L. , Koop, C. , Wilczak, W. , Simon, R. , Sauter, G. , Pantel, K. , Assmann, V. , 2016. Diverse expression patterns of the EMT suppressor grainyhead-like 2 (GRHL2) in normal and tumour tissues. Int. J. Cancer 138, 949–963. [DOI] [PubMed] [Google Scholar]
- Riethdorf, S. , Muller, V. , Zhang, L. , Rau, T. , Loibl, S. , Komor, M. , Roller, M. , Huober, J. , Fehm, T. , Schrader, I. , Hilfrich, J. , Holms, F. , Tesch, H. , Eidtmann, H. , Untch, M. , von Minckwitz, G. , Pantel, K. , 2010. Detection and HER2 expression of circulating tumor cells: prospective monitoring in breast cancer patients treated in the neoadjuvant GeparQuattro trial. Clin. Cancer Res. 16, 2634–2645. [DOI] [PubMed] [Google Scholar]
- Rimawi, M.F. , Schiff, R. , Osborne, C.K. , 2015. Targeting HER2 for the treatment of breast cancer. Annu. Rev. Med. 66, 111–128. [DOI] [PubMed] [Google Scholar]
- Sansal, I. , Sellers, W.R. , 2004. The biology and clinical relevance of the PTEN tumor suppressor pathway. J. Clin. Oncol. 22, 2954–2963. [DOI] [PubMed] [Google Scholar]
- Schneck, H. , Blassl, C. , Meier-Stiegen, F. , Neves, R.P. , Janni, W. , Fehm, T. , Neubauer, H. , 2013. Analysing the mutational status of PIK3CA in circulating tumor cells from metastatic breast cancer patients. Mol. Oncol. 7, 976–986. [DOI] [PMC free article] [PubMed] [Google Scholar]
- Schramm, A. , De Gregorio, N. , Widschwendter, P. , Fink, V. , Huober, J. , 2015. Targeted therapies in HER2-positive breast cancer – a systematic review. Breast Care (Basel) 10, 173–178. [DOI] [PMC free article] [PubMed] [Google Scholar]
- Schramm, A. , Friedl, T.W. , Schochter, F. , Scholz, C. , de Gregorio, N. , Huober, J. , Rack, B. , Trapp, E. , Alunni-Fabbroni, M. , Muller, V. , Schneeweiss, A. , Pantel, K. , Meier-Stiegen, F. , Hartkopf, A. , Taran, F.A. , Wallwiener, D. , Janni, W. , Fehm, T. , 2016. Therapeutic intervention based on circulating tumor cell phenotype in metastatic breast cancer: concept of the DETECT study program. Arch. Gynecol. Obstet. 293, 271–281. [DOI] [PubMed] [Google Scholar]
- Swennenhuis, J.F. , Tibbe, A.G. , Levink, R. , Sipkema, R.C. , Terstappen, L.W. , 2009. Characterization of circulating tumor cells by fluorescence in situ hybridization. Cytometry A 75, 520–527. [DOI] [PubMed] [Google Scholar]
- van Beers, E.H. , Joosse, S.A. , Ligtenberg, M.J. , Fles, R. , Hogervorst, F.B. , Verhoef, S. , Nederlof, P.M. , 2006. A multiplex PCR predictor for aCGH success of FFPE samples. Br. J. Cancer 94, 333–337. [DOI] [PMC free article] [PubMed] [Google Scholar]
- Van Keymeulen, A. , Lee, M.Y. , Ousset, M. , Brohee, S. , Rorive, S. , Giraddi, R.R. , Wuidart, A. , Bouvencourt, G. , Dubois, C. , Salmon, I. , Sotiriou, C. , Phillips, W.A. , Blanpain, C. , 2015. Reactivation of multipotency by oncogenic PIK3CA induces breast tumour heterogeneity. Nature 525, 119–123. [DOI] [PubMed] [Google Scholar]
- Van Poznak, C. , Somerfield, M.R. , Bast, R.C. , Cristofanilli, M. , Goetz, M.P. , Gonzalez-Angulo, A.M. , Hicks, D.G. , Hill, E.G. , Liu, M.C. , Lucas, W. , Mayer, I.A. , Mennel, R.G. , Symmans, W.F. , Hayes, D.F. , Harris, L.N. , 2015. Use of biomarkers to guide decisions on systemic therapy for women with metastatic breast cancer: American Society of Clinical Oncology Clinical Practice Guideline. J. Clin. Oncol. 33, 2695–2704. [DOI] [PMC free article] [PubMed] [Google Scholar]
- Wallwiener, M. , Hartkopf, A.D. , Riethdorf, S. , Nees, J. , Sprick, M.R. , Schonfisch, B. , Taran, F.A. , Heil, J. , Sohn, C. , Pantel, K. , Trumpp, A. , Schneeweiss, A. , 2015. The impact of HER2 phenotype of circulating tumor cells in metastatic breast cancer: a retrospective study in 107 patients. BMC Cancer 15, 403 [DOI] [PMC free article] [PubMed] [Google Scholar]
- Wilks, S.T. , 2015. Potential of overcoming resistance to HER2-targeted therapies through the PI3K/Akt/mTOR pathway. Breast 24, 548–555. [DOI] [PubMed] [Google Scholar]
Associated Data
This section collects any data citations, data availability statements, or supplementary materials included in this article.
Supplementary Materials
The following are the supplementary data related to this article:
Supplementary data
Supplementary data