

Abstract
Liposomes are an effective gene and/or drug delivery system, widely used in biomedical applications including gene therapy and chemotherapy. Here, we designed a photo-responsive liposome (lipVP) loaded with a photosensitizer verteporfin (VP). This photosensitizer is clinically approved for photodynamic therapy (PDT). LipVP was employed as a DNA carrier for pituitary adenylyl cyclase-activating polypeptide (PACAP) receptor 1 (PAC1R) gene knockdown in PC12 cells. This has been done by incorporating PAC1R antisense oligonucleotides inside the lipVP cavity. Cells that have taken up the lipVP were exposed to light from a UV light source. As a result of this exposure, reactive oxygen species (ROS) were generated from VP, destabilizing the endolysosomal membranes and enhancing the liposomal release of antisense DNA into the cytoplasm. Endolysosomal escape of DNA was documented at different time points based on quantitative analysis of colocalization between fluorescently labeled DNA and endosomes and lysosomes. The released antisense oligonucleotides were found to silence PAC1R mRNA. The efficiency of this photo-induced gene silencing was demonstrated by a 74% ± 5% decrease in PAC1R fluorescence intensity. Following the light-induced DNA transfer into cells, cell differentiation with exposure to two kinds of PACAP peptides was observed to determine the cell phenotypic change after PAC1R gene knockdown.
Keywords: light-responsive, endosomal escape, liposomes, verteporfin, gene delivery
Graphical Abstract
Introduction
Gene delivery and gene therapy rely on effective exogenous nucleic acids transfer into cells.1 Due to the high transfection efficiency, viral carriers are a commonly used method of gene delivery.2, 3 However, the development and application of viral carriers is hindered by a range of limitations including toxin production, limited size of transgenic DNA, packaging difficulties, and the risk of recombination.4 To overcome these limitations, synthetic non-viral gene delivery systems, in particular, nanomaterial-based systems, have been extensively studied and developed.5, 6, 7 Among these nanomaterials, liposomes, especially including cationic lipid components, have attracted significant interests as a drug and/or gene delivery vehicle since the 1980s.8, 9, 10 Up-to-date, various types of liposomes have been clinically used to improve the efficacy and biodistribution of drugs, including cancer therapeutics.11, 12 In recent years, a number of studies reported the application of liposomal carriers to various gene-targeting strategies in cancer gene therapy.3, 13, 14, 15, 16 For example, Mendonça et al.15 applied transferrin receptor-targeted liposomes encapsulating antisense oligodeoxynucleotides (asODNs) and small interference RNA (siRNA) into the treatment of chronic myeloid leukemia. Wu et al.16 demonstrated liposome-based synergetic treatment of insulin promoter-thymidine kinase gene therapy followed by ganciclovir pharmacotherapy, resulting in efficient ablation of the tumor size in mice. Therefore, liposomes can serve as an efficient technique for targeted gene transfer in cancer gene therapy.
Passive liposomal delivery is challenging due to biological extracellular and intracellular barriers such as enzyme degradation, pH change, and endolysosomal lysis.17 In order to overcome these barriers and enhance the efficacy of liposome-mediated gene and/or drug delivery, various strategies have been employed to develop active liposomes whose bilayer can be destabilized by using external stimuli, including temperature,18, 19, 20 pH,21, 22, 23 ultrasound,13, 24 specific enzymes,25, 26 magnetic field,27, 28, 29 and photo irradiation including UV light.30, 31, 32, 33, 34 Light is especially attractive as a triggering modality because it can be applied remotely with high spatiotemporal precision, while light parameters such as wavelength, power density, and illumination time can be adjusted to control the release platform.35 In recent years, enhanced cytoplasmic delivery of macromolecular compounds by photochemical disruption of the endolysosomal membrane, referred to as photochemical internalization (PCI),36 has been actively investigated in the context of gene delivery, including siRNA, peptide nucleic acids (PNAs), and plasmid DNA (pDNA),37 and pharmacotherapy.38, 39, 40, 41, 42 For example, Park et al.39 demonstrated endolysosomal escape of the therapeutic p53 gene carried by polymer-gene complex after illumination with a 671 nm laser. Here, we used a similar strategy to deliver a gene to silence one of the pituitary adenylyl cyclase-activating polypeptide (PACAP) receptors.
PACAP is a member of the vasoactive intestinal polypeptide (VIP)-glucagon-growth hormone releasing factor-secretin superfamily, and it has two amidated forms: PACAP-38 and PACAP-27.43 Broadly expressed in nerve cells, PACAP is a pleiotropic growth factor, affecting differentiation, proliferation, and maturation of most neural and non-neural cell types.44 PACAP also plays a role in cancer cell proliferation.45 It induces cell proliferation in small lung cancer cells and neuroblastoma cells,46, 47 but it inhibits cell growth of lung cancer and breast cancer.48, 49, 50 Additionally, PACAP is an important neuropeptide that plays a vital role in the regulation of hypertension.51 The PACAP-specific cell membrane receptors include the PAC1, vasoactive intestinal peptide receptor (VPAC)1, and VPAC2. Among these receptors, PACAP receptor 1 (PAC1R) has the highest affinity for PACAP at physiological concentrations.52 Because PC12 cells only express PAC1R, this cell line was a good model to investigate the impact of PAC1R knockdown.53 PC12 cells, a clonal cell line derived from a pheochromocytoma of the rat adrenal medulla, were used as the in vitro model for assessing differentiation and neurite growth because they can be stimulated for neurite outgrowth by the nerve growth factor (NGF).54 PACAP, acting as a neurotransmitter, also induces PC12 cell differentiation, via a different signaling pathway from NGF.55
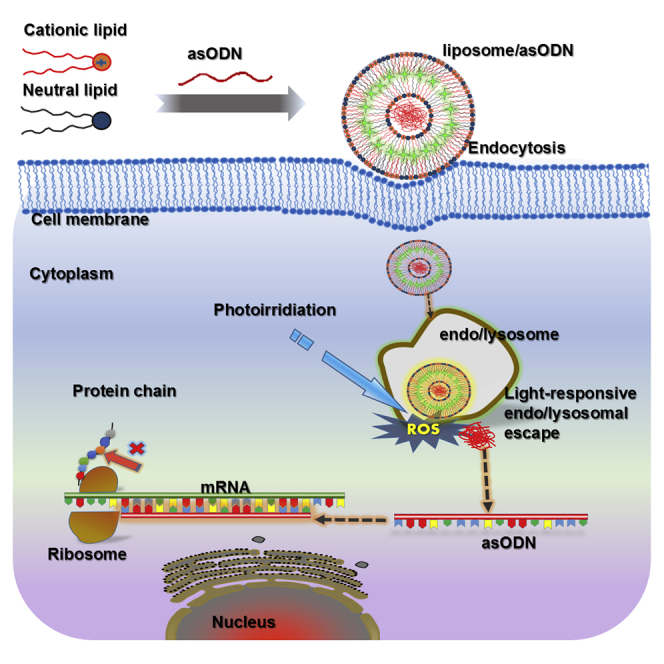
In this study, we demonstrated PAC1R gene knockdown by light-triggerable liposomes and the effect of PACAP on PC12 cell differentiation following PACAP gene silencing. To prepare the liposomes, we chose 1, 2-dioleoyl-sn-glycero-3-phosphocholine (DOPC) as a neutral lipid56 and 1, 2-di-(9Z-octadecenoyl)-3-trimethylammonium-propane (DOTAP) as a cationic lipid. The latter can enhance gene delivery because it is able to freely pass through negatively charged cell membranes.14 Verteporfin (VP), a highly potent photodynamic therapy (PDT) photosensitizer,57 was loaded inside a liposomal bilayer, referred to as lipVP. asODN molecules of PAC1R were incorporated inside a liposomal cavity. These liposomes were endocytosed by cells, where they became entrapped in the endosomes and lysosomes.58 VP was used to generate a sufficient amount of reactive oxygen species (ROS) for destabilization of the liposomal and endolysosomal membranes under light illumination.59, 60 Figure 1 illustrates the mechanism on asODN release from the endosomes and lysosomes by ROS. In particular, we quantitatively explain the endolysosomal escape process through subcellular colocalization analysis based on the released profiles of DNA molecules and endosomes and lysosomes. asODN molecules were then released from the endolysosomal compartments into the cytoplasm and silenced the PAC1R mRNA. To examine the response of PC12 cells to PACAP stimulation after gene silencing, we quantified the neurite outgrowth of cells treated with PACAP-27 and PACAP-38, respectively. For comparison, NGF was also added to the PC12 cells with the silenced PAC1R gene, and subsequent neurite outgrowth was assessed.
Figure 1.

Schematic Diagram
Illustration of the lipVP preparation and light-triggered asODN release for gene silencing.
Results
Characterization of Liposome Samples
The transmission electron microscopy (TEM) images of as-prepared lipVP exhibit fairly spherical liposome shapes with a size around 200 nm (Figure 2A). We determined the average sizes of lipVP-asODN complexes with different N/P ratios by the dynamic light scattering (DLS) method, ranging from 119.6 ± 0.6 nm to 121.7 ± 0.3 nm (Figure 2B). The polydispersity index (PDI) values decreased slightly from 0.204 ± 0.0036 to 0.178 ± 0.001 with an increased N/P charge ratio. The PDI values of nanoparticle suspension ranging from 0.1 to 0.25 indicate a narrow size distribution, and the value higher than 0.5 indicates a wide size distribution.61 Therefore, our PDI values indicated that as-prepared lipVP-asODN complexes were dispersed homogeneously with a relatively narrow size distribution. To obtain lipVP/asODN with an optimal N/P ratio used in this study, we conducted agarose gel retardation assays. The results shown in Figure 2C indicate that less DNA was detected with an increased N/P ratio. When the value of N/P ratio reached 25:1, free DNA could not be detected in the agarose gel. This finding suggests that the maximal amount of DNA molecules was loaded into the liposomes at an N/P ratio of 25:1. Additionally, the zeta potential of lipVP/asODN with varying N/P ratios was also measured. As shown in Figure 2D, the zeta potential of the complexes increases with increasing N/P ratio. This increasing zeta potential enhances the cellular uptake of liposome-formulated DNA compared with free DNA molecules. The VP absorption peak at 700 nm was shifted to a shorter wavelength when loaded inside liposomes compared with VP alone (Figure S1), while the fluorescence spectrum of VP loaded inside liposomes was not obviously changed compared with pure VP (Figure S2). This indicates that VP was encapsulated in the liposomes. We also estimated the amount of VP loaded inside liposomes, which was approximately 143 ± 0.36 μg/mL.
Figure 2.

Characterizations of lipVP and lipVP-asODN Complexes
(A) A representative TEM image of lipVP; inset is the lipVP size distribution histogram. Scale bar, 0.1 μm. (B) Average sizes and PDI of different lipVP-asODN complexes with different N/P ratios. The measurements of each were conducted in triplicates, *p < 0.05, **p < 0.01 (t test) compared with the lipVP group. n = 3. (C) DNA agarose gel electrophoresis pattern of different lipVP-asODN complexes at different N/P ratios. Lane 1, 10 bp DNA ladder only; lane 2, pure asODN only; lanes 3–7, the N/P ratio = 1, 5, 10, 15, 20, and 25:1, respectively. (D) Zeta potential of different lipVP-asODN complexes at different N/P ratios. **p < 0.01, ***p < 0.001 (t test) compared with the lipVP. n = 3.
Cellular Uptake of lipVP and Release of asODN under UV Light Illumination
Figure S3 shows the cellular uptake of lipVP with different incubation times (0.5, 1, 2, and 3 hr). After 2 and 3 hr incubation, higher red fluorescence signal from VP surrounding the nuclei (stained in blue color) was observed compared with cells treated for 0.5 and 1 hr. Therefore, we chose 2 hr incubation time in this study.
The DNA release test was first performed in test tubes with carboxyfluorescein (FAM)-labeled DNA molecules encapsulated in the lipVP platform, as shown in Figure S4. FAM is a fluorescent dye that self-quenches at high concentration.62 This allows the detection of its release from the liposomes to the surrounding medium by monitoring the increase of FAM fluorescence.63 Following light illumination, the FAM fluorescence intensity increases compared with the control without light treatment. The extent of this decrease was found to be related to the illumination period. However, an increase in the fluorescence signal was not observed when the same FAM-labeled DNA molecules were encapsulated into the liposomes without VP, as shown in the inset of Figure S4. Our results indicate that FAM-labeled DNA molecules were released from lipVP following light illumination. However, in liposomes without VP, the DNA molecules have not been released even when triggered by a light source. In order to assess whether the light-induced ROS will damage the DNA, which is encapsulated into the lipVP compartment, the gel retardation assay was also carried out. As shown in Figure S5, the clear bands of DNA released from liposomes with 2, 4, 6, and 8 min of UV illumination can be observed, suggesting that ROS induced by light illumination did not significantly affect the entrapped DNA.
Having confirmed the ROS generation from lipVP under light illumination in a test tube, we evaluated intracellular ROS generation by using 2′, 7′-dichlorofluorescein (DCF) diacetate (DCF-DA) assay where nonfluorescent DCF-DA can be oxidized by ROS to produce highly fluorescent DCF. As shown in Figure S6, the fluorescence intensity of DCF increased with light illumination time, indicating that a higher amount of ROS was generated from lipVP. Additionally, we assessed the in vitro DNA release profile by irradiating cells with the UV light (365 nm, 1.25 mW/cm2). As shown in Figure 3, an enhanced green signal from FAM was clearly observed after light illumination compared with the control sample without light treatment, with the maximum intensity achieved at 6 min illumination. Our results indicated that the increased ROS production resulted in more damage to endolysosomal membranes, and enhanced the release of DNA molecules from the endolysosomal compartments.
Figure 3.

Light-Enhanced DNA Release in Cells
(A–E) CLSM images of FAM-labeled DNA release after 2 hr incubation with lipVP-asODN and photoirradiation for different periods: (A) 0, (B) 1, (C) 2, (D) 4, and (E) 6 min. (F) The amount of released DNA molecules during photoirradiation (in relative fluorescence units [RFU]; **p < 0.01, ***p < 0.001 [t test]; n = 3 compared with the group without light treatment). Blue color indicates the nuclei stained with Hoechst 33342, and green color represents the FAM-labeled DNA.
Quantitative Analysis of Endolysosomal Escape of asODN after Light Illumination
Subcellular distribution and endosomal escape of asODN from light-triggered lipVP was analyzed by using confocal laser scanning microscopy (CLSM) (Figure 4). After 1 hr incubation, FAM-labeled asODN was internalized in cells, which was confirmed by a green signal observed around the nucleus (Figure 4B). After 2 hr incubation, colocalization between the green signal from fluorescent asODN and red signal from the endosomes and lysosomes labeled by LysoTracker was clearly observed, indicating the entrapment of lipVP-asODN inside the endosomes and lysosomes (Figure 4C). Without light irradiation, some asODN molecules were able to escape from the endosomes and lysosomes, but most of them were still located inside the organelles after 4 hr incubation (Figure 4D). However, following 4 min light irradiation after 2 hr incubation, most asODN molecules escaped outside the endosomes and lysosomes after a further 2 hr incubation, which was demonstrated by the green signal from asODN and almost no colocalization observed in Figure 4E. The light-triggered escape of asODN was also confirmed by the analysis of colocalization between the fluorescently labeled endosomes and lysosomes and fluorescent asODN molecules by using ImageJ (Figure 5). Colocalization was quantified using the Costes approach,64 Mander’s coefficient,65 and Pearson’s correlation coefficient (PCC).66 Based on the Costes approach, a white overlay of the green signal from asODN and red signal from LysoTracker indicates the colocalization between asODN and endosomes and lysosomes. Figures 5A–5D show the Costes maps of Figures 5B–5E, respectively. Initially, the lipVP-asODN complexes were internalized into the cells and most of them had not reached the lysosomes. After 1 hr incubation, the white area was almost negligible (Figure 5A), indicating that asODN was not located within endolysosomal compartments. As the endocytosis process continued, after a 2 hr incubation time, a large white area was observed (Figure 5B), suggesting that most lipVP-asODN nanoparticles were internalized into the endosomes and lysosomes. Even after 4 hr incubation, some white spots were still observed, indicating the lipVP-asODN complexes were still entrapped in the endolysosomal compartments (Figure 5C). However, in a scenario of light illumination, at the same time point (4 hr incubation time), almost no white color was observed, suggesting that most lipVP-asODN molecules were then released from endolysosomal compartments into the cytoplasm (Figure 5D).
Figure 4.

Light-Enhanced Endolysosomal Escape
(A) A time course showing the time points of transfection, photoirradiation, and CLSM imaging. (B–E) CLSM images of colocalization between the FAM-tagged DNA (green channel) and endosomes and lysosomes (LysoTracker, red channel); (B and C) images taken after 1 hr (B) and 2 hr (C) incubation with lipVP-asODN complexes (without light illumination); (D) images taken after 4 hr incubation with lipVP-asODN complexes (without light illumination); and (E) images taken after 4 hr incubation with lipVP-asODN and light illumination, which was done at 2 hr incubation time.
Figure 5.

Co-localization Analysis with ImageJ Costes’ Approach
(A), (B), (C), and (D) are Costes’ maps of (B), (C), (D), and (E), respectively, with the white pixels overlay between the green (DNA molecules) and red channel (endosomes and lysosomes). (E) Stack graph of Manders’ coefficient analysis and Pearson’s coefficient (inset table).
Based on the Costes colocalization analysis, the PCC value was also evaluated. The PCC ranges from −1 to 1, with −1 indicating a negative correlation, 1 indicating a positive correlation, and 0 standing for no correlation. As shown in the inset table in Figure 5E, the PCC value was 0.305 after 2 hr incubation. However, it decreased to −0.036 after light illumination, consistent with the asODN release from endolysosomal compartments. For comparison purposes, the control experiments were also conducted where the cells were incubated only with lipVP-asODN for 4 hr but without light treatment. In this case, the PCC value was 0.023, which indicated that some asODN molecules were still colocalized with lysosomes.
Furthermore, Mander’s coefficient, varying from 0 to 1, was calculated to determine the fraction of two overlapping channels. As shown in the inset table and the stack columns in Figure 5E, M2 was only 0.385 after light illumination compared with control cells without light illumination (M2 = 0.988), indicating that the DNA molecules escaped from endosomes and lysosomes after light treatment.
Additionally, the intensity correlation analysis (ICA) was also conducted by using the ImageJ plugin, JACoP Li,67 as shown in Figure S7. In this figure the covariance of both channels is shown as the x value, and the intensity distribution of current channel is represented as the y value. The pixels scattered on the left side of the x = 0 line reflect the absence of colocalization or inversely correlated intensities, whereas those situated on the right side of the x = 0 line represent colocalization. These approaches present clear evidences of the dynamic process of light-enhanced endolysosomal escape.
PAC1R Gene Interference with Light-Triggered lipVP-asODN
To evaluate the expression level of the PAC1R protein following gene interference, the fluorescence intensity of stained PAC1R protein was measured with a microplate reader. In this case, a reduced fluorescence signal indicates higher silencing efficiency. As shown in Figure 6, the fluorescence signal decreased to a different extent with increased illumination time, with an approximately 2.5 times decrease achieved under 4 min illumination compared with control cells without light treatment. After 6 min illumination, the remaining fluorescence did not change in a statistically significant fashion. These results are consistent with the DNA release profile under UV illumination shown in Figure 3. In addition, for comparison, free asODN molecules were delivered into the PC12 cells and UV light was then applied to cells under the same experimental conditions. As shown in Figure 6G, the fluorescence intensity of PAC1R remained unchanged with increased illumination time, indicating that an efficient gene knockdown was not triggered in this situation.
Figure 6.

Immunofluorescence
(A–F) Representative CLSM images of indirect immunofluorescence staining of PAC1R in control cells without any treatment (A) and light-treated cells with different illumination times: 0 (B), 1 (C), 2 (D), 4 (E), and 6 min (F). (G) The relative PAC1R fluorescence intensity measured in cells treated with free DNA molecules (black squares) and lipVP-DNA (red circles) and light illumination. Data are presented as mean ± SD. n = 3. *p < 0.05, **p < 0.01 (t test) compared with groups treated with DNA molecules at the same light irradiation time.
Assessment of Cell Differentiation after PAC1R Gene Interference
As the positive control of cell differentiation, a polypeptide, NGF, was also used to treat PC12 cells after the PAC1R gene knockdown. As shown in Figure 7, for control cells without light irradiation, at day 2 after addition of NGF, the PACAP-38 and PACAP-27 cells exhibited a high degree of differentiation (65% ± 16%, 62% ± 7%, and 56% ± 5%, respectively) with many long neurites spreading out of the cells (Figure S7). On day 4, a higher percentage of neurite outgrowth was observed (83% ± 4%, 72% ± 10%, and 66% ± 11%, respectively). For cells treated with 4 min light illumination, the PAC1R gene was silenced, but only to some extent, resulting in a limited effect of PACAP on cell differentiation. Only 32% ± 5% (PACAP-27-treated groups) and 31% ± 9% (PACAP-38-treated groups) of cells showed an obvious neurite outgrowth at day 4 after PACAP treatment (Figure 7). We clarify that the siRNA molecules against PAC1R were not involved in this study. By contrast, the action of NGF on neurite outgrowth was not significantly affected by light illumination, with approximately 82% of cells in the NGF-treated groups at day 4 still exhibiting a high degree of cell differentiation (Figure 7). The corresponding morphologies of cell differentiation after light illumination are shown in Figures S9 and S10. These results suggested that the PACAP-dependent signaling pathway of neurite growth was interfered with to a different extent when the expression of receptor PAC1R was inhibited by gene silencing; on the other hand, NGF still played its role in neurite growth even when PAC1R was silenced.
Figure 7.

Cell Differentiation
The assessment of differentiation inPC12 cells induced by NGF and PACAP with and without light illumination; the control groups are cells only without any treatments. Cells growing at least a neurite with length no less than the cell body diameter were counted in five selective images. *p < 0.05, **p < 0.01 (two-way analysis of variance with Fisher’s least significant difference [LSD]). n = 5. Inset images illustrate the PC12 cell differentiation stimulated with NGF or PACAP peptides; white arrows indicate the outspread neurites.
Cellular Cytotoxicity Assay
A series of cell viability tests under various treatments were performed to estimate the potential toxicity effect on cells. To verify the potential light toxicity, we illuminated the cells with UV light from 0 to 6 min. As shown in Figure 8, the cell viability was not changed significantly compared with the controls (without the UV treatment). We further assessed the toxicity of pure liposomes and the impact of both lipVP and light irradiation simultaneously. The liposomes at both higher (55.5 μg/mL) and lower concentration (5.55 μg/mL) did not significantly affect cell viability, even under photoirradiation for different time periods. On the other hand, the lipVP showed increased cytotoxicity under longer illumination time. After 6 min illumination, about 19% and 17% of cells were killed by lipVP at higher (55.5 μg/mL) and lower concentration (5.55 μg/mL), respectively (Figure 8). These results suggested that cytotoxicity induced by both lipVP and UV exposure could be attributed to light-triggered ROS generation from VP. However, more than 80% of total cells were still alive in all tests, indicating the photo-triggered liposomes (or lipVP) are relatively biocompatible.
Figure 8.

Cytotoxicity
In vitro toxicity assays of pure liposomes (Liposomes-1 and Liposomes-2), lipVP (LipVP-1 and LipVP-2), and light illumination on PC12 cells at 24 hr after treatment. The concentration of Liposomes-2 and LipVP-2 was 5.55 and 55.5 μg/mL, respectively. *p < 0.05, **p < 0.01 (t test) compared with the control cells in each group at the same photoirradiation time.
Discussion
Non-viral gene vectors have recently attracted significant research interests because of their advantages for gene therapy including low toxicity of materials, cost-effectiveness, and ease of production and usage, compared with the viral vectors with inherent risks for clinical applications.4, 68 The goal of this study was to develop a facile nanoparticle-based gene delivery system capable of being triggered with light to enable a higher level of control of gene release and interference. To this end, we developed a non-viral gene vector, based on engineered liposomes incorporating VP inside a liposomal bilayer and asODN inside a middle cavity. VP has a broad absorption band between 300 and 500 nm with one absorption peak at 350 nm, which can be activated to generate ROS with a UV light source. Considering the toxic effects of UV light on DNA molecules, we paid particular attention to the UV wavelength and power density used in this study. DNA easily absorbs UVB radiation (280–315 nm), compared with UVA (315–400 nm), while the UVA band causes sunburn on human skin.69 The UV wavelength we used falls into the UVA region, where DNA molecules have almost no absorbance.70 Additionally, a low-power density (1.25 mW/cm2) and limited illumination time (no longer than 6 min) were also used to further minimize light toxicity. This is supported by Besaratinia’s work,71 which demonstrated that UVA irradiation with a dose of 0.50 J/cm2 does not induce significant damage to DNA. Kuluncsics’s group69 also reported that UVA illumination with a dose of 9.9 J/cm2 caused less damage to DNA than simulated sunlight. In our study, the highest UV dose with 6 min irradiation was calculated to be 0.45 J/cm2, which was lower than the dose mentioned above. Therefore, the safety issues related to the use of UV light in this study do not appear to be significant.
The endocytic pathway is one of the vital mechanisms of cellular uptake of nanoparticles. This pathway is regulated by a series of endosomes from early endosomes to late endosomes that mature and fuse with the intracellular organelles, lysosomes.72 After internalization of the delivery vehicles through the endocytic pathway, most of the vehicles are entrapped in endosomes and lysosomes where the enzymatic degradation usually takes place, resulting in deactivation of functional compounds before release or targeting other organelles.41 Therefore, endolysosomal escape of the vectors-DNA complexes is the main challenge for efficient gene transfection.73 To overcome the issue of endolysosomal entrapment, we herein assessed the ability of ROS for endolysosomal damage. We first evaluated ROS generation from VP triggered by light in a test tube and at a cellular level by, respectively, conducting the FAM-labeled DNA release assay and the DCF-DA assay. Both enhanced FAM and DCF fluorescence was a clear indicator of light-triggered ROS production. After having confirmed that the ROS generation can be triggered, we further characterized the ROS-induced endolysosomal escape of asODN by confocal microscopy. This escape was demonstrated by documenting the illumination-induced change in the cells: the previously colocalized green fluorescence of asODN and red signal of LysoTracker became clearly separated after light illumination. We quantified this effect by using three different quantitative methods: the Costes approach, Mander’s coefficient, and PCC. Taken together, these data demonstrated the enhanced endolysosomal escape induced by ROS.
To assess whether ROS-induced gene release can enhance the efficacy of gene knockdown, we evaluated the PAC1R protein level after gene silencing by comparing the effects of asODN loaded inside the liposomes incorporating VP and free asODN molecules. After light triggering, a decreased PAC1R level was clearly observed when cells were treated with lipVP-asODN, compared with free asODN molecules. Such enhancement of the gene knockdown was further confirmed by the neurite-inducing activity of PACAP in treated PC12 cells, where a limited neurite outgrowth was an indicator of the response to PAC1R gene knockdown achieved by using lipVP-asODN.
PACAP-induced differentiation of PC12 cells is generally investigated by either measuring the levels of signaling molecules involved in this processor or inhibiting the action of PACAP and its receptor with synthetic antagonists, including PACAP6-27 and PACAP6-38.74, 75 However our light-triggered liposomal delivery platform incorporating VP provided another useful strategy to interfere with PACAP-induced cell differentiation. This method also has the potential to be applicable to studies on PACAP/PAC1R-mediated signaling pathways in the brain tissues.76 Although our liposomes were applied to cell experiments only in this study, they will be able to be used in in vivo applications by surface modification with polyethyleneglycol (PEG) or cell-penetrating peptides (CCPs). PEG can dramatically extend the circulation time of liposomes and allow conjugation of liposomes with targeting ligands for a specific organelle target. CCPs will increase the delivery efficiency of gene77 or drug78 to the brain by passing the brain-blood barrier.79
Apart from its neurotrophic action in PC12 cells, PACAP is also involved in many biological activities and regulations, including cardiovascular control,47 psychiatric disorders, and stress responses.80, 81 Although the exact mechanisms of PACAP-dependent regulation remain unclear, PACAP has the potential to be a therapeutic target for the treatment of the above disorders. Our approach, therefore, potentially offers another effective strategy for efficient gene therapy by delivering light-triggered liposomes incorporating PACAP gene and VP. It should be mentioned that our strategy has been designed to be compatible with future clinical translation. The materials used in this study, such as VP and lipids, are clinically used in PDT treatment of tumors.
In summary, our light-responsive delivery strategy was able to achieve enhanced endosome and lysosome escape and the PAC1R gene silencing. Such light-triggered liposomes would be able to achieve spatiotemporal control of gene release, potentially offering a non-viral gene delivery platform for efficient gene therapy. Therapeutic agents such as siRNA or DNA would be able to be delivered and released in a more controllable way by taking advantage of such a vector model in combination with light.
Materials and Methods
This project has obtained research ethics approval from the Institutional Biosafety Committee (IBC), Macquarie University.
Materials
Lipids (DOTAP: catalog no. 890890; DOPC: catalog no. 850375) were purchased from Avanti Polar Lipids. DMEM (catalog no. 11965-092), fetal bovine serum (FBS; catalog no. 10437-028), trypsin (catalog no. 15400054), LysoTracker (catalog no. L7528), Hoechst 33342 (catalog no. H3570), PBS (catalog no. 10010023) solution, Hank’s balanced salt solution (HBSS; catalog no. 14175145), 4-(2-hydroxyethyl)-1-piperazineethanesulfonic acid (HEPES; catalog no. 14185052) buffer, and Opti-MEM (catalog no. 31985070) solution were purchased from Thermo Fisher. Uranyl acetate (catalog no. 73943), paraformaldehyde (catalog no. P6148), chloroform (catalog no. 372978), Fluoromount aqueous mounting medium (catalog no. F4680), and 2′, 7′-dichlorofluorescein diacetate (DCF-DA) (catalog no. D6883) were purchased from Sigma-Aldrich. asODN with 3′ end modified by 6-carboxyfluorescein (FAM) was purchased from IDT Tech. We used the sequence 5′TGGTGCTTCCCAGCCACTAT3′-6-FAM. Goat anti-PAC1R primary antibody (catalog no. sczsc-15964) and donkey anti-goat IgG-FITC secondary antibody (catalog no. sczsc-2024) were purchased from Santa Cruz Biotechnology. PACAP-27 (catalog no. 05-23-2151) and PACAP-38 (catalog no. 05-23-2150) were purchased from Merck Millipore Pty.
Preparation of Pure Liposomes, Lipoplexes, and lipVP-DNA Complexes
For the synthesis of pure liposomes, 500 μL of chloroform solution containing DOTAP and DOPC with a molar ratio of 1:1 (DOTAP 2.33 mg, DOPC 2.96 mg) was evaporated under argon gas stream, forming a thin lipid film at the bottom of a glass test tube. The lipid film was subsequently hydrated by adding 1 mL of HEPES buffer (40 mM [pH 7.4]) to the glass test tube, followed by vigorous stirring until the suspension was homogenized. For preparing liposomes loaded with asODN (lipoplexes), 1 mL of HEPES buffer containing asODN with varying concentration was added to the lipid film, followed by vigorous stirring for 10 min. After 24 hr aging, the lipoplex suspension was sonicated for 5 min, followed by extrusion 11 times in a mini-extruder (Avanti Polar Lipids) with two 1.0 mL glass syringes at 37°C. The pore size of the polycarbonate membrane (Avanti Polar Lipids) was 200 nm. When preparing lipVP-DNA complexes, DOTAP, DOPC, and VP were mixed in 500 μL of chloroform with a molar ratio (DOTAP:DOPC:verteporfin) of 1:0.94:0.06.82 The lipid film was formed after evaporation of organic solvent by using the same procedure as described above. asODN molecules with varying amounts (moles of the amine groups of cationic polymers to those of the phosphate ones of DNA [N/P] ratios ranging from 1:1 to 25:1) were used to hydrate the lipid film by using the method described above.83 The complexes were freshly prepared before further use.
Characterization
For TEM imaging, liposome samples were prepared by placing a drop of liposome suspension onto a copper grid and air-dried, followed by negative staining with 2% (w/v) uranyl acetate.84 The samples were then imaged under a TEM with an acceleration voltage of 100 kV (Philips CM 10). Images were captured with an Olympus Megaview G10 camera and processed with iTEM software. The zeta potential and size distribution of liposome samples were determined by DLS using a Zetasizer 3000HSA (Malvern Instruments). Each sample was measured in triplicate after 2 min balance at 25°C, and data were collected as mean ± SD. The absorption and fluorescence spectra of lipVP, pure liposomes, and pure VP were measured with a UV-VIS spectrometer (Cary 5000; Varian) and a Fluorolog-Tau3 System (HORIBA Scientific) with 425 nm Xe lamp excitation, respectively. To determine the encapsulation efficiency of VP loaded inside of liposomes, we added Triton X-100 (0.1%) to as-prepared liposome solution, resulting in VP release. The VP fluorescence (excitation/emission [ex/em]: 425 nm/690 nm) was recorded on a Fluorolog-Tau-3 system and compared with the corresponding VP standard curve. For the agarose gel (1.2%) assay of lipVP-asODN complexes with different N/P ratios, electrophoresis was carried out at 90 V for 45 min.
Cell Culture
The PC12 cell line was purchased from ATCC. DMEM supplemented with 10% FBS and 1% antibiotic-antimycotic was used as the culture medium. The cells were grown at 37°C in the humid atmosphere with 5% CO2. When cells reached about 90% confluence, they were detached with trypsin and transferred into Petri dishes or well plates for different experimental purposes. For confocal microscopy imaging, glass coverslips with 12 mm diameter were placed at the bottom of each well in a 24-well plate; cells (5 × 10⁴/well) were then seeded onto the bottom of each well. For light irradiation experiments, the cells were cultured in a well plate or glass-bottom Petri dish and illuminated with UV light (365 nm, 1.25 mW/cm2) from a UV-LED source (Nichia) at various time points for 1, 2, 4, and 6 min, respectively.
Cellular Uptake of Liposomes and Endolysosomal Escape with a Light Trigger
Before incubation with the lipVP suspension, the cells (5 × 10⁴/well) were seeded onto 12 mm diameter glass coverslips placed at the bottom of each well in a 24-well plate. After reaching 70% confluence, the cells were incubated with 500 μL of Opti-MEM solution containing lipVP (5.55 μg/mL) for different periods. To observe the cellular uptake of lipVP, we washed the cells three times by using the PBS solution (1× [pH 7.4]), fixed with 2% paraformaldehyde for 10 min at 37°C, and stained with Hoechst 33342 (5 μg/mL) for 15 min at 37°C. For the assessment of light-triggered endolysosomal escape of asODN molecules from the liposomes, incubation with lipVP samples and light irradiation were sequentially carried out as per the schedule shown in Figure 4A. For the staining of endosomes and lysosomes, LysoTracker (50 nM) was added into the cell culture medium 1 hr before the cell fixation. After cell staining and fixation, each coverslip with fixed cells was washed by the PBS solution (1× [pH 7.4]) three times and transferred onto a glass slide with a drop of the mounting medium. The glass slide was then imaged using a Leica SP2 CLSM system. A violet laser operating at 405 nm and an argon laser at 496 and 570 nm were used for the excitation of VP, FAM-labeled asODN, and LysoTracker, respectively. The fluorescence emission was measured at 700 ± 25 nm for VP, 525 ± 25 nm for FAM, and 590 ± 10 nm for LysoTracker.
Detection of Cellular ROS Generation Using DCF-DA
The cells (5 × 10⁴/well) were attached to Petri dishes and incubated at 37°C for 24 hr. After removing culture medium, the cells were incubated with 500 μL of the Opti-MEM solution containing lipVP (5.55 μg/mL). After 2 hr incubation at 37°C, the medium was removed and the cells were washed with 500 μL of 1× HBSS solution three times. A total of 200 μL of 1× HBSS containing DCF-DA (25 μM) was subsequently added to the cells, followed by incubation for 30 min at 37°C, while protected from light. After incubation, the cells were illuminated by UV light for different time periods. After light irradiation, the DCF-DA solution was removed from the cells. The cells were further imaged using a Leica SP2 CLSM system. For comparison, the control cells were incubated with 100 μL of the Opti-MEM solution containing H2O2 at different concentrations (1, 10, and 100 μM) for 2 hr followed by addition of DCF-DA and CLSM imaging. For the determination of ROS, cells were cultivated in 96-well plates, instead of Petri dishes, followed by the same procedure as described above. After treatment, the DCF fluorescence intensity was measured using a FLUOstar Galaxy multi-mode microplate reader (BMG LABTECH Pty) with the 485/520 nm excitation/emission filter.
Cell Transfection and Immunofluorescence Staining of PAC1R
A total of 500 μL of the Opti-MEM solution containing lipVP-asODN (charge ratio N/P = 25, with 1 μg of asODN) was added to the cells in each well in a 24-well plate. After 2 hr incubation, the Opti-MEM medium was removed and the cells were washed with PBS three times, followed by incubation with a fresh culture medium (containing 10% FBS) for 24 hr. The cells were subsequently fixed with 2% paraformaldehyde for 10 min at 37°C and incubated with 0.1% Triton X-100 for another 10 min to achieve permeabilization, followed by 30 min blocking by using 5% BSA at ambient temperature. The cells were then incubated with goat anti-PAC1R primary antibody (1:50 dilution in PBS) for 90 min, followed by incubation with donkey anti-goat IgG secondary antibody conjugated with FITC (1:100 dilution in PBS) for 30 min at 37°C. The PAC1R fluorescence intensity was measured using a microplate reader with the 485/520 nm excitation/emission filter. The corresponding fluorescence images were obtained using a CLSM system with excitation at 496 nm and emission at 525 ± 25 nm.
NGF, PACAP-27, and PACAP-38 Stimulation for Neurite Outgrowth
After the treatment with liposomes and light irradiation, the cells were incubated with 100 μL of the Opti-MEM medium containing NGF (50 ng/mL), PACAP-27 (10 nM), and PACAP-38 (10 nM), respectively. For comparison, the control groups were treated with same liposome samples but without light illumination. Cellular morphology analysis was performed based on the phase-contrast microscopy images taken under a microscope (Nikon Eclipse Ts100) at 2 and 4 days following the light treatment. Quantitative analysis based on light microscopy was used to assess the differentiation of PC12 cells.85 We chose five images in each group to count the number of differentiated cells growing at least one neurite with length no less than a cell body diameter and to calculate their percentage.
Cell Viability after Treatment of Liposome Samples
The cells (1 × 10⁴/well) were seeded into 96-well plates and cultured for 24 hr at 37°C. When cells reached 70% confluence, the previous medium was removed and the Opti-MEM solution containing pure liposomes and lipVP with different concentrations were, respectively, added to the cells. After 2 hr of incubation with different liposome samples, the cells were washed with PBS three times to remove unbound liposomes. A fresh medium was then added to the cells, followed by another 24 hr incubation. For the light irradiation alone, the cells were exposed to UV light (365 nm, 1.25 mW/cm2) for 1, 2, 4, and 6 min, respectively. After light treatment, the fresh medium was added to the cells for another 24 hr incubation. The toxicity of the liposome samples and UV light in PC12 cells was assessed by the MTS test (Promega), as per manufacturer’s instructions, and the results were compared with control cells without any treatment. Cell viability was then calculated as a percentage of the absorbance in treated cells compared with the untreated controls.
Statistical Analysis
All quantitative data were shown as mean ± SD, n ≥ 3, and the Student’s t test was conducted between two sets of data. All data analysis and plotting were performed with OriginPro 8.5 software.
Author Contributions
W.D. and E.M.G. conceived and supervised this project. W.D. and W.C. performed the data analysis. W.C. conducted experiments and wrote this manuscript.
Conflicts of Interest
The authors declare no conflict of interest.
Acknowledgments
This work was supported by the Australian Research Council (DECRA: grant DE130100894; ARC CoE: grant CE140100003) and the HDR Budget from the Department of Physics and Astronomy, Macquarie University. The authors thank Dr. Jenny Nhu Vo for her assistance work of DNA gel electrophoresis, and also thank the Macquarie Microscopy Unit for the TEM microscope. W.C. thanks the iMQRES scholarship.
Footnotes
Supplemental Information includes Supplemental Materials and Methods and ten figures and can be found with this article online at http://dx.doi.org/10.1016/j.omtn.2017.04.015.
Contributor Information
Wei Deng, Email: wei.deng@mq.edu.au.
Ewa M. Goldys, Email: ewa.goldys@mq.edu.au.
Supplemental Information
References
- 1.Naldini L., Blömer U., Gallay P., Ory D., Mulligan R., Gage F.H., Verma I.M., Trono D. In vivo gene delivery and stable transduction of nondividing cells by a lentiviral vector. Science. 1996;272:263–267. doi: 10.1126/science.272.5259.263. [DOI] [PubMed] [Google Scholar]
- 2.Kay M.A., Glorioso J.C., Naldini L. Viral vectors for gene therapy: the art of turning infectious agents into vehicles of therapeutics. Nat. Med. 2001;7:33–40. doi: 10.1038/83324. [DOI] [PubMed] [Google Scholar]
- 3.Zhang Y., Satterlee A., Huang L. In vivo gene delivery by nonviral vectors: overcoming hurdles? Mol. Ther. 2012;20:1298–1304. doi: 10.1038/mt.2012.79. [DOI] [PMC free article] [PubMed] [Google Scholar]
- 4.Luo D., Saltzman W.M. Synthetic DNA delivery systems. Nat. Biotechnol. 2000;18:33–37. doi: 10.1038/71889. [DOI] [PubMed] [Google Scholar]
- 5.Shim M.S., Kwon Y.J. Stimuli-responsive polymers and nanomaterials for gene delivery and imaging applications. Adv. Drug Deliv. Rev. 2012;64:1046–1059. doi: 10.1016/j.addr.2012.01.018. [DOI] [PubMed] [Google Scholar]
- 6.Lee D.-J., He D., Kessel E., Padari K., Kempter S., Lächelt U., Rädler J.O., Pooga M., Wagner E. Tumoral gene silencing by receptor-targeted combinatorial siRNA polyplexes. J. Control. Release. 2016;244(Pt B):280–291. doi: 10.1016/j.jconrel.2016.06.011. [DOI] [PubMed] [Google Scholar]
- 7.Moghimi S.M., Symonds P., Murray J.C., Hunter A.C., Debska G., Szewczyk A. A two-stage poly(ethylenimine)-mediated cytotoxicity: implications for gene transfer/therapy. Mol. Ther. 2005;11:990–995. doi: 10.1016/j.ymthe.2005.02.010. [DOI] [PubMed] [Google Scholar]
- 8.Semple S.C., Akinc A., Chen J., Sandhu A.P., Mui B.L., Cho C.K., Sah D.W., Stebbing D., Crosley E.J., Yaworski E. Rational design of cationic lipids for siRNA delivery. Nat. Biotechnol. 2010;28:172–176. doi: 10.1038/nbt.1602. [DOI] [PubMed] [Google Scholar]
- 9.Mintzer M.A., Simanek E.E. Nonviral vectors for gene delivery. Chem. Rev. 2009;109:259–302. doi: 10.1021/cr800409e. [DOI] [PubMed] [Google Scholar]
- 10.Fraley R., Subramani S., Berg P., Papahadjopoulos D. Introduction of liposome-encapsulated SV40 DNA into cells. J. Biol. Chem. 1980;255:10431–10435. [PubMed] [Google Scholar]
- 11.Allen T.M., Cullis P.R. Liposomal drug delivery systems: from concept to clinical applications. Adv. Drug Deliv. Rev. 2013;65:36–48. doi: 10.1016/j.addr.2012.09.037. [DOI] [PubMed] [Google Scholar]
- 12.Su B., Cengizeroglu A., Farkasova K., Viola J.R., Anton M., Ellwart J.W., Haase R., Wagner E., Ogris M. Systemic TNFα gene therapy synergizes with liposomal doxorubicine in the treatment of metastatic cancer. Mol. Ther. 2013;21:300–308. doi: 10.1038/mt.2012.229. [DOI] [PMC free article] [PubMed] [Google Scholar]
- 13.Suzuki R., Namai E., Oda Y., Nishiie N., Otake S., Koshima R., Hirata K., Taira Y., Utoguchi N., Negishi Y. Cancer gene therapy by IL-12 gene delivery using liposomal bubbles and tumoral ultrasound exposure. J. Control. Release. 2010;142:245–250. doi: 10.1016/j.jconrel.2009.10.027. [DOI] [PubMed] [Google Scholar]
- 14.Yin H., Kanasty R.L., Eltoukhy A.A., Vegas A.J., Dorkin J.R., Anderson D.G. Non-viral vectors for gene-based therapy. Nat. Rev. Genet. 2014;15:541–555. doi: 10.1038/nrg3763. [DOI] [PubMed] [Google Scholar]
- 15.Mendonça L.S., Firmino F., Moreira J.N., Pedroso de Lima M.C., Simões S. Transferrin receptor-targeted liposomes encapsulating anti-BCR-ABL siRNA or asODN for chronic myeloid leukemia treatment. Bioconjug. Chem. 2010;21:157–168. doi: 10.1021/bc9004365. [DOI] [PubMed] [Google Scholar]
- 16.Wu J.X., Liu S.-H., Nemunaitis J.J., Brunicardi F.C. Liposomal insulin promoter-thymidine kinase gene therapy followed by ganciclovir effectively ablates human pancreatic cancer in mice. Cancer Lett. 2015;359:206–210. doi: 10.1016/j.canlet.2015.01.002. [DOI] [PMC free article] [PubMed] [Google Scholar]
- 17.Lin G., Zhang H., Huang L. Smart polymeric nanoparticles for cancer gene delivery. Mol. Pharm. 2015;12:314–321. doi: 10.1021/mp500656v. [DOI] [PMC free article] [PubMed] [Google Scholar]
- 18.Ewe A., Schaper A., Barnert S., Schubert R., Temme A., Bakowsky U., Aigner A. Storage stability of optimal liposome-polyethylenimine complexes (lipopolyplexes) for DNA or siRNA delivery. Acta Biomater. 2014;10:2663–2673. doi: 10.1016/j.actbio.2014.02.037. [DOI] [PubMed] [Google Scholar]
- 19.Needham D., Anyarambhatla G., Kong G., Dewhirst M.W. A new temperature-sensitive liposome for use with mild hyperthermia: characterization and testing in a human tumor xenograft model. Cancer Res. 2000;60:1197–1201. [PubMed] [Google Scholar]
- 20.Ponce A.M., Viglianti B.L., Yu D., Yarmolenko P.S., Michelich C.R., Woo J., Bally M.B., Dewhirst M.W. Magnetic resonance imaging of temperature-sensitive liposome release: drug dose painting and antitumor effects. J. Natl. Cancer Inst. 2007;99:53–63. doi: 10.1093/jnci/djk005. [DOI] [PubMed] [Google Scholar]
- 21.Shi G., Guo W., Stephenson S.M., Lee R.J. Efficient intracellular drug and gene delivery using folate receptor-targeted pH-sensitive liposomes composed of cationic/anionic lipid combinations. J. Control. Release. 2002;80:309–319. doi: 10.1016/s0168-3659(02)00017-2. [DOI] [PubMed] [Google Scholar]
- 22.Zhang Q., Tang J., Fu L., Ran R., Liu Y., Yuan M., He Q. A pH-responsive α-helical cell penetrating peptide-mediated liposomal delivery system. Biomaterials. 2013;34:7980–7993. doi: 10.1016/j.biomaterials.2013.07.014. [DOI] [PubMed] [Google Scholar]
- 23.Obata Y., Tajima S., Takeoka S. Evaluation of pH-responsive liposomes containing amino acid-based zwitterionic lipids for improving intracellular drug delivery in vitro and in vivo. J. Control. Release. 2010;142:267–276. doi: 10.1016/j.jconrel.2009.10.023. [DOI] [PubMed] [Google Scholar]
- 24.de Smet M., Heijman E., Langereis S., Hijnen N.M., Grüll H. Magnetic resonance imaging of high intensity focused ultrasound mediated drug delivery from temperature-sensitive liposomes: an in vivo proof-of-concept study. J. Control. Release. 2011;150:102–110. doi: 10.1016/j.jconrel.2010.10.036. [DOI] [PubMed] [Google Scholar]
- 25.Meers P. Enzyme-activated targeting of liposomes. Adv. Drug Deliv. Rev. 2001;53:265–272. doi: 10.1016/s0169-409x(01)00205-8. [DOI] [PubMed] [Google Scholar]
- 26.Torchilin V.P. Recent advances with liposomes as pharmaceutical carriers. Nat. Rev. Drug Discov. 2005;4:145–160. doi: 10.1038/nrd1632. [DOI] [PubMed] [Google Scholar]
- 27.Ito A., Shinkai M., Honda H., Kobayashi T. Medical application of functionalized magnetic nanoparticles. J. Biosci. Bioeng. 2005;100:1–11. doi: 10.1263/jbb.100.1. [DOI] [PubMed] [Google Scholar]
- 28.Hirao K., Sugita T., Kubo T., Igarashi K., Tanimoto K., Murakami T., Yasunaga Y., Ochi M. Targeted gene delivery to human osteosarcoma cells with magnetic cationic liposomes under a magnetic field. Int. J. Oncol. 2003;22:1065–1071. [PubMed] [Google Scholar]
- 29.Marie H., Lemaire L., Franconi F., Lajnef S., Frapart Y.-M., Nicolas V., Frébourg G., Trichet M., Ménager C., Lesieur S. Superparamagnetic liposomes for MRI monitoring and external magnetic field-induced selective targeting of malignant brain tumors. Adv. Funct. Mater. 2015;25:1258–1269. [Google Scholar]
- 30.Carter K.A., Shao S., Hoopes M.I., Luo D., Ahsan B., Grigoryants V.M., Song W., Huang H., Zhang G., Pandey R.K. Porphyrin-phospholipid liposomes permeabilized by near-infrared light. Nat. Commun. 2014;5:3546. doi: 10.1038/ncomms4546. [DOI] [PMC free article] [PubMed] [Google Scholar]
- 31.Alvarez-Lorenzo C., Bromberg L., Concheiro A. Light-sensitive intelligent drug delivery systems. Photochem. Photobiol. 2009;85:848–860. doi: 10.1111/j.1751-1097.2008.00530.x. [DOI] [PubMed] [Google Scholar]
- 32.Wang F., Liu J. Liposome supported metal oxide nanoparticles: interaction mechanism, light controlled content release, and intracellular delivery. Small. 2014;10:3927–3931. doi: 10.1002/smll.201400850. [DOI] [PubMed] [Google Scholar]
- 33.Hemphill J., Borchardt E.K., Brown K., Asokan A., Deiters A. Optical control of CRISPR/Cas9 gene editing. J. Am. Chem. Soc. 2015;137:5642–5645. doi: 10.1021/ja512664v. [DOI] [PMC free article] [PubMed] [Google Scholar]
- 34.Polstein L.R., Gersbach C.A. A light-inducible CRISPR-Cas9 system for control of endogenous gene activation. Nat. Chem. Biol. 2015;11:198–200. doi: 10.1038/nchembio.1753. [DOI] [PMC free article] [PubMed] [Google Scholar]
- 35.Wu Y.-C., Wu T.-H., Clemens D.L., Lee B.-Y., Wen X., Horwitz M.A., Teitell M.A., Chiou P.Y. Massively parallel delivery of large cargo into mammalian cells with light pulses. Nat. Methods. 2015;12:439–444. doi: 10.1038/nmeth.3357. [DOI] [PMC free article] [PubMed] [Google Scholar]
- 36.Berg K., Selbo P.K., Prasmickaite L., Tjelle T.E., Sandvig K., Moan J., Gaudernack G., Fodstad O., Kjølsrud S., Anholt H. Photochemical internalization: a novel technology for delivery of macromolecules into cytosol. Cancer Res. 1999;59:1180–1183. [PubMed] [Google Scholar]
- 37.Berg K., Weyergang A., Prasmickaite L., Bonsted A., Høgset A., Strand M.T., Wagner E., Selbo P.K. Photochemical internalization (PCI): a technology for drug delivery. Methods Mol. Biol. 2010;635:133–145. doi: 10.1007/978-1-60761-697-9_10. [DOI] [PubMed] [Google Scholar]
- 38.Bostad M., Olsen C.E., Peng Q., Berg K., Høgset A., Selbo P.K. Light-controlled endosomal escape of the novel CD133-targeting immunotoxin AC133-saporin by photochemical internalization - a minimally invasive cancer stem cell-targeting strategy. J. Control. Release. 2015;206:37–48. doi: 10.1016/j.jconrel.2015.03.008. [DOI] [PubMed] [Google Scholar]
- 39.Park S., Park W., Na K. Gene delivery: tumor intracellular-environment responsive materials shielded nano-complexes for highly efficient light-triggered gene delivery without cargo gene damage. Adv. Funct. Mater. 2015;25:3472–3482. [Google Scholar]
- 40.Theodossiou T.A., Gonçalves A.R., Yannakopoulou K., Skarpen E., Berg K. Photochemical internalization of tamoxifens transported by a “Trojan-horse” nanoconjugate into breast-cancer cell lines. Angew. Chem. Int. Ed. Engl. 2015;54:4885–4889. doi: 10.1002/anie.201500183. [DOI] [PubMed] [Google Scholar]
- 41.Bostad M., Kausberg M., Weyergang A., Olsen C.E., Berg K., Høgset A., Selbo P.K. Light-triggered, efficient cytosolic release of IM7-saporin targeting the putative cancer stem cell marker CD44 by photochemical internalization. Mol. Pharm. 2014;11:2764–2776. doi: 10.1021/mp500129t. [DOI] [PubMed] [Google Scholar]
- 42.Maurice-Duelli A., Ndoye A., Bouali S., Leroux A., Merlin J.-L. Enhanced cell growth inhibition following PTEN nonviral gene transfer using polyethylenimine and photochemical internalization in endometrial cancer cells. Technol. Cancer Res. Treat. 2004;3:459–465. doi: 10.1177/153303460400300507. [DOI] [PubMed] [Google Scholar]
- 43.Miyata A., Jiang L., Dahl R.D., Kitada C., Kubo K., Fujino M., Minamino N., Arimura A. Isolation of a neuropeptide corresponding to the N-terminal 27 residues of the pituitary adenylate cyclase activating polypeptide with 38 residues (PACAP38) Biochem. Biophys. Res. Commun. 1990;170:643–648. doi: 10.1016/0006-291x(90)92140-u. [DOI] [PubMed] [Google Scholar]
- 44.Vaudry D., Falluel-Morel A., Bourgault S., Basille M., Burel D., Wurtz O., Fournier A., Chow B.K., Hashimoto H., Galas L., Vaudry H. Pituitary adenylate cyclase-activating polypeptide and its receptors: 20 years after the discovery. Pharmacol. Rev. 2009;61:283–357. doi: 10.1124/pr.109.001370. [DOI] [PubMed] [Google Scholar]
- 45.Lee J.-H., Lee J.-Y., Rho S.B., Choi J.-S., Lee D.-G., An S., Oh T., Choi D.C., Lee S.H. PACAP inhibits tumor growth and interferes with clusterin in cervical carcinomas. FEBS Lett. 2014;588:4730–4739. doi: 10.1016/j.febslet.2014.11.004. [DOI] [PubMed] [Google Scholar]
- 46.Moody T.W., Zia F., Makheja A. Pituitary adenylate cyclase activating polypeptide receptors are present on small cell lung cancer cells. Peptides. 1993;14:241–246. doi: 10.1016/0196-9781(93)90036-g. [DOI] [PubMed] [Google Scholar]
- 47.Gutiérrez-Cañas I., Rodríguez-Henche N., Bolaños O., Carmena M.J., Prieto J.C., Juarranz M.G. VIP and PACAP are autocrine factors that protect the androgen-independent prostate cancer cell line PC-3 from apoptosis induced by serum withdrawal. Br. J. Pharmacol. 2003;139:1050–1058. doi: 10.1038/sj.bjp.0705317. [DOI] [PMC free article] [PubMed] [Google Scholar]
- 48.Zia F., Fagarasan M., Bitar K., Coy D.H., Pisegna J.R., Wank S.A., Moody T.W. Pituitary adenylate cyclase activating peptide receptors regulate the growth of non-small cell lung cancer cells. Cancer Res. 1995;55:4886–4891. [PMC free article] [PubMed] [Google Scholar]
- 49.Leyton J., Gozes Y., Pisegna J., Coy D., Purdom S., Casibang M., Zia F., Moody T.W. PACAP(6-38) is a PACAP receptor antagonist for breast cancer cells. Breast Cancer Res. Treat. 1999;56:177–186. doi: 10.1023/a:1006262611290. [DOI] [PubMed] [Google Scholar]
- 50.Leyton J., Coelho T., Coy D.H., Jakowlew S., Birrer M.J., Moody T.W. PACAP(6-38) inhibits the growth of prostate cancer cells. Cancer Lett. 1998;125:131–139. doi: 10.1016/s0304-3835(97)00525-9. [DOI] [PubMed] [Google Scholar]
- 51.Farnham M.M.-J., Lung M.S., Tallapragada V.J., Pilowsky P.M. PACAP causes PAC1/VPAC2 receptor mediated hypertension and sympathoexcitation in normal and hypertensive rats. Am. J. Physiol. Heart Circ. Physiol. 2012;303:H910–H917. doi: 10.1152/ajpheart.00464.2012. [DOI] [PMC free article] [PubMed] [Google Scholar]
- 52.Daniel P.B., Kieffer T.J., Leech C.A., Habener J.F. Novel alternatively spliced exon in the extracellular ligand-binding domain of the pituitary adenylate cyclase-activating polypeptide (PACAP) type 1 receptor (PAC1R) selectively increases ligand affinity and alters signal transduction coupling during spermatogenesis. J. Biol. Chem. 2001;276:12938–12944. doi: 10.1074/jbc.M009941200. [DOI] [PubMed] [Google Scholar]
- 53.Ravni A., Bourgault S., Lebon A., Chan P., Galas L., Fournier A., Vaudry H., Gonzalez B., Eiden L.E., Vaudry D. The neurotrophic effects of PACAP in PC12 cells: control by multiple transduction pathways. J. Neurochem. 2006;98:321–329. doi: 10.1111/j.1471-4159.2006.03884.x. [DOI] [PubMed] [Google Scholar]
- 54.Vaudry D., Chen Y., Hsu C.M., Eiden L.E. PC12 cells as a model to study the neurotrophic activities of PACAP. Ann. N Y Acad. Sci. 2002;971:491–496. doi: 10.1111/j.1749-6632.2002.tb04513.x. [DOI] [PubMed] [Google Scholar]
- 55.Vaudry D., Stork P.J., Lazarovici P., Eiden L.E. Signaling pathways for PC12 cell differentiation: making the right connections. Science. 2002;296:1648–1649. doi: 10.1126/science.1071552. [DOI] [PubMed] [Google Scholar]
- 56.Du Z., Munye M.M., Tagalakis A.D., Manunta M.D., Hart S.L. The role of the helper lipid on the DNA transfection efficiency of lipopolyplex formulations. Sci. Rep. 2014;4:7107. doi: 10.1038/srep07107. [DOI] [PMC free article] [PubMed] [Google Scholar]
- 57.Aveline B., Hasan T., Redmond R.W. Photophysical and photosensitizing properties of benzoporphyrin derivative monoacid ring A (BPD-MA) Photochem. Photobiol. 1994;59:328–335. doi: 10.1111/j.1751-1097.1994.tb05042.x. [DOI] [PubMed] [Google Scholar]
- 58.Bareford L.M., Swaan P.W. Endocytic mechanisms for targeted drug delivery. Adv. Drug Deliv. Rev. 2007;59:748–758. doi: 10.1016/j.addr.2007.06.008. [DOI] [PMC free article] [PubMed] [Google Scholar]
- 59.Schmidt-Erfurth U., Hasan T. Mechanisms of action of photodynamic therapy with verteporfin for the treatment of age-related macular degeneration. Surv. Ophthalmol. 2000;45:195–214. doi: 10.1016/s0039-6257(00)00158-2. [DOI] [PubMed] [Google Scholar]
- 60.Chen J., Luo J., Zhao Y., Pu L., Lu X., Gao R., Wang G., Gu Z. Increase in transgene expression by pluronic L64-mediated endosomal/lysosomal escape through its membrane-disturbing action. ACS Appl. Mater. Interfaces. 2015;7:7282–7293. doi: 10.1021/acsami.5b00486. [DOI] [PubMed] [Google Scholar]
- 61.Wu L., Zhang J., Watanabe W. Physical and chemical stability of drug nanoparticles. Adv. Drug Deliv. Rev. 2011;63:456–469. doi: 10.1016/j.addr.2011.02.001. [DOI] [PubMed] [Google Scholar]
- 62.Chen R.F., Knutson J.R. Mechanism of fluorescence concentration quenching of carboxyfluorescein in liposomes: energy transfer to nonfluorescent dimers. Anal. Biochem. 1988;172:61–77. doi: 10.1016/0003-2697(88)90412-5. [DOI] [PubMed] [Google Scholar]
- 63.Antonsson B., Conti F., Ciavatta A., Montessuit S., Lewis S., Martinou I., Bernasconi L., Bernard A., Mermod J.J., Mazzei G. Inhibition of Bax channel-forming activity by Bcl-2. Science. 1997;277:370–372. doi: 10.1126/science.277.5324.370. [DOI] [PubMed] [Google Scholar]
- 64.Costes S.V., Daelemans D., Cho E.H., Dobbin Z., Pavlakis G., Lockett S. Automatic and quantitative measurement of protein-protein colocalization in live cells. Biophys. J. 2004;86:3993–4003. doi: 10.1529/biophysj.103.038422. [DOI] [PMC free article] [PubMed] [Google Scholar]
- 65.Manders E.M., Stap J., Brakenhoff G.J., van Driel R., Aten J.A. Dynamics of three-dimensional replication patterns during the S-phase, analysed by double labelling of DNA and confocal microscopy. J. Cell Sci. 1992;103:857–862. doi: 10.1242/jcs.103.3.857. [DOI] [PubMed] [Google Scholar]
- 66.Bolte S., Cordelières F.P. A guided tour into subcellular colocalization analysis in light microscopy. J. Microsc. 2006;224:213–232. doi: 10.1111/j.1365-2818.2006.01706.x. [DOI] [PubMed] [Google Scholar]
- 67.Li Q., Lau A., Morris T.J., Guo L., Fordyce C.B., Stanley E.F. A syntaxin 1, Galpha(o), and N-type calcium channel complex at a presynaptic nerve terminal: analysis by quantitative immunocolocalization. J. Neurosci. 2004;24:4070–4081. doi: 10.1523/JNEUROSCI.0346-04.2004. [DOI] [PMC free article] [PubMed] [Google Scholar]
- 68.Jiang X., Yu H., Teo C.R., Tan G.S.X., Goh S.C., Patel P., Chua Y.K., Hameed N.B., Bertoletti A., Patzel V. Advanced design of dumbbell-shaped genetic minimal vectors improves non-coding and coding RNA expression. Mol. Ther. 2016;24:1581–1591. doi: 10.1038/mt.2016.138. [DOI] [PMC free article] [PubMed] [Google Scholar]
- 69.Kuluncsics Z., Perdiz D., Brulay E., Muel B., Sage E. Wavelength dependence of ultraviolet-induced DNA damage distribution: involvement of direct or indirect mechanisms and possible artefacts. J. Photochem. Photobiol. B. 1999;49:71–80. doi: 10.1016/S1011-1344(99)00034-2. [DOI] [PubMed] [Google Scholar]
- 70.Sinha R.P., Häder D.-P. UV-induced DNA damage and repair: a review. Photochem. Photobiol. Sci. 2002;1:225–236. doi: 10.1039/b201230h. [DOI] [PubMed] [Google Scholar]
- 71.Besaratinia A., Yoon J.I., Schroeder C., Bradforth S.E., Cockburn M., Pfeifer G.P. Wavelength dependence of ultraviolet radiation-induced DNA damage as determined by laser irradiation suggests that cyclobutane pyrimidine dimers are the principal DNA lesions produced by terrestrial sunlight. FASEB J. 2011;25:3079–3091. doi: 10.1096/fj.11-187336. [DOI] [PMC free article] [PubMed] [Google Scholar]
- 72.Bissig C., Gruenberg J. ALIX and the multivesicular endosome: ALIX in Wonderland. Trends Cell Biol. 2014;24:19–25. doi: 10.1016/j.tcb.2013.10.009. [DOI] [PubMed] [Google Scholar]
- 73.Jayakumar M.K.G., Bansal A., Huang K., Yao R., Li B.N., Zhang Y. Near-infrared-light-based nano-platform boosts endosomal escape and controls gene knockdown in vivo. ACS Nano. 2014;8:4848–4858. doi: 10.1021/nn500777n. [DOI] [PubMed] [Google Scholar]
- 74.Kojro E., Postina R., Buro C., Meiringer C., Gehrig-Burger K., Fahrenholz F. The neuropeptide PACAP promotes the α-secretase pathway for processing the Alzheimer amyloid precursor protein. FASEB J. 2006;20:512–514. doi: 10.1096/fj.05-4812fje. [DOI] [PubMed] [Google Scholar]
- 75.Gonzalez B.J., Basille M., Vaudry D., Fournier A., Vaudry H. Pituitary adenylate cyclase-activating polypeptide promotes cell survival and neurite outgrowth in rat cerebellar neuroblasts. Neuroscience. 1997;78:419–430. doi: 10.1016/s0306-4522(96)00617-3. [DOI] [PubMed] [Google Scholar]
- 76.Hannibal J. Roles of PACAP-containing retinal ganglion cells in circadian timing. Int. Rev. Cytol. 2006;251:1–39. doi: 10.1016/S0074-7696(06)51001-0. [DOI] [PubMed] [Google Scholar]
- 77.Gupta B., Levchenko T.S., Torchilin V.P. TAT peptide-modified liposomes provide enhanced gene delivery to intracranial human brain tumor xenografts in nude mice. Oncol. Res. 2007;16:351–359. doi: 10.3727/000000006783980946. [DOI] [PubMed] [Google Scholar]
- 78.Pardridge W.M. Drug and gene delivery to the brain: the vascular route. Neuron. 2002;36:555–558. doi: 10.1016/s0896-6273(02)01054-1. [DOI] [PubMed] [Google Scholar]
- 79.Qin Y., Chen H., Zhang Q., Wang X., Yuan W., Kuai R., Tang J., Zhang L., Zhang Z., Zhang Q. Liposome formulated with TAT-modified cholesterol for improving brain delivery and therapeutic efficacy on brain glioma in animals. Int. J. Pharm. 2011;420:304–312. doi: 10.1016/j.ijpharm.2011.09.008. [DOI] [PubMed] [Google Scholar]
- 80.Stevens J.S., Almli L.M., Fani N., Gutman D.A., Bradley B., Norrholm S.D., Reiser E., Ely T.D., Dhanani R., Glover E.M. PACAP receptor gene polymorphism impacts fear responses in the amygdala and hippocampus. Proc. Natl. Acad. Sci. USA. 2014;111:3158–3163. doi: 10.1073/pnas.1318954111. [DOI] [PMC free article] [PubMed] [Google Scholar]
- 81.Hashimoto H., Shintani N., Ago Y., Hayata-Takano A., Nakazawa T., Hashimoto R., Matsuzaki S., Katayama T., Tohyama M., Matsuda T., Baba A. Implications of PACAP signaling in psychiatric disorders. In: Reglodi D., Tamas A., editors. Pituitary Adenylate Cyclase Activating Polypeptide—PACAP. Springer; 2016. pp. 757–766. [Google Scholar]
- 82.Gross N., Ranjbar M., Evers C., Hua J., Martin G., Schulze B., Michaelis U., Hansen L.L., Agostini H.T. Choroidal neovascularization reduced by targeted drug delivery with cationic liposome-encapsulated paclitaxel or targeted photodynamic therapy with verteporfin encapsulated in cationic liposomes. Mol. Vis. 2013;19:54–61. [PMC free article] [PubMed] [Google Scholar]
- 83.Wang Y., Gao S., Ye W.-H., Yoon H.S., Yang Y.-Y. Co-delivery of drugs and DNA from cationic core-shell nanoparticles self-assembled from a biodegradable copolymer. Nat. Mater. 2006;5:791–796. doi: 10.1038/nmat1737. [DOI] [PubMed] [Google Scholar]
- 84.Ruozi B., Belletti D., Tombesi A., Tosi G., Bondioli L., Forni F., Vandelli M.A. AFM, ESEM, TEM, and CLSM in liposomal characterization: a comparative study. Int. J. Nanomedicine. 2011;6:557–563. doi: 10.2147/IJN.S14615. [DOI] [PMC free article] [PubMed] [Google Scholar]
- 85.Das K.P., Freudenrich T.M., Mundy W.R. Assessment of PC12 cell differentiation and neurite growth: a comparison of morphological and neurochemical measures. Neurotoxicol. Teratol. 2004;26:397–406. doi: 10.1016/j.ntt.2004.02.006. [DOI] [PubMed] [Google Scholar]
Associated Data
This section collects any data citations, data availability statements, or supplementary materials included in this article.