

Summary
To understand the emergent properties of neural circuits it would be ideal to record the activity of every neuron in a behaving animal and decode how it relates to behavior. We have achieved this with the cnidarian Hydra vulgaris, using calcium imaging of genetically engineered animals to measure the activity of essentially all of its neurons. While the nervous system of Hydra is traditionally described as a simple nerve net, we surprisingly find instead a series of functional networks that are anatomically non-overlapping and are associated with specific behaviors. Three major functional networks extend through the entire animal and are activated selectively during longitudinal contractions, elongations in response to light and radial contractions, while an additional network is located near the hypostome and is active during nodding. These results demonstrate the functional sophistication of apparently simple nerve nets, and the potential of Hydra and other basal metazoans as a model system for neural circuit studies.
Keywords: Hydra, Nerve net, Calcium Imaging
eTOC blurb
The nervous system of Hydra is traditionally described as made of two nerve nets. By using calcium imaging, Dupre and Yuste demonstrate the existence of multiple circuits within these nerve nets and show to which behavior they are associated.
Introduction
Understanding the function of any nervous system is a daunting task given the number of neurons involved and the difficulty in measuring and analyzing their activity. Cnidarians, as a sister group of bilaterians, are extant representative of some of the earliest animals in evolution to have nervous systems and thus offer an apparent simplicity that could help illuminate the structural and functional design principles of neural circuits. Among cnidarians, Hydra is convenient to maintain and manipulate in a laboratory and, consequently, has been studied for more than 300 years [1]. The nervous system of Hydra is composed of a few hundred to a few thousand neurons, depending on the size of the animal [2]. Two main types of neurons have been reported: sensory cells, exposed to the external or gastric environment, and ganglion cells, which form a two-dimensional lattice known as nerve net [3,4]. Hydra’s nerve net has actually two separate components: one in the endoderm and one in the ectoderm. The morphology of both sensory cells and ganglion cells can vary, in terms of the size of their cell body and the ramification of their neurites [5].
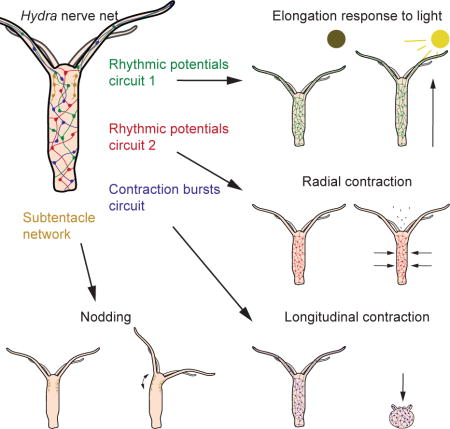
The function of nerve nets in Hydra is poorly understood. Extracellular recordings reported multiple types of electrical activity, some of which are associated with motion or occur in response to sensory stimulation. Specifically, longitudinal contraction of the ectoderm, which reduces the animal down to a tight ball, is associated with a type of extracellular electrical signals named longitudinal contraction bursts (CB) [6]. Tentacles sometimes also generate electrical pulses (tentacle pulses), found during contractions [7,8]. But in addition, Hydra displays robust spontaneous electrical activity, i.e. activity in the apparent absence of any external stimulus and, sometimes, also in the absence of any clear behavior. One example of this are the rhythmic electrical potentials [6,9], which have been thought to propagate in the endoderm of the animal [10] and to increase in frequency during elongation of the body column [6]. Activation of the endoderm by rhythmic potentials is thought to cause radial contraction (reduction of the radius of the animal) and therefore elongation [11,12].
Hydra has a limited and well-characterized behavioral repertoire, including photic response and feeding. A dark-habituated Hydra that is exposed to light will respond by elongating its body towards it, bending its hypostome-tentacle junction to produce a motion reminiscent of nodding [13,14], and eventually moving towards the light source by somersaulting [15]. Feeding includes a combination of tentacle motion to spear and paralyze the prey with nematocysts in order to bring the prey towards the mouth, which opens to ingest it [16]. A few hours after ingestion, the content of the body column is expelled through the mouth by a quick radial (as opposed to longitudinal) contraction of the body column after the mouth has opened [17].
Elucidation of the links between neuronal activity, anatomy and behavior in Hydra has been difficult because of technical limitations. Single-cell recording approaches are difficult because Hydra neurons are small and scattered [18], although intracellular recordings reveal action potentials [19]. Extracellular studies have provided detailed descriptions of electrical signals but could not link them to a particular cell type. In fact, whether rhythmic potentials and longitudinal contraction bursts are conducted by neurons or by the muscle/epithelial cells is still under debate [10,20,21], and surgical isolations indicate that they can propagate along both axes of the epithelium [8]. Also, extracellular recordings, which could be more akin to electromyograms, can be disrupted by the motion of the animal [9], and therefore cannot be carried out in certain types of behavior. Accordingly, one does not know how many networks exist in the nervous system of Hydra and to what behavior each of them participates.
The application of modern molecular methods to Hydra has the potential to greatly advance our understanding of these essential neurobiological questions. In particular, the recent sequencing of Hydra has revealed a surprisingly rich genome [22]. Indeed, in spite of its basal metazoan lineage, the Hydra genome is endowed with more than 20,000 genes including an extensive complement of neuronal molecular families such as sodium, potassium and calcium channels, and receptors for glutamate, GABA, Dopamine, 5HT, and many peptides. Many of these molecules are even present in animals that are evolutionary more basal than cnidarians, such as the poriferans (sponges) [23]. Also, stable transgenic lines have been achieved [24], enabling the use of a large range of modern molecular tools. Among these tools, genetically-encoded calcium indicators are particularly well suited for functional studies of the Hydra nerve net for many reasons. First, calcium imaging can track the action potential activity of neuronal populations [25]. Second, the small size of Hydra (500 μm to 1.5 cm in length) makes it possible to have an entire animal under the field of view of a traditional microscope. Third, Hydra is transparent and its scattered nerve-net organization (disadvantageous for electrophysiological recordings) is advantageous for imaging. Indeed, it is rare that two neurons optically overlap during imaging so it is therefore easier to obtain single-neuron resolution. Fourth, Hydra does not age [26], so the same animal can be used in an indefinite number of experiments. This can reduce the number of confounding factors and make statistical interpretation more accurate. Fifth, Hydra regenerates which makes it more robust against photodamage. Other cnidarians are available, such as Hydractinia, Aglantha and Nematostella. These animals offer various advantages, such as the broad range of genetic tools that are available in Nematostella [27]. In spite of the fact that these species might not have the same optical advantages as Hydra, running similar experiments in them would offer exciting comparative perspectives between the nervous system of anthozoans (e.g. Nematostella) and hydrozoans (e.g. Hydra). To take advantage of these properties and explore the possibility of performing neural circuit studies of Hydra, we created a line expressing a calcium indicator (GCaMP6s) in neurons. Using it, we attempted to link neuronal activity with the anatomy of the nerve net and the behavior of the animal.
Results
Imaging the complete activity of the nervous system of Hydra
In order to record the activity of the entire nervous system of Hydra simultaneously we first generated a line of transgenic animals expressing a genetic calcium indicator and then developed a method to image whole individuals. To generate the transgenic line, we modified a plasmid initially designed by R. Steele (UC Irvine; Addgene cat#34789) [28] and which expresses GFP under the control of an actin promoter. In the sequence of this plasmid, we substituted GCaMP6s for GFP (see Supplemental Material). We then injected the plasmid in fertilized Hydra eggs (Figure 1A) according to an established procedure [29] (see also Supplemental Experimental Procedures), with the goal of incorporating the plasmid into the interstitial cell lines, which give rise to the neuronal lineage.
Figure 1. Imaging the entire nervous system activity of Hydra.

A. To create the transgenic line, we injected into fertilized Hydra eggs (left) a plasmid that causes expression of GCaMP6s (right). B. Imaging preparation (left) and sample cross-section (right). C. Left: trajectory of 5 representative neurons. Middle: close-up on the trajectory of the 8 tracked neurons, showing a difference in direction of the neurons of the top layer (blue) versus the neurons of the bottom layer (red). Right: Single calcium spikes in neurons from both layers (top; see also Figure S2), with manual detection of coactivation events (bottom). D. First frame (top left), trajectory of all neurons (top right), close-up on the position of 2 representative neurons (bottom left) and fluorescence (bottom right) of all the detected neurons during a typical recording. Measurements were made on the first 20 seconds (real time, i.e. 1.6 seconds of movie time) of Movie S1. E. Entire animal (left) imaged for more than one hour at 30 frames per second, with fluorescence signal (right) coming from the cell circled in yellow. See also Figures S1, S2 and S4 and Movies S1 and S2.
Animals generated were mosaic, with transgenic stem cells randomly scattered throughout the body. By repeatedly selecting buds that formed on a region of the parent that has higher concentration of transgenic stem cells than the rest of the body of the parent, we progressively increased the percentage of transgenic neurons in our colony. Once the percentage of transgenic neurons seemed to have reached a steady-state, we measured it by immunostaining animals for GCaMP6s (using a GFP antibody) and acetylated alpha tubulin, a pan-neuronal marker [30]. In these animals, 96 ±3 (SEM) % of cells positive for acetylated alpha tubulin also expressed GCaMP6s (see Figure S1). Since it is likely that a small percentage of neurons might not have been stained for GFP and/or for anti-acetylated alpha tubulin during the immunohistochemistry procedure, we concluded that the transgenic lines expressed GCaMP6s in essentially all of its neurons.
To image the activity of every neuron in the animal, we mounted specimens between two coverslips separated by a 100μm spacer, which is the average width of a small Hydra (Figure 1B) and imaged in wide-field mode at max 33Hz frame rate (Movie S1; cf experimental procedures). In such preparation, the animal can be considered as a hollow cylinder that is imaged from the side, between the top coverslip (top layer in Figure 1B), and the bottom coverslip (bottom layer in Figure 1B). Consequently, we expected to see two layers of neurons (the two sides of the cylinder) slide on top of each other as the animal is moving in this chamber. Indeed, we could identify the two body walls by measuring the trajectory of 8 neurons in a given region of interest, and plotting these trajectories on top of each other (Figure 1C, left and middle panels). Accordingly, the 8 trajectories essentially followed two different directions corresponding to the motion of the two layers of the animal. Moreover, we could detect calcium transients from neurons in both layers (Figure 1C, right panel). We ruled out the possibility that these fluorescence transients come from motion of the cells in and out of focus by comparing them to the signal we acquired from animals expressing GFP (rather than GCaMP6s) in neurons (Figure S2). For these reasons, we can conclude that our preparation allows us to image neuronal activity through the entire animal simultaneously.
In order to extract neuronal activity in spite of the motion of the animal, we manually tracked the trajectory of each neuron and measured their fluorescence intensity at each frame (cf experimental procedures; Figure 1D and Movie S2). Additionally, we attempted to correlate calcium signal with electrical activity of the neurons by approaching extracellular electrodes (Figure 2A). We were not able to record the electrical activity of CB neurons, because whenever they fired the electrical signal generated by the contracting muscles overwhelmed any other signal (Figure 2B). However, we were able to record electrical signals from rhythmic potentials neurons, because they can occur when the animal does not move. The calcium transients we observed all had the same amplitude, and the electrical activity that corresponded to them always involved a single spike (Figure 2C–D). Therefore, each RP calcium transient corresponded to one action potential.
Figure 2. Simultaneous recording of electrical activity and calcium imaging.
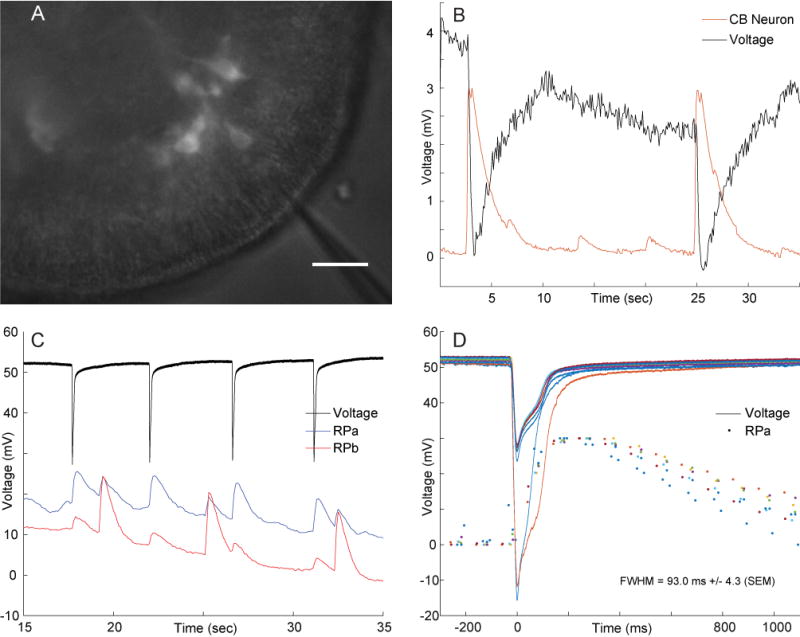
A. Preparation (scale bar = 20 μm). Electrode comes from the top and is slightly out of focus B. Extracellular electrode placed near a contraction burst neuron, with fluorescence signal recorded from that contraction neuron. Contractions produce overwhelming electrical signal. C. Extracellular electrode was placed close to a neuron from one RP network (RPa, which could be either RP1 or RP2) and far from a neuron from the other RP network (RPb). Accordingly, the spikes recorded in electrical activity match calcium spikes of neuron A (blue trace) but not neuron B (red trace). Note that there is cross-contamination between the fluorescence signals from neuron A and B, but one can distinguish them because of their amplitude difference (large spikes in neuron A result in small spikes in neuron B and vice-versa). D. Superimposition of nine spikes from extracellular recording and their corresponding calcium traces for neuron A. The color of each electrical trace matches the color of the corresponding fluorescence trace. In B–D, the fluorescence traces are in arbitrary units.
Using these traces for each neuron, we built rasterplots representing the activity of every neuron over hundreds of frames (Figure 1D). Note that each animal can have a different number of neurons, as Hydra can grow and shrink depending on its food intake [2]. In addition, we tested how fast and for how long we could image these animals in our preparation. The duration of recording was limited by photobleaching and phototoxicity, which we assessed by measuring fluorescence intensity and neuronal activity, respectively. The speed of recording in our preparation was limited by the minimum acquisition time of the camera (30ms). At this maximum speed, it was possible to continuously record neuronal activity for more than one hour without any apparent toxicity and little bleaching (Figure 1E). Because our staining indicates that every neuron was transgenic and our recording technique could image both layers of the animal, we believe to be close to imaging the activity of every neuron of Hydra simultaneously. Using these recordings, we classified the neurons of Hydra according to their morphologies, activity patterns, or any behavior observed.
Functional networks of neurons in Hydra
We define functional networks as groups of neurons that participate in a common function such as a particular behavior. Among these functional networks, we observed three of them where neurons spanning the entire body of the animal were coactive (Figure 3A, red, green and blue dots). Here, we define coactive as firing within the same 100ms frame (Movie S1), acknowledging that with a higher temporal resolution we might be able to measure a delay between the activation of different neurons. Interestingly, these three networks were non-overlapping, i.e. any neuron belonging to one network did not belong to any of the other two networks. Additionally, we observed small functional networks of neurons located under the tentacles-hypostome junction and individual neurons showing slower calcium transients rather than spikes (Figure 3A, yellow dots). We extracted every spike and slow calcium transients of the neurons recorded in a segment of the movie (Figure 3B). Accordingly, we reported in that segment a total of 14 activity epochs, 4 of them belonging to the coactive circuits.
Figure 3. The nervous system of Hydra includes three major networks.

A. Topographical distribution of neurons in Hydra (same dataset as Figure 1D), grouped in 5 categories: rhythmic potentials #1 (RP1, green), rhythmic potentials #2 (RP2, red), longitudinal contraction bursts (CB, blue) and other neurons (others, yellow). CB’ indicates neurons of the tentacles which did not fire during the two CB events of this time window, but fired during another CB event. B. Spikes (black) and slow calcium transients (grey) of the 559 cells shown in A. Neurons are grouped by identity (colored dots on the right), and activity events are marked with an arrow (top). Note the difference in scale between the y axis of the top and bottom plots, due to the large number of neurons belonging to RP1, RP2 and CB. Also, note that the 2 activity epochs labeled as CB are the last 2 spikes of a longitudinal contraction burst. C. Left: Spiking activity of the three networks in one representative animal. Each spike represents the coactivation of the neurons of one network (RP1, RP2 or CB). Arrows indicate decrease in RP1 frequency during a longitudinal contraction burst. Middle: Cross-correlation between RP1 and CB. Right: plot of the firing frequency over time of the three networks. Numbers indicate longitudinal contraction bursts. D. Cumulated (over 7 animals) cross-correlation between RP1–RP2 (left), RP1-CB (middle) and RP2-CB (right).
One of the coactive networks involved neurons which became active during a longitudinal contraction burst (CB), which is one of the most commonly described behaviors of Hydra [9,31]. Such bursts happened on average once every 4.4 min (±53 sec (SEM), n = 6 animals). In addition, we found networks of neurons active spontaneously, apparently corresponding to the rhythmic potentials (RPs) [9]. Unexpectedly, we found not one but two independent networks of cells generating these rhythmic potentials (Figure 3A, green and red dots), which we named RP1 and RP2 and which fired on average once every 167 sec (± 102 sec (SEM), n = 8 animals) and 143 sec (± 21 sec (SEM), n = 8 animals), respectively.
Interactions between rhythmic potentials and longitudinal contraction bursts have been described previously [14]. Since they only assumed the existence of one RP system, we explored whether this was true for both RP networks. To examine this, we extracted the activation events of the CB, RP1 and RP2 in longer movies (up to one hour) in multiple animals and computed their cross-correlation (see Supplemental Experimental Procedures). Indeed, RP1 showed short-term interruptions when CB became active (see arrows under spike train in Figure 3C), which results in a dip at T=0 in the cross-correlogram between RP1 and CB (Figure 3C middle) and a decrease in RP1 frequency when CB frequency increases (cf. leftward inclination of the loops in Figure 3C right). This indicates an antagonistic interaction between RP1 and CB and was present in 7 animals (Figure 3D middle). At the same time, no detectable relationship was found between RP1 and RP2 (left) or between RP2 and CB (right).
RP1 and CB networks are ectodermal while RP2 is endodermal
We then examined the anatomical characteristics of the three widespread networks. Since neurons of a given network fire within the same frame (up to 30 ms in our fastest recordings) we assumed they must be connected into the same circuits either via chemical or electrical synapses. Since no neuronal connection has been described in Hydra between the endodermal and the ectodermal nerve net [32], we assumed that each of RP1, RP2 and CB can only exist in one nerve net (either endodermal or ectodermal). We reasoned that the CB system should be in the ectoderm because ectodermal neurons innervate the longitudinal (vertical) muscle fibers of the ectodermal skin cells in order to cause body wall longitudinal contractions. In addition, previous studies showed that the rhythmic potentials exist in the endodermal nerve net [10] and cause longitudinal contractions of the endoderm [12] which has been interpreted as producing elongation of the body column of the animal [11], because endodermal muscle cells are arranged circularly (horizontally). However, if rhythmic potentials were generated by the endodermal nerve net, they would not be able to interact with CB neurons (as shown in Figure 3D) which are in the ectoderm. Thus, we hypothesized that RP1 is in the ectoderm, which allows it to interact with CB, whereas RP2 should be in the endoderm, which prevents it from interacting with CB and RP1.
To test this hypothesis, we measured the presence of neurons belonging to the three networks in regions of our recordings that only contain the ectoderm of the animal, by taking advantage of the fact that, in our preparation, the animal is laid flat between 2 coverslips. Thus, when imaged from the objective, there is an area at the edge of the animal composed of ectoderm only, whereas the rest of the animal is a superimposition of both endoderm and ectoderm (dashed lines in Figure 4A). Accordingly, we only found RP1 neurons in areas containing ectoderm only (arrows), whereas we found RP1 and RP2 neurons in areas containing both endoderm and ectoderm. We concluded that RP1 is in the ectodermal nerve net whereas RP2 is in the endodermal nerve net.
Figure 4. Anatomical differences between the three major networks.

A. Pseudocolored (cf methods) RP1 and RP2 networks in an animal’s body column. Top: RP1 only, middle: RP2 only, bottom: RP1 + RP2. Areas containing the ectoderm only and the endoderm + ectoderm are delineated with white dashed lines and six example neurons present in the “ectoderm only” area are marked with an arrow. B. Pseudocolored neurons representative of each of the 4 main categories. C. Soma size. D. Number of primary neurites. Note that jitter was added to the data points so that they do not overlap exactly on the plot. E. Orientation of primary neurites in neurons of the three main networks. The method to measure the angle at each neurite is described in the top-left panel. F. Neuron density in various body areas. G. Percentage of neurons belonging to each network. Data are represented as mean ± SEM. * indicates P<0.05 (unpaired T-Test). See also Figure S3.
We then tested whether neurons of RP1, RP2 and CB had different morphological features by comparing their soma size, number of primary neurites, and orientation of primary neurites (Figure 4B). We also measured these parameters for the individual neurons that did not participate in these three networks (“other” cells). The somata of CB neurons was larger when compared to all other categories (10.73 μm ± 0.62 (SEM); P<0.01, unpaired T-Test) (Figure 4C). Meanwhile, the number of primary neurites was higher (P<0.01, unpaired T-Test) in RP2 neurons (3.2 ± 0.1) than in RP1 (2.78 ± 0.1), CB (2.9 ± 0.06) and other neurons (0.86 ± 0.2) (Figure 4D). The number of primary neurites of the other neurons was significantly smaller than all other networks (P<0.01, unpaired T-Test). Some of these neurons possessed one short branch (Figure 4B), a feature that is very characteristic of the sensory neurons which have been reconstructed from serial section electron microscopy [3]. The orientation of the primary neurites was also measured (Figure 4E), by using the oral-aboral axis as a reference (top-left panel). No specific orientation was found for any of the three major networks.
To further identify the spatial structure of the three networks, we first examined the overall distribution of neurons, finding that the overall density of neurons was higher in the hypostome (3679 ± 401 neurons/mm2) than in any other part of the animal (P<0.05, Paired T-test, n=5) and higher in the peduncle (2668.5 ± 264) than in the body column (1339.7 ± 234) (P<0.05, Paired T-test, n=5; Figure 4F). These measurements match previous studies [5,33], where the authors dissociated specific parts of Hydra (hypostome, body column and peduncle) and measured the ratio between neurons and skin cells in each part. Other studies using staining methods came to similar conclusions [34–37]. Using these measurements, we calculated that CB and RP1 neurons involved a large proportion of the neurons in the animal (36.8% ± 1.87 and 37.1 ± 1.6), as compared with RP2 (16 ± 2) and single other cells (9.93 ± 1.17) (P<0.05, paired T-Test; Figure 4G). This quantification also supports that RP2 is generated by the endodermal nerve net, since previous studies [5] showed a 1/5 ratio (20%) between endodermal and ectodermal neurons, which is similar to the ratio we found (22%) between the number of neurons participating in RP2, as compared with the sum of neurons in the RP1 and CB networks (see Figure S3). Additionally, this quantification supports our earlier claim that the other neurons are probably sensory cells, since previous studies [3] also reported a very small proportion of sensory cells, as compared with ganglion cells.
Taken together, our data indicate that CB and RP1 networks are composed of two independent sets of ectodermal neurons, whereas the RP2 network is endodermal. Cells that are not part of these networks are likely to be sensory neurons.
RP1 is associated with elongations and RP2 with radial contractions
We then examined whether the activity of these non-overlapping networks correlated with any behavior. As stated, CB activity was clearly associated with the longitudinal contraction bursts of the animal. Also, as rhythmic potentials were thought to be in the endodermal nerve net, their activation should cause contraction of endodermal muscles and elongation of the body in response to a photic stimulus. For these reasons, since we found that RP1 is ectodermal, we hypothesized that the RP circuit mediating photic response was RP2. To test this we measured the activity of the nervous system of Hydra following photic stimulation. We induced light response by first dark-habituating animals overnight under dim infra-red light (Figure 5A). When we switched to fluorescence imaging, the light emitted by the arc lamp caused photic stimulation which resulted in elongation response (Figure 5B, where dashed lines mark contour of animal before elongation; Movie S3). To our surprise, while all three networks were mostly silent during at least 40 seconds before elongation onset, only RP1, and not RP2, became active after elongation onset (Figure 5C). Therefore, we concluded that RP1, rather than RP2, is correlated with elongations. This is in fact consistent with the fact that neurons of the tentacles are connected to photosensors [30,38] and RP2 is not present in the tentacles (Figure 3A). Also, the fact that RP1 neurons cause elongation and CB neurons cause longitudinal contraction is consistent with the anti-correlation that we observed between them (Figure 3D) and hints at a push-pull mechanism where the morphology of the animal results from a combination of the activity of two opposed neural ectodermal networks. It is important to note that, as observed previously [6], the RP1 network is also active independently of the elongation response to light, which suggests that it might be correlated with other behaviors.
Figure 5. Behavioral association of two rhythmic potentials networks.

A. Dark-habituated animal at rest. B: elongation response during exposure to blue light (see Movie S3). Dashed line marks body contour of animal at rest. C: spike trains of RP1, RP2 and CB neurons in 4 animals, where t=0 indicates onset of elongation. Histograms compare firing frequency before vs during elongation response. D: Animal before radial contraction, a behavior that also occurs in unrestrained preparations (Movie S5). E: animal after radial contraction (see Movie S4). Dashed line marks body contour of animal before radial contraction. F: Spike trains of RP1, RP2 and CB neurons in 8 animals, where t=0 indicates radial contraction. Histograms compare firing frequency before vs after radial contraction. Data are represented as mean ± SEM. * indicates (P < 0.05, paired T-Test). See also Movies S3–S5.
We then turned our attention to the functional role of RP2. To our surprise, we discovered that radial contraction was also linked to a change in the frequency of rhythmic potentials, but that this change was specific to RP2. The slow radial contraction behavior was readily noticed in our time-lapse movies, if we played them at various speeds to recognize changes in animal morphology that happen at slower time scales (Figure 5D–E; see also Movie S4). Indeed, the frequency of RP2 decreased significantly after radial contraction (P < 0.012, paired T-Test), whereas the activity of the other networks did not change. Additionally, the frequency of RP2 was on average 10 times higher than RP1 and CB, which indicates a particularly high level of excitation before radial contraction. Therefore, we concluded that RP2 participates in radial contraction. This is consistent with the fact that RP2 is located in the endoderm (Figure 4A), and that endodermal neurons are connected to sensory cells which are exposed to the gastric environment [3]. In this context, RP2 neurons could act as an integrator of information about the gastric environment which would put them in a position to decide when radial contraction has to occur. If we consider the body column of Hydra as a cylinder, the relaxation of the ectodermal longitudinal fibers by RP1 during elongation would change its length whereas the activation of the endodermal circular fibers by RP2 during radial contraction would change its diameter.
Thus, we concluded that the three networks are involved in three different behaviors selectively: the longitudinal contraction bursts are correlated with the activity of CB, the elongation response to light with RP1 and the radial contraction with RP2. Thus, rather than being a single network, the nerve net of Hydra creates different behaviors by using anatomically separate networks of neurons.
Subtentacle network is associated with nodding
Besides the three animal-wide networks (CB, RP1 and RP2), where synchronous activation of neurons occurred throughout the body of the animal, we also observed local activation of neurons in some experiments. In particular, there was one local network that did not belong to either RP1, RP2 or CB and that was correlated with nodding behavior, i.e., gentle swaying of the hypostome of the animal and its tentacles to one side but without turning the rest of the body. This network was located just under the tentacles and we decided to call it the subtentacle network (STN). Specifically, the STN was located at the junction between the tentacle and the body column (Figure 6A). In the STN, calcium signal could propagate downward (Figure 6B) but also upward (Figure 6C). Note that in the example shown in Figure 6 neuron 1 is only activated when the signal propagates downward, which indicates that the activation of the STN circuit does not always recruit all of its neurons. The propagation speed of the calcium signal was 251 μm/sec ±54.6 (SEM, n=5).
Figure 6. Subtentacle network (STN) causes nodding behavior and can conduct signal in both directions.

A. Representative Hydra. White square marks area containing a STN. Arrows mark the two directions of propagation: upward and downward. B. Left: Region boxed in A during downward propagation, with 4 neurons marked with a white square. Right: Calcium trace of the 4 neurons during downward propagation. C. Same as B but for upward propagation. D. Left: representative Hydra at the end of nodding. θ marks angle, arrow marks one STN neuron. Right: evolution of angle and STN neuron activity over time.
The behavioral correlation of the STN with nodding was robust: when activated, the animal always nodded (4 out of 4 animals). To quantify this, we measured the angle formed between the hypostome and the body column (Figure 6D left) as the fluorescence of the STN neurons changes and observed that the hypostome of the animal starts nodding at the same time as the neurons get activated (Figure 6D right). We did not notice any difference in nodding when the activation was upward or downward.
Neuronal activity can propagate in 2 directions and at 2 different speeds in tentacles
In addition to the STN, we found another example of a local activation of neurons in the tentacles, where propagation can be bidirectional and occur at multiple propagation speeds. Specifically, in the tentacles of 4 animals we detected calcium signal which propagates slowly, enabling us to determine the exact direction of propagation of activity. We observed that activity could flow upward or downward (Figure 7A and 7B, first part of the traces) and, interestingly, in both cases slow propagation was followed by coactivation of all regions of interest (Figures 7A and 7B, second part of the traces). The average speed of the slow propagating activity was 63 ± 30 μm/sec (SEM, n=4), whereas during coactivation, the speed of signal propagation could not be measured at our resolution of 33Hz (here on a field of view of 130×130 μm). This speed was therefore higher than 7 mm/sec, consistent with previous electrophysiological measurements that indicated 4.6 cm/sec [9]. However, since we cannot measure the speed of this signal propagation, it is possible that these different regions of interest are not activated in the same sequence and instead are activated in a random fashion. In all 4 observations, the neurons mediating slow propagation and coactivation were also part of the CB network, and coactivation corresponded to a longitudinal contraction burst.
Figure 7. Signal propagates in both directions and at two different speeds in tentacles.
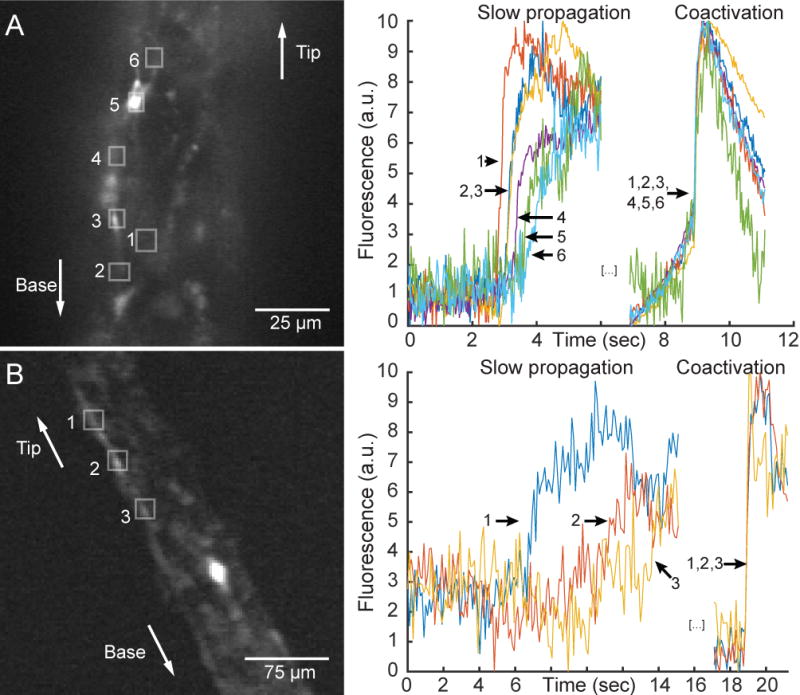
A. Left: Representative tentacle during upward propagation, with 6 example neurons boxed and numbered in white. Right: Calcium signal of the 6 neurons during slow propagation and coactivation. B. Same as A but for downward propagation.
Discussion
Hydra as a novel preparation for whole nervous system imaging
As opposed to conventional electrical circuits, the brain is made of neurons that receive and send connections to a large number of other neurons in many different regions at the same time. This organization appears ideal for the generation of emergent functional properties, built with the aggregate spatiotemporal activity of a large number of cells, and these emergent functional states, such as attractors, could be used to implement memories and many computations [39,40].
To capture these emergent states of function, it seems ideal to be able to measure “every spike from every neuron” and build a “Brain Activity Map” [41], as a step towards deciphering the role of these emergent states in the function of the nervous system or in the generation of behavior or internal brain states. In this regard, whole-brain imaging methods have been recently successful in measuring the activity of large numbers of neurons in animal models such as the worm [42–45], fruit fly [46,47] and zebrafish [48–53]. Work on these species could provide critical insights relevant to understanding the function of the nervous system of mammals and humans.
Here we introduce Hydra as an alternative for large-scale measurements of neural activity and to capture and investigate the emergent properties of neural systems. The choice of each animal model has pluses and minuses. While one cannot apply to Hydra traditional genetic tools, through the recent sequencing of its genome [22] and the development of successful transgenesis [24] one can have access to many of the modern molecular approaches standard in other fields of neuroscience. Also, as a preparation, Hydra offers some significant advantages for imaging entire nervous systems. Firstly, it is a cnidarian, and thus represents some of the first nervous systems in evolution, which could enable the elucidation of basic principles of neural circuits more easily. Secondly, Hydra can reproduce asexually by budding, enabling the generation of clonal individuals and the examination of the structural and functional generation of a new animal. Thirdly, its nervous system is distributed without any ganglia, and the animal is transparent, so every neuron can be imaged in isolation. Fourthly, because the body of Hydra is flexible, it is possible to place it between two coverslips separated by 100 μm and keep the animal alive for weeks without observing any sign of injury. The behaviors we measured in this study, longitudinal contraction bursts, elongation response to light and nodding do occur in Hydra’s natural habitat [6,9,13,14]. Because the definition of radial contraction is vague, we verified it by ourselves in an unrestrained preparation (Movie S5). However, in our restrained preparation these behaviors might be expressed in a different way. Typically, nodding and elongation response to light will only be possible on the plane that is parallel to the coverslips. Also, longitudinal and radial contractions could be somewhat slowed down because of friction of the animal against the coverslips, and the deformation of the body of the animal could be altered. To test this, we measured the duration of both types of contractions and resulting change in width of the animal (Figure S4), and did not detect any significant difference between these behaviors in an unrestrained preparation and between two coverslips.
When used with low-magnification objectives, such preparation allows having the entire network of neurons in focus and alleviates the need for scanning multiple planes in z. Therefore, it is possible to observe the activity of the entire nervous system of Hydra with a higher temporal resolution while keeping a spatial resolution of single neurons. These advantages make it easier to measure single calcium transients in a behaving animal and attribute them correctly to the neurons that generated them, getting to the ideal of measuring every spike from every neuron [41]. In fact, using immunocytochemistry we estimate that we are indeed recording the activity of essentially every neuron in the animal. Moreover, at least for many neurons, we are likely also imaging individual calcium transients.
As an animal model for circuit neuroscience, Hydra is amenable for imaging and offers a small repertoire of behaviors to study. We presented the activity of the nervous system during longitudinal contraction bursts, elongation response to light, radial contraction and nodding, but other behaviors exist such as somersaulting and feeding. Both of these behaviors add another layer of complexity, because they happen in multiple steps which require coordination of activity across the entire animal. For instance, feeding behavior engages first a concerted motion of the tentacles, after which the prey is brought to the mouth in order to be swallowed and digested through peristaltic motion of the body column. Therefore, imaging Hydra during these behaviors would help exploring coordination of activity across different parts of its nervous system.
Nonoverlapping coactive networks of neurons in the nerve nets of Hydra
Using calcium imaging, we perform the first functional measurements of neurons in Hydra and can associate previously recorded electrical signal such as RPs and CBs to specific populations of neurons. Also, a striking feature of the RP1, RP2 and CB networks is the fact that their neurons are coactive (they fire simultaneously or at least within 100ms). We are still ignorant about the exact connectivity of these neurons, and the joint activity could be the result of either gap junctions connecting every neuron, strong chemical synapses that have a very low failure rate, or inputs from another circuit that is connected to every neuron of this network. Indeed, both chemical synapses and gap junctions have been found in Hydra [54,55], but a third circuit mediating coactivation seems less likely since we do not observe activity of any other circuit that is simultaneous to RP1, RP2 or CB.
But regardless of the exact mechanisms of coactivation, we have discovered that the nervous system of Hydra is divided into networks that are non-overlapping structurally and functionally, i.e., where individual neurons participate selectively in specific networks and no neuron belongs to more than one network. Moreover, these networks (CB, RP1, RP2 and STN) are associated with specific behaviors of the animal (longitudinal contractions, elongation, radial contraction, and nodding, respectively). As mentioned above, most neurotransmitters can be found in the Hydra genome, so there could be a molecular identification to the networks of neurons we identified functionally.
The finding of non-overlapping networks indicates that the nervous system of Hydra, and perhaps other cnidarians, is not a single nerve net but is built out of distinct networks which activity can be linked to specific behaviors. Thus, evolution has carved out a behavioral repertoire by selectively linking subsets of neurons out of a tapestry of apparently similar cells, since each subset of neurons is associated with a specific behavior. This carving could occur by selectively connecting neurons into subcircuits, or by modifying synaptic strengths. Future work combining connectomics with functional imaging could examine these mechanisms of functional specificity.
Two rhythmic potentials networks
The use of whole-brain calcium imaging has also allowed us to identify two networks associated with the rhythmic potentials, previously described using extracellular recordings [14]. These two networks (RP1 and RP2) are located in the ectoderm and endoderm of the animal respectively. A previous study reported that rhythmic potentials are only generated in the endoderm [10] by showing their absence in an area where the endoderm had been surgically removed. However, in that study the authors reported having recorded in rare instances rhythmic potentials in the ectoderm but they attributed this signal to an incomplete removal of the endoderm in the recorded region. According to our present results it is likely that in most cases the authors recorded the endodermal RP2 signal and in rare instances they recorded the ectodermal RP1 signal. Also, our report that contraction of the endoderm causes radial contraction is in apparent contradiction with the report that rhythmic potentials could cause contraction of the endoderm [12]. Indeed, since a change in the frequency of rhythmic potentials was observed during elongation response [6], it was concluded that contraction of endodermal cells would cause elongation of the animal. However, based on our data, we suggest that the contractions observed by [12] originated in the endodermal RP2 system which is correlated with radial contraction, whereas the response to light in [6] arose from the ectodermal RP1 which is correlated with elongation.
Interestingly, although RP1 and RP2 are associated with elongation and radial contraction, respectively, since changes in their frequency of activation were clearly associated with behavior, there was no clear cut temporal correspondence between the activity of RP1 and elongation or between the activation or RP2 and radial contraction (Figure 5). Thus, we hypothesize that, rather than directly triggering or controlling behavior, these two rhythmic potential networks may integrate sensory information which then subsequently triggers the behavioral response, through a different cellular element, perhaps even through epithelial cells.
Bidirectional propagation in the subtentacle network
Slow potentials that occur simultaneously to asymmetric longitudinal contraction of the body column were reported in [6]. However, in their experiments it was not possible to prove or exclude the participation of neurons. Here, we describe the activity of a specific network of neurons (the STN) that are located under the base of the tentacles and which are activated during such behavior.
The sequence of activation of the STN can either initiate in the body column and travel towards the tentacles, or initiate in the tentacle-hypostome junction and travel downward. This flexibility could have a role, such as fine-tuning the resulting motor output by changing which part of the body should bend first. Also, it may have no specific function but arise from the fact that the STN can be activated by different neurons. Indeed, it is possible that activity in the body column and in the hypostome can initiate STN activity. Then, depending on which one happens, the STN will start either at the hypostome-tentacle junction or in the body column.
Multiple conduction speeds
The existence of multiple conduction speeds within the same network has been described in other hydrozoans such as Aequorea [18] (p. 482) and anthozoans such as Calliactis [56]. For instance, in the hydrozoan Aequorea, the radial conduction system is slow (0.002–0.02 m/sec, i.e. 2–20 mm/sec) whereas the swimming beat system is much faster (0.9 m/sec). In our experiments, we observed that in the tentacles of Hydra there are calcium transients that travel at 63 ± 30 μm/sec (SEM, n=4) and others that might travel at more than 7 mm/sec which differs by two orders of magnitude. As mentioned above, the neurons where slow and fast propagation was observed are part of CB and it is only during fast propagation that longitudinal contraction occurred. Therefore, slow propagation could be the result of a different type of activity that is initiated in one neuron and travels to its neighbors. Such activity could increase the excitability of ganglion and sensory neurons, but could even affect the sensory structures such as nematocytes to which they are connected. In this regard, measuring calcium transients in nematocytes would provide valuable information to study their interactions with neurons.
Broader relevance to neuroscience
The findings presented here may extend to understand the structure and function of the nervous systems of other cnidarians and basal metazoans. The electrical activity and behaviors of other polyps and medusae has been studied before [18] and many similarities are shared among animals of this phylum. Such similarities include the existence of nerve nets, the spontaneous longitudinal contractions and the characteristic sequence in feeding behavior. Accordingly, the presence of two networks in the ectodermal nerve net and one network in the endodermal nerve net could be a general feature of the polyp form of cnidarians. From a different perspective one could take advantage of the subtle differences between polyps of different species, which change in size, shape and in the type of prey they feed on. In such comparative studies, one could test the role of a specific feature on the anatomy, electrical activity and behavior, in an animal where most of the other parameters are essentially the same.
In addition to the interest in the neurobiology of basal metazoans, studies on the nervous system of Hydra could have relevance to understand neural circuits in bilaterian species. Indeed, coordinated spontaneous activity, robustly present in Hydra, is common to all nervous systems observed, including visual cortex [57] and human EEGs. Additionally, it has been proposed that brain waves have evolved from an early form of spontaneous activity such as the one observed in Hydra [58]. Also, our finding that the activity of the endodermal nerve net is correlated with the activity of the gastric cavity (radial contraction, Figure 5B) is reminiscent of the enteric nervous system controlling the gastro-intestinal tract of higher animals. More generally, the study of simpler organisms could enable to discern some basic principles such as emergent properties of neural circuits, analyze the anatomical, biophysical and synaptic mechanisms that generate them, and understand how they relate to behavior or internal brain states.
Experimental procedures
Hydra maintenance
Hydra were maintained in the dark at 18C and were fed freshly hatched Artemia nauplii once a week or more frequently when necessary.
Transgenics
Transgenic lines were created according to Juliano et al, 2014 using a modified version of the pHyVec1 plasmid (Addgene cat#34789) [28] where we replaced the GFP sequence with a GCaMP6s sequence that was codon-optimized for Hydra (DNA2.0, Menlo Park, CA). By embryo microinjection one gets mosaic animals, where ectoderm, endoderm and interstitial lineages can become transgenic separately [59]. We selected animals only expressing GCaMP6s in the interstitial cell lineage. Also, interstitial cell lineage includes neurons, cnidocytes and gland cells. However, it was possible to discriminate them from neurons in our movies because of their morphological features (only neurons have neurites).
Imaging
In order to record the activity of the nervous system of Hydra, we developed a new preparation for functional imaging. Animals were placed between two coverslips that are separated by one 100um spacer to keep them on focus. In this preparation, animals might not behave as they would in their natural habitat. However, it makes it convenient to look at the activity of the nervous system of Hydra during specific behaviors. Imaging was performed using a fluorescence dissecting microscope (Leica M165) equipped with a long-pass GFP filter set (Leica filter set ET GFP M205FA/M165FC), a 1.6× Planapo objective and a sCMOS camera (Hamamatsu ORCA-Flash 4.0) or an Olympus IX-70 inverted microscope equipped with 10× water immersion objective, a U-MIWIB2 GFP filter cube and an EM-CCD (Hamamatsu EM-CCD C9100-12). In both setups, illumination came from a mercury arc lamp and the software micromanager [60] controlled the microscope. Single neurons were tracked manually, frame by frame, using the graphic user interface of TrackMate [61] and no automated tracking algorithm was ever used (Movie S2). Such single neuron tracking was only performed to generate Figure 1D and 3B and show that the three circuits of neurons (RP1, RP2 and CB) are mutually exclusive. When a neuron was particularly challenging to track (cf blue circle in Figure 1D bottom left), visual landmarks from the surrounding tissue were used as guiding points. For the rest of the manuscript, we only measured at which frame these (RP1, RP2 and CB) networks of neurons fire, which we call “coactivation events” (Figure 1C (right)). This is much more straightforward to measure for two reasons. First, whenever any of these circuits is activated, a larger number of neurons fire during the same frame which makes it easy to detect. Second, each circuit is easily recognizable: activation of CB always results in longitudinal contraction and RP1 but not RP2 invades the tentacles. Data coming from these measurements was then plotted as a spike train (Figure 1C (right, green bars), Figure 3 and Figure 5), where each spike indicates coactivation of all the neurons of that circuit. All the collected data was handled with MATLAB (The Mathworks, Natick, MA). The main advantage of this preparation is the fact that there is no need to scan in the z axis, and therefore the acquisition speed is only limited by the camera. The main disadvantage is the fact that by using widefield imaging rather than confocal or 2-photon imaging, the spatial resolution is worse (about 1μm for widefield when compared to less than 0.4 μm for the others). This can result in cross-contamination between regions of interest, and for instance increase in fluorescence of some RP1 neurons during a CB event because of light scattering coming from CB neurons lying in close proximity of the recorded RP1 neuron (e.g. in Figure 2C). This cross-contamination makes it difficult to tell whether a neuron is firing based on fluorescence trace alone. However, it is easy to tell in movies when a neuron is firing because its neurites are also lighting up. For this reason, the spike times were manually measured in the movies for each neuron.
Pseudocoloring
We used pseudocoloring as a method for identifying neurons that fired during the same frame (e.g. in Figure 4A). For a given firing event, using ImageJ [62] we subtracted the frame before neurons fired from the frame during which neurons fired. We then added the result of this subtraction in a specific color to the frame before neurons fired.
Electrophysiology
Sharp electrodes were pulled from borosillicate glass (Sutter cat# BF150-86-10) with a Sutter p97 pipet puller in order to obtain a resistance of 50-100 MΩ. They were then filled with 3M KCl and 40μM Alexa488. Animals were impaled under visualization with calcium imaging using a similar setup as in the previous experiments, except that the microscope was an upright Olympus BX51WI. Electrical signal was acquired with a MultiClamp 700B (Axon Instruments) and the software PackIO (packio.org).
Statistical methods
Statistics are indicated as average ± SEM in figures and in the text. Cross-correlation was computed between spike trains using the MATLAB function xcorr. To compare the number of spikes before vs after radial contraction, we ran a two-tailed paired T-test assuming equal variance using Microsoft Excel. To compare morphological parameters, 2-tailed, paired or unpaired student T-tests were used as specified in text.
Supplementary Material
Highlights.
Introduce Hydra as new model system for neural circuits
Functional anatomy of four behavioral responses
First complete Brain Activity Map achieved
Acknowledgments
We thank Sydney Brenner for suggestion to work on Hydra, Charles David, Rob Steele, Celina Juliano, Shuting Han and John Szymanski for technical help and comments; Kaniz Fatema, Stephen Leong and Sanjana Salwi for help with neuron tracking and Mac Passano and George Mackie for their correspondence. This work was supported by NIH Pioneer award DP1EY024503 (RY). This material is based upon work supported by the Defense Advanced Research Projects Agency (DARPA) under contract no. HR0011-17-C-0026 and the US Army Research Laboratory and the US Army Research Office (contract W911NF-12-1-0594; MURI).
Footnotes
Publisher's Disclaimer: This is a PDF file of an unedited manuscript that has been accepted for publication. As a service to our customers we are providing this early version of the manuscript. The manuscript will undergo copyediting, typesetting, and review of the resulting proof before it is published in its final citable form. Please note that during the production process errors may be discovered which could affect the content, and all legal disclaimers that apply to the journal pertain.
Author Contributions
Conceptualization, C.D. and R.Y.; Methodology, C.D. and R.Y.; Investigation, C.D.; Writing – Original Draft, C.D.; Writing – Review & Editing, C.D. and R.Y.; Funding Acquisition, R.Y.; Resources, C.D. and R.Y..
Conflict of interest: The authors declare no competing financial interests.
References
- 1.van Leeuwenhoek A. Green weeds growing in water, and some animalcula found about them. Philos Trans R Soc. 1702;art IV:1304–1311. [Google Scholar]
- 2.David CN. A quantitative method for maceration of hydra tissue. Wilhelm Roux Arch für Entwicklungsmechanik der Org. 1973;171:259–268. doi: 10.1007/BF00577724. [DOI] [PubMed] [Google Scholar]
- 3.Westfall JA, Wilson JD, Rogers RA, Kinnamon JC. Multifunctional features of a gastrodermal sensory cell in Hydra: three-dimensional study. J Neurocytol. 1991;20:251–261. doi: 10.1007/BF01235543. [DOI] [PubMed] [Google Scholar]
- 4.Parker GH. The Elementary Nervous system. Philadelphia: J. B. Lippincott Co.; 1919. [Google Scholar]
- 5.Epp L, Tardent P. The Distribution of Nerve Cells in Hydra attenuata Pall. 1978;193:185–193. doi: 10.1007/BF00848677. [DOI] [PubMed] [Google Scholar]
- 6.Passano LM, McCullough CB. the Light Response and the Rhythmic Potentials of Hydra. Proc Natl Acad Sci U S A. 1962;48:1376–82. doi: 10.1073/pnas.48.8.1376. [DOI] [PMC free article] [PubMed] [Google Scholar]
- 7.Rushforth NB, Burke DS. Behavioral and electrophysiological studies of Hydra. II. Pacemaker activity of isolated tentacles. 1971;140:502–519. doi: 10.2307/1540284. [DOI] [PubMed] [Google Scholar]
- 8.Kass-Simon G. Longitudinal Conduction of Contraction Burst Pulses from Hypostomal Excitation Loci in Hydra attenuata. J Comp Physiol. 1972;49:29–49. [Google Scholar]
- 9.Passano LM, McCullough CB. Co-ordinating systems and behaviour in Hydra. II. The rhythmic potential system. 1965 doi: 10.1242/jeb.42.2.205. [DOI] [PubMed] [Google Scholar]
- 10.Kass-Simon G, Passano LM. A Neuropharmacological Analysis of the Pacemakers and Conducting Tissues of Hydra attenuata. 1978;79:71–79. [Google Scholar]
- 11.Kay JC, Kass-Simon G. Glutamatergic transmission in hydra: NMDA/D-serine affects the electrical activity of the body and tentacles of Hydra vulgaris (Cnidaria, Hydrozoa) Biol Bull. 2009;216:113–25. doi: 10.1086/BBLv216n2p113. [DOI] [PubMed] [Google Scholar]
- 12.Shibley G. Gastrodermal contractions correlated with rhythmic potentials and prelocomotor bursts in Hydra. Am Zool. 1969;9:586. [Google Scholar]
- 13.Haug G. Die Lichtreaktionen der Hydren (Chlorohydra viridissima und Pelmatohydra oligactis) Z vergleich Physiol. 1933;19:246–303. [Google Scholar]
- 14.Passano LM, McCullough CB. Pacemaker Hierarchies controlling the behaviour of hydras. Nature. 1963;199:1174–1175. doi: 10.1038/1991174a0. [DOI] [PubMed] [Google Scholar]
- 15.Trembley A. Mémoires pour servir à l’histoire d’un genre de polypes d’eau douce, à bras en forme de cornes. Leiden, Netherlands: Jean and Herman Verbeek; 1744. [Google Scholar]
- 16.Ewer RF. On the functions and mode of action of the nematocysts of hydra. Proc zool Sot Lond. 1947;117:365–376. [Google Scholar]
- 17.Lasker HR, Syron JA, Clayton WS. The feeding response of Hydra viridis: effects of prey-density on capture rates. Biol Bull. 1982;162:290–298. [Google Scholar]
- 18.Bullock TH, Horridge GA. Structure and Function in the Nervous System of Invertebrates. San Francisco and London: W.H. Freeman a. Comp. Ltd; 1965. [Google Scholar]
- 19.Kass-Simon G, Diesl VK. Spontaneous and evoked potentials from dissociated epithelial cells of Hydra. Nature. 1977;265:75–77. doi: 10.1038/265075a0. [DOI] [PubMed] [Google Scholar]
- 20.Campbell RD, Josephson RK, Schwab WE, Rushforth NB. Excitability of nerve-free hydra. Nature. 1976;262:388–390. doi: 10.1038/262388a0. [DOI] [PubMed] [Google Scholar]
- 21.Ruggieri RD, Pierobon P, Kass-Simon G. Pacemaker activity in hydra is modulated by glycine receptor ligands. Comp Biochem Physiol A Mol Integr Physiol. 2004;138:193–202. doi: 10.1016/j.cbpb.2004.03.015. [DOI] [PubMed] [Google Scholar]
- 22.Chapman JA, Kirkness EF, Simakov O, Hampson SE, Mitros T, Weinmaier T, Rattei T, Balasubramanian PG, Borman J, Busam D, et al. The dynamic genome of Hydra. Nature. 2010;464:592–6. doi: 10.1038/nature08830. [DOI] [PMC free article] [PubMed] [Google Scholar]
- 23.Sakarya O, Armstrong KA, Adamska M, Adamski M, Wang IF, Tidor B, Degnan BM, Oakley TH, Kosik KS. A Post-Synaptic Scaffold at the Origin of the Animal Kingdom. PLoS One. 2007;2:e506. doi: 10.1371/journal.pone.0000506. [DOI] [PMC free article] [PubMed] [Google Scholar]
- 24.Wittlieb J, Khalturin K, Lohmann JU, Anton-Erxleben F, Bosch TCG. Transgenic Hydra allow in vivo tracking of individual stem cells during morphogenesis. Proc Natl Acad Sci U S A. 2006;103:6208–11. doi: 10.1073/pnas.0510163103. [DOI] [PMC free article] [PubMed] [Google Scholar]
- 25.Yuste R, Katz LC. Control of postsynaptic Ca2+ influx in developing neocortex by excitatory and inhibitory neurotransmitters. Neuron. 1991;6:333–344. doi: 10.1016/0896-6273(91)90243-s. [DOI] [PubMed] [Google Scholar]
- 26.Martínez DE. Mortality patterns suggest lack of senescence in hydra. Exp Gerontol. 1998;33:217–225. doi: 10.1016/s0531-5565(97)00113-7. [DOI] [PubMed] [Google Scholar]
- 27.Layden MJ, Rentzsch F, Röttinger E. The rise of the starlet sea anemone Nematostella vectensis as a model system to investigate development and regeneration. Wiley Interdiscip Rev Dev Biol. 2016;5:408–428. doi: 10.1002/wdev.222. [DOI] [PMC free article] [PubMed] [Google Scholar]
- 28.Dana CE, Glauber KM, Chan TA, Bridge DM, Steele RE. Incorporation of a horizontally transferred gene into an operon during cnidarian evolution. PLoS One. 2012;7:e31643. doi: 10.1371/journal.pone.0031643. [DOI] [PMC free article] [PubMed] [Google Scholar]
- 29.Juliano CE. Generation of Transgenic Hydra by Embryo Microinjection. J Vis Exp. 2014;91:e51888. doi: 10.3791/51888. [DOI] [PMC free article] [PubMed] [Google Scholar]
- 30.Plachetzki DC, Fong CR, Oakley TH. Cnidocyte discharge is regulated by light and opsin-mediated phototransduction. BMC Biol. 2012;10:17. doi: 10.1186/1741-7007-10-17. [DOI] [PMC free article] [PubMed] [Google Scholar]
- 31.Passano LM, McCullough CB. Co-ordinating systems and behaviour in Hydra. I Pacemaker system of the periodic contractions. J Exp Biol. 1964;41:643–664. doi: 10.1242/jeb.42.2.205. [DOI] [PubMed] [Google Scholar]
- 32.Hufnagel L, Kass-Simon G. The Ultrastructural Basis for the Electrical Coordination Between Epithelia of Hydra. In: Mackie GO, editor. Coelenterate Ecology and Behavior. New York: Springer US; 1976. pp. 695–704. [Google Scholar]
- 33.Tardent P, Weber C. A qualitative and quantitative inventory of nervous cells in Hydra attenuata Pall. In: Mackie GO, editor. Coelenterate Ecology and Behavior. New York: Springer US; 1976. pp. 501–502. [Google Scholar]
- 34.Hansen GN, Williamson M, Grimmelikhuijzen CJP. A new case of neuropeptide coexpression (RGamide and LWamides) in Hydra, found by whole-mount, two-color double-labeling in situ hybridization. Cell Tissue Res. 2002;308:157–65. doi: 10.1007/s00441-002-0534-y. [DOI] [PubMed] [Google Scholar]
- 35.Norgaard Hansen G, Williamson M, Grimmelikhuijzen CJP. Two-color double-labeling in situ hybridization of whole-mount Hydra using RNA probes for five different Hydra neuropeptide preprohormones: evidence for colocalization. Cell Tissue Res. 2000;301:245–253. doi: 10.1007/s004410000240. [DOI] [PubMed] [Google Scholar]
- 36.Koizumi O, Itazawa M, Mizumoto H, Minobe S, Javois LC, Grimmelikhuijzen CJ, Bode HR. Nerve ring of the hypostome in hydra. I Its structure, development, and maintenance. J Comp Neurol. 1992;326:7–21. doi: 10.1002/cne.903260103. [DOI] [PubMed] [Google Scholar]
- 37.Yum S, Takahashi T, Koizumi O, Ariura Y, Kobayakawa Y, Mohri S, Fujisawa T. A novel neuropeptide, Hym-176, induces contraction of the ectodermal muscle in Hydra. Biochem Biophys Res Commun. 1998;248:584–590. doi: 10.1006/bbrc.1998.8831. [DOI] [PubMed] [Google Scholar]
- 38.Guertin S, Kass-Simon G. Extraocular spectral photosensitivity in the tentacles of Hydra vulgaris. Comp Biochem Physiol Part A Mol Integr Physiol. 2015;184:163–170. doi: 10.1016/j.cbpa.2015.02.016. [DOI] [PubMed] [Google Scholar]
- 39.Hopfield JJ. Neural networks and physical systems with emergent collective computational abilities. Proc Natl Acad Sci U S A. 1982;79:2554–2558. doi: 10.1073/pnas.79.8.2554. [DOI] [PMC free article] [PubMed] [Google Scholar]
- 40.Hopfield JJ, Tank DW. “Neural” computation of decisions in optimization problems. Biol Cybern. 1985;52:141–152. doi: 10.1007/BF00339943. [DOI] [PubMed] [Google Scholar]
- 41.Alivisatos AP, Chun M, Church GM, Greenspan RJ, Roukes ML, Yuste R. The brain activity map project and the challenge of functional connectomics. Neuron. 2012;74:970–4. doi: 10.1016/j.neuron.2012.06.006. [DOI] [PMC free article] [PubMed] [Google Scholar]
- 42.Venkatachalam V, Ji N, Wang X, Clark C, Mitchell JK, Klein M, Tabone CJ, Florman J, Ji H, Greenwood J, et al. Pan-neuronal imaging in roaming Caenorhabditis elegans. Proc Natl Acad Sci U S A. 2016;113:E1082–8. doi: 10.1073/pnas.1507109113. [DOI] [PMC free article] [PubMed] [Google Scholar]
- 43.Nguyen JP, Shipley FB, Linder AN, Plummer GS, Liu M, Setru SU, Shaevitz JW, Leifer AM. Whole-brain calcium imaging with cellular resolution in freely behaving Caenorhabditis elegans. Proc Natl Acad Sci U S A. 2015:33. doi: 10.1073/pnas.1507110112. [DOI] [PMC free article] [PubMed] [Google Scholar]
- 44.Prevedel R, Yoon YG, Hoffmann M, Pak N, Wetzstein G, Kato S, Schrödel T, Raskar R, Zimmer M, Boyden ES, et al. Simultaneous whole-animal 3D imaging of neuronal activity using light-field microscopy. Nat Methods. 2014;11:727–30. doi: 10.1038/nmeth.2964. [DOI] [PMC free article] [PubMed] [Google Scholar]
- 45.Schrödel T, Prevedel R, Aumayr K, Zimmer M, Vaziri A. Brain-wide 3D imaging of neuronal activity in Caenorhabditis elegans with sculpted light. Nat Methods. 2013;10:1013–20. doi: 10.1038/nmeth.2637. [DOI] [PubMed] [Google Scholar]
- 46.Chhetri RK, Amat F, Wan Y, Höckendorf B, Lemon WC, Keller PJ. Whole-animal functional and developmental imaging with isotropic spatial resolution. Nat Methods. 2015;12:1171–1178. doi: 10.1038/nmeth.3632. [DOI] [PubMed] [Google Scholar]
- 47.Grover D, Katsuki T, Greenspan RJ. Flyception: imaging brain activity in freely walking fruit flies. Nat Methods. 2016;13:569–572. doi: 10.1038/nmeth.3866. [DOI] [PubMed] [Google Scholar]
- 48.Ahrens MB, Li JM, Orger MB, Robson DN, Schier AF, Engert F, Portugues R. Brain-wide neuronal dynamics during motor adaptation in zebrafish. Nature. 2012;485:471–7. doi: 10.1038/nature11057. [DOI] [PMC free article] [PubMed] [Google Scholar]
- 49.Dunn TW, Mu Y, Narayan S, Randlett O, Naumann EA, Yang CT, Schier AF, Freeman J, Engert F, Ahrens MB. Brain-wide mapping of neural activity controlling zebrafish exploratory locomotion. Elife. 2016;5:1–29. doi: 10.7554/eLife.12741. [DOI] [PMC free article] [PubMed] [Google Scholar]
- 50.Wolf S, Supatto W, Debrégeas G, Mahou P, Kruglik SG, Sintes JM, Beaurepaire E, Candelier R. Whole-brain functional imaging with two-photon light-sheet microscopy. Nat Methods. 2015;12:379–380. doi: 10.1038/nmeth.3371. [DOI] [PubMed] [Google Scholar]
- 51.Panier T, Romano SA, Olive R, Pietri T, Sumbre G, Candelier R, Debrégeas G. Fast functional imaging of multiple brain regions in intact zebrafish larvae using selective plane illumination microscopy. Front Neural Circuits. 2013;7:65. doi: 10.3389/fncir.2013.00065. [DOI] [PMC free article] [PubMed] [Google Scholar]
- 52.Portugues R, Feierstein CE, Engert F, Orger MB. Whole-brain activity maps reveal stereotyped, distributed networks for visuomotor behavior. Neuron. 2014;81:1328–1343. doi: 10.1016/j.neuron.2014.01.019. [DOI] [PMC free article] [PubMed] [Google Scholar]
- 53.Tomer R, Lovett-Barron M, Kauvar I, Andalman A, Burns VM, Sankaran S, Grosenick L, Broxton M, Yang S, Deisseroth K. SPED Light Sheet Microscopy: Fast Mapping of Biological System Structure and Function. Cell. 2015;163:1796–1806. doi: 10.1016/j.cell.2015.11.061. [DOI] [PMC free article] [PubMed] [Google Scholar]
- 54.Westfall Ja, Yamataka S, Enos PD. Ultrastructural evidence of polarized synapses in the nerve net of Hydra. J Cell Biol. 1971;51:318–23. doi: 10.1083/jcb.51.1.318. [DOI] [PMC free article] [PubMed] [Google Scholar]
- 55.Westfall Ja, Kinnamon Sims. Neuro-neuronal gap junctions in Hydra. J Neurocytol. 1980;9:725–732. doi: 10.1007/BF01205015. [DOI] [PubMed] [Google Scholar]
- 56.Mcfarlane ID. Two Slow Conduction Systems in the Sea Anemone Calliactis Parasitica. J Exp Biol. 1969;51:377–385. doi: 10.1242/jeb.51.2.377. [DOI] [PubMed] [Google Scholar]
- 57.Miller JEK, Ayzenshtat I, Carrillo-Reid L, Yuste R. Visual stimuli recruit intrinsically generated cortical ensembles. Proc Natl Acad Sci. 2014;111:E4053–61. doi: 10.1073/pnas.1406077111. [DOI] [PMC free article] [PubMed] [Google Scholar]
- 58.Passano LM. Primitive Nervous Systems. Proc Natl Acad Sci U S A. 1963:306–313. doi: 10.1073/pnas.50.2.306. [DOI] [PMC free article] [PubMed] [Google Scholar]
- 59.Khalturin K, Anton-Erxleben F, Milde S, Plötz C, Wittlieb J, Hemmrich G, Bosch TCG. Transgenic stem cells in Hydra reveal an early evolutionary origin for key elements controlling self-renewal and differentiation. Dev Biol. 2007;309:32–44. doi: 10.1016/j.ydbio.2007.06.013. [DOI] [PubMed] [Google Scholar]
- 60.Edelstein A, Amodaj N, Hoover K, Vale R, Stuurman N. Computer control of microscopes using μManager. Curr Protoc Mol Biol. 2010;92:14.20.1–14.20.17. doi: 10.1002/0471142727.mb1420s92. [DOI] [PMC free article] [PubMed] [Google Scholar]
- 61.Schindelin J, Arganda-carreras I, Frise E, Kaynig V, Longair M, Pietzsch T, Preibisch S, Rueden C, Saalfeld S, Schmid B, et al. Fiji: an open-source platform for biological-image analysis. Nat Methods. 2012;9:676–682. doi: 10.1038/nmeth.2019. [DOI] [PMC free article] [PubMed] [Google Scholar]
- 62.Schneider CA, Rasband WS, Eliceiri KW. NIH Image to ImageJ: 25 years of image analysis. Nat Methods. 2012;9:671–675. doi: 10.1038/nmeth.2089. [DOI] [PMC free article] [PubMed] [Google Scholar]
Associated Data
This section collects any data citations, data availability statements, or supplementary materials included in this article.