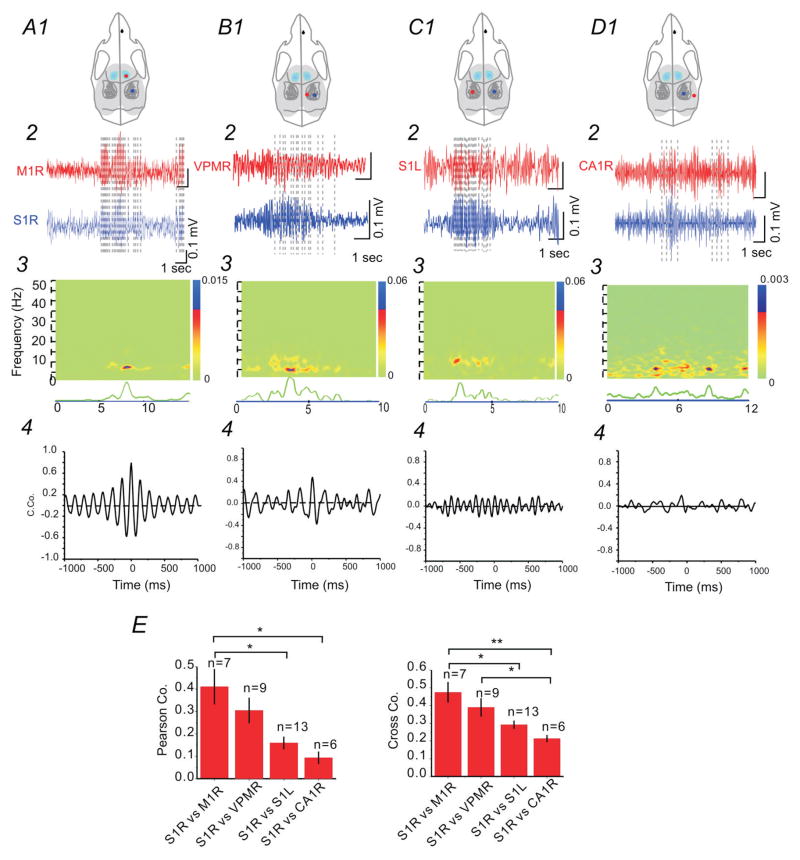
Figure 5. Cross-correlation analysis of ictal-spikes between different brain regions.
Comparison of IS activity from ipsilateral S1 and M1 regions indicated the highest degree of synchronization (A), compared with other regions (S1R vs. ipsilateral VPM, B; S1R vs. contralateral S1, C; and S1R vs. ipsilateral hippocampus, D). Top (1): drawings of skull showing the location of the recording electrodes in relationship to barrel field. 2: Comparison of EEG recordings from different brain regions. 3: Spectral coherence plot indicating the degree of signal coherence across both frequency and time. 4: Cross-correlation between the two selected EEG segments. (E) Group data showing two different cross-correlation analyses (Pearson vs. Cross-correlation) from simultaneous recordings (n=6–13 per group, *: p<0.05; **: p<0.01).

