Abstract
Metallic, especially gold, nanostructures exhibit plasmonic behavior in the visible to near-infrared light range. In this study, we investigate optical enhancement and absorption of gold nanobars with different thicknesses for transverse and longitudinal polarizations using finite element method simulations. This study also reports on the discrepancy in the resonance wavelengths and optical enhancement of the sharp-corner and round-corner nanobars of constant length 100 nm and width 60 nm. The result shows that resonance amplitude and wavelength have strong dependences on the thickness of the nanostructure as well as the sharpness of the corners, which is significant since actual fabricated structure often have rounded corners. Primary resonance mode blue-shifts and broadens as the thickess increases due to decoupling of charge dipoles at the surface for both polarizations. The broadening effect is characterized by measuring the full width at half maximum of the spectra. We also present the surface charge distribution showing dipole mode oscillations at resonance frequency and multimode resonance indicating different oscillation directions of the surface charge based on the polarization direction of the field. Results of this work give insight for precisely tuning nanobar structures for sensing and other enhanced optical applications.
Introduction
When light illuminates metal nanostructures, the free electron gas density oscillates collectively. This collective oscillation is known as a surface plasmon or simply a plasmon. Strong local-field enhancements, light absorption, and scattering all occur at a resonant incident wavelength, which can depend on the polarization of the light [1–3]. Due to their small volume, gold nanobars exhibit little radiation damping [1]; as a result, they show large local-field enhancement factors and large light scattering efficiency. Because of these characteristics, nanorods prove interesting for optical applications [1]. Nanorods can be used as nanoantennae and have been shown to be useful for many applications such as in enhancing light-emitter interactions [4,5], high-resolution microscopy and spectroscopy [6], optical sensors [7–10], plasmonics in THz range [11], solar cells [12–18], and photocurrent generation [19].
Others have both computational and experimentally investigated plasmonic properties of various metal nanostructures [20] including gold nanowires [21], nanobars [22], nanorods [23]-[24], nanorod arrays [25], nanodiscs [25,26], gold dimers [27], triangular silver prisms [28], nanocuboids [29], nanostar [30] and hybrid or heterostructures [31,32]. These works show that plasmonic properties depend on size, shape, material, and dielectric environment [30,33]. Previous studies have investigated length [34], aspect ratio [35], polarization of incident light [36], and nanostructure fabrication method [37]. Various methods have been used to evaluate the plasmonic properties, such as discrete dipole approximation [38], quasistatic approximation [39], etc. While much work investigates the plasmonic properties in nanorods that have a circular cross-section, here we investigate the plasmonic properties of Au nanobars that have a rectangular cross-section and carefully examine the effects of their thicknesses using a finite element method. Importantly, we explore the differences between sharp-corner nanobars and more realistic round-corner nanobars in terms of the resonance wavelength and optical enhancement as the thickness is varied.
Methods
Computational analyses were performed on gold nanobars of constant length and width with different thicknesses using COMSOL simulations. The simulations are performed in three-dimensional space, where the length of the nanobar is 100 nm, the width is 60 nm, and the thickness varies from 8 nm to 60 nm. The geometries are chosen to represent nanobar structures that can be fabricated with electron beam lithography on a silicon substrate with a silicon dioxide layer. The substrate effect was approximated by an effective medium neff = 1.25 around the nanobar [40–43]. For gold, the optical properties are obtained from Johnson and Christy [44]. A normally incident light was directed onto the surface of the nanobar with the electric field polarized along either the longitudinal or transverse direction as shown in the insets of Fig 1. For the simulation, two types of rectangular nanobars, sharp-corner and round-corner, were investigated. The round-corner bars have a 15 nm fillet on the vertical edges. Absorption of the nanobars was calculated using the heat loss in the volume of the nanobars. The optical enhancement, defined as the ratio of the local electric field E to the incident electric field E0 squared (E2/E02), was studied since light intensity is proportional to the electric field squared. Around the sample, an integration space of radius 125 nm has been defined for the near-field region where most of the enhancement occurs. This integration space was used to calculate the optical enhancement of the nanobar.
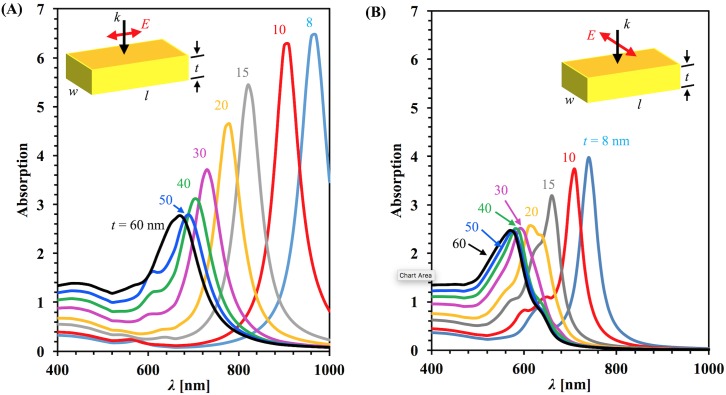
Fig 1. Calculated absorption spectrum.
For the sharp-corner rectangular gold nanobar with different thickness (A) For longitudinal polarization and (B) for transverse polarization. In both cases light is normally incident. Insets show to top view of the nanobar with polarization direction.
Results and discussion
The absorption spectra of the nanobars was calculated for each thickness variation and is plotted in Fig 1 for both longitudinal (A) and transverse (B) incident polarizations. Each line on the plot indicates the spectrum of a single nanobar with a particular thickness. The plot shows that the absorption peak shifts toward blue as the thickness increases for both polarizations. For a given thickness, the large peak in the spectrum corresponds to the dipolar resonant plasmonic mode, and the smaller peaks at the lower wavelenghts are due to higher order modes. This is illustrated and discussed more later with our charge distribution calculations. These results are consistent with previous results on nanobars [29].
For the transverse polarization, the observed trend is same but the amplitude is reduced compared to the longitudinal polarization. The resonance peak value comparing the two polarizations for the same geometrical parameters gives different position. For longitudinal polarization, the resonance wavelength value is larger than for the transverse polarization because plasmonic response depends on the geometric length along which the electric field is polarized [45]. The full-width at half maximum of the spectrum also increases with increasing thickness.
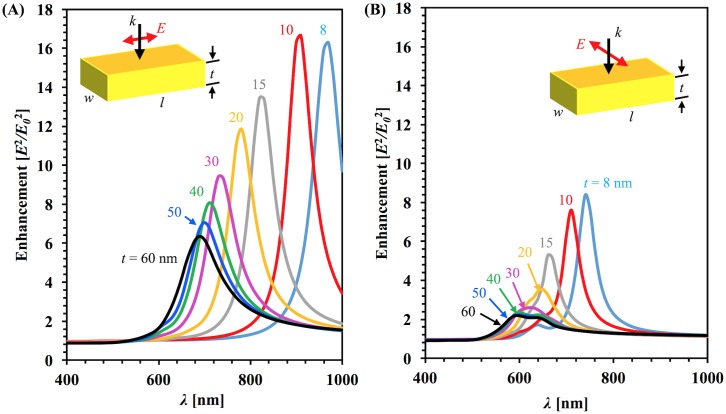
Fig 2 shows the optical enhancement spectra for nanobars of constant length and width with different thicknesses for both longitudinal (A) and transverse (B) polarizations. Again the enhancement peak shifts towards blue with increasing thicknesses. Many studies looking at the length of the nanobars have found that increasing the length of the nanobars shifts the resonance peaks towards the red [4,24]. This difference arises due to the direction of the k-vector. When the k-vector is perpendicular to the dimension of interest, such as length, then the previous results hold true. For a k-vector parallel to the dimension of interest, the peaks blue-shift as thickness increases. For the same gold thickness, the peak resonance wavelength and normalized amplitude exhibit significant differences due to the different polarizations for both absorption and enhancement. For polarization along the long axis, electrons oscillate in a larger space, taking a longer time to oscillate, causing a lower frequency, and as a result the peak resonance wavelength is longer than polarization along the short axis of the nanobars [46].
Fig 2. Calculated average enhancement spectrum.
Spectrum was calculated in the integrated volume of the sharp-corner rectangular gold nanobar for normal light incidence in the effective medium (neff = 1.25) with different thickness for (A) longitudinal polarization (B) transverse polarization.
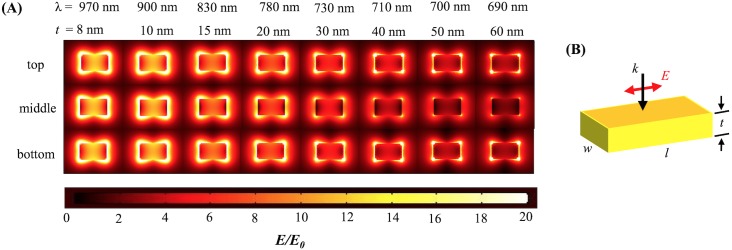
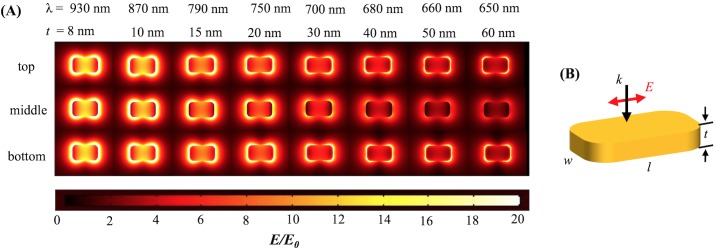
The electric field distribution (E/E0) is shown at the resonant wavelength for each thickness for the sharp-corner and round-corner rectangular gold nanobars in Figs 3(A) and 4(A) respectively. The maximum amplitude of the electric field distribution at the resonant wavelength decreases as the thickness increases. This is due to the top and bottom plasmons decoupling for large thicknesses.
Fig 3. Electromagnetic field distributions for sharp-corner nanobar.
(A) Field distribution for top, middle, and bottom surfaces at resonance wavelengths for sharp-corner Au nanobars of length 100 nm and width 60 nm for different thickness when polarization is aligned along the long axis and normal incidence. (B) Schematic of sharp-corner nanobar.
Fig 4. Electromagnetic field distributions for round-corner nanobar.
(A) Field distribution for top, middle and bottom surfaces at resonance wavelengths for round-corner Au nanobars of length 100 nm and width 60 nm for different thickness when polarization along the long axis and normal incidence. (B) Schematic of round-corner nanobar.
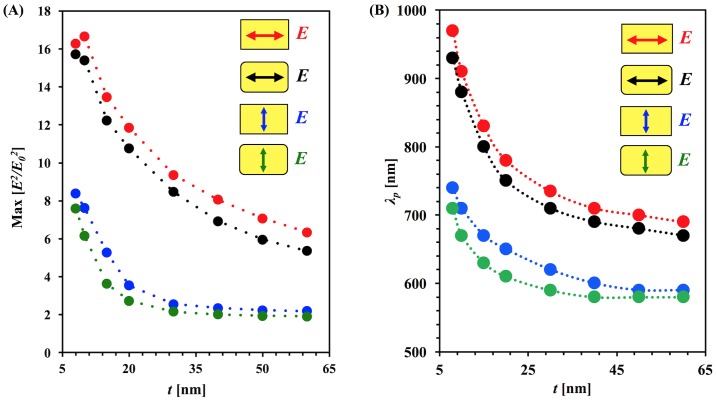
Fig 5(A) shows the maximum electric field enhancement of sharp-corner and round-corner structures under longitudinal and transverse polarizations of incident light as a function of thickness. Maximum enhancement decreases with increasing thickness. The sharp-corner structures have a maximum enhancement that is between 3–18% greater than round-corner structures for longitudinal polarization with and average of a 12% increase, and the enhancement increase ranges from 10–46% with an average of 21% for transverse polarization. In practice, nanobars fabricated with lithography will have rounded corners due to the finite radius of the electron beam. For the longitudinal polarization, the maximum enhancement decreases quickly and tends toward a stable value at higher thickness. For transverse polarization for both shapes, the maximum enhancement decreases quickly up to 20 nm thickness; after that, the change becomes significantly less and eventually the maximum enhancement reaches a constant value. For large thicknesses, the plasmon modes are dominated by the dipole mode of the surface charges; those are well distributed on the surface of the nanoparticle. In this case, the surface charges are not strongly confined, creating only a weak enhancement. In case of small thicknesses, the resonance includes higher modes along with the dipole mode. The dipole mode’s polarization source charges are well confined around the corners and edges of the nanobar, creating localized strong hot spots that generate strongly enhanced fields. The sharp corner nanobar accumulates more charges in the corners than round corner nanobars which makes a greater difference in the electric field enhancement. Additionally, increases in free electron density cause a blue shift of the surface plasmon resonance due to the enhanced restoring force [47].
Fig 5. Dependance of maximum enhancement and peak resonance wavelength on thickness.
(A) Normalized maximum enhancement [arb. unit] at resonant incident wavelength as a function of thickness for sharp-corner and round-corner nanobars for longitudinal and transverse polarization (B) Peak resonance wavelength as a function of thickness for both longitudinal and transverse polarization.
Fig 5(B) shows the peak resonance wavelength for the enhancement spectrum as a function of thickness. As the thickness increases, the peak resonance wavelength shifts toward blue for both polarizations for both sharp-corner and round-corner nanobars. Additionally, the resonant wavelength for the round-corner structures is blue-shifted by 10 to 40 nm relative to the sharp corners. The nanobars with round corners have a reduced effective dimension along the side with the round corners which contributes to the blue-shift. Another contribution is due to the charge distribution; in round-corner nanobars, charges spread more than sharp-corner nanobars, which leads to a blue shift [48]. This is an important factor to consider when designing and tuning nanobars for plasmonic applications.
Fig 6 demonstrates the surface charge distributions for three different thicknesses for longitudinal polarization. Using Gauss’s law (Eq 1) surface charge was calculated through the metal surface, S [49].
Fig 6. Surface charge distributions.
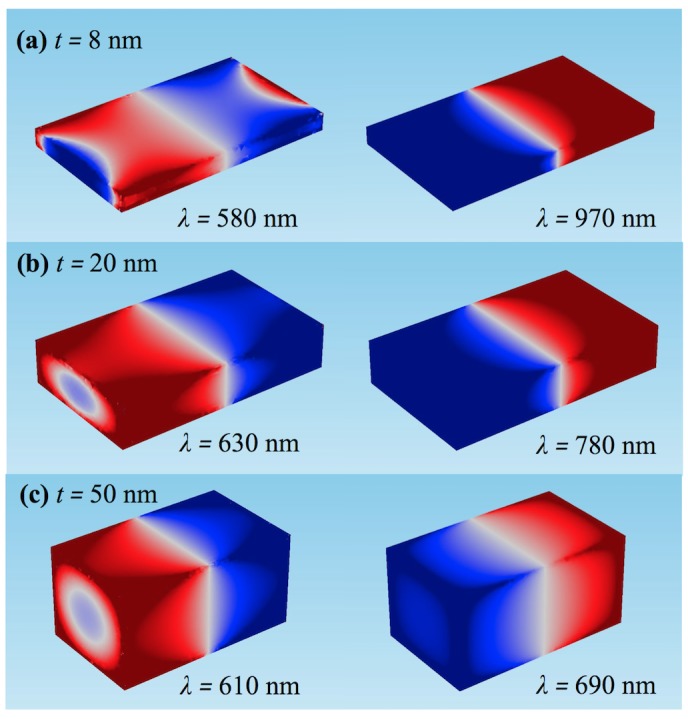
At peak resonance wavelength when the thickness is (a) 8 nm (b) 20 nm and (c) 50 nm.
| (1) |
Fig 6(A) shows the surface charge distribution for a nanobar with a thickness of 8 nm. At the resonance wavelength 580 nm the charge distribution forms a quadrupole while at 970 nm there is a dipole moment. Similar behavior was found for 20 nm and 50 nm thickness. These wavelengths reflect the two different peaks shown earlier in Fig 1. At the primary resonance wavelength, there is a dipolar distribution while at the shorter, lower intensity peak there is a quadrupolar distribution.
For small thickness, the dipole on the top surface and the dipole on the bottom surface are strongly coupled to each other and have a larger effective total charge. As the thickness increases, these dipoles begin to decouple and act more as separate dipoles. This causes a decrease in the total effective oscillating charge, thereby increasing the oscillation frequency, resulting in a blue shift. In addition, as the charges decouple, the higher order modes become more prominent. This change in relative intensities between modes, along with the primary resonant peak blue-shifting due to the higher orders, results in a broader spectral peak.
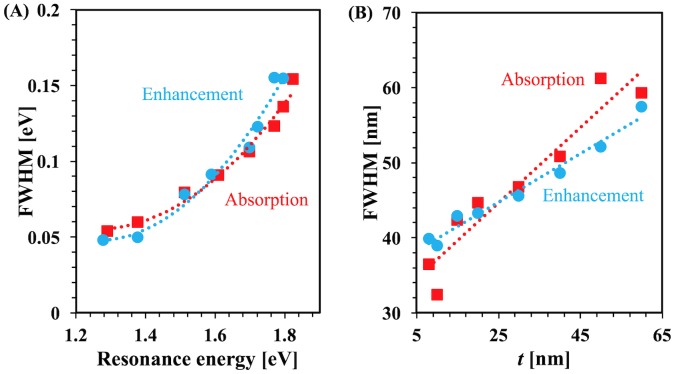
Fig 7(A) plots the full-width at half maximum (FWHM) as a function of resonance energy for each geometry. For absorption and enhancement, the figure shows nonlinear behavior with resonance energy. Fig 7(B) plots the FWHM of the broadening of the enhancement and absorption spectra as a function of thickness. For both cases, the plots show that FWHM generally increases with thickness; this is in part due to the superposition of the dipolar mode with higher order modes at lower wavelegnths.
Fig 7. Resonance energy and thickness dependend FWHM.
(A) Full width half maximum as a function of resonance energy (B) Full width half maximum as a function of thickness, where light incident normally.
The enhancement and absorption spectra broaden with the thickness of the structure. Fig 7(A) shows an interesting result; when the thickness is changed, FWHM increases with the nanobar thickness. It shows a similar trend to that in Y-H Qiu et al. [23] where plasmon width was plotted as a function of longitudinal surface plasmon resonance (L-SPR) energy as the gold nanobar length was changed. This broadening is because of interband excitation induced damping [23]. In plasmon relaxation dynamics, a three-level system was introduced by Y-H Qiu et al. According to this system, a fixed frequency is used to excite the electron from ground state to the second excited state. A two-step process is used by electrons to go to the ground state; first, the electrons transition from second excited state to the first excited state then from first excited state to the ground state. From the second excited state to the first excited state, the electron goes through a process called electron-phonon relaxation, and from the first excited state to the ground state, the electron transitions with decay rate due to the phonon-phonon relaxation process.
Conclusion
In this study, plasmonic properties of gold nanobars with various thicknesses were computationally analyzed. Sharp-corner and round-corner rectangular nanobars were studied; comparisons of the peaks the spectra reveal that the round-corner nanobars shows an average of 30 nm shift to lower wavelength for the same size for both incident polariztations. Resonance peak wavelengths shifted toward blue for both absorption and enhancement spectra with increasing thicknesses due to decoupling of the charge dipoles on the top and bottom surface. As the thickness increases, the FWHM of the spectrum also increases due to the impact of higher order modes which have been visualized in our surface charge density distrubution calculations. The results reported here are significant for plasmonic structures fabricated with elelectron beam lithography since we investigate key fabrication parameters including thickness of the nanobars and round corners, a property of nanostructures fabricated with method.
Supporting information
(XLSX)
(XLSX)
Data Availability
All relevant data are within the paper and its Supporting Information files.
Funding Statement
Support was provided by Arkansas Biosciences Institute, the major research component of the Arkansas Tobacco Settlement Proceeds Act of 2000 [http://arbiosciences.org]. The funders had no role in study design, data collection and analysis, decision to publish, or preparation of the manuscript.
References
- 1.Sönnichsen C, Franzl T, Wilk T, von Plessen G, Feldmann J, Wilson O, et al. Drastic Reduction of Plasmon Damping in Gold Nanorods. Phys Rev Lett. 2002. January 31;88(7):77402. [DOI] [PubMed] [Google Scholar]
- 2.Kreibig U, Vollmer M. Optical Properties of Metal Clusters. Springer Science & Business Media; 2013. 552 p. [Google Scholar]
- 3.Wissert MD, Moosmann C, Ilin KS, Siegel M, Lemmer U, Eisler H-J. Gold nanoantenna resonance diagnostics via transversal particle plasmon luminescence. Opt Express. 2011. February 14;19(4):3686 10.1364/OE.19.003686 [DOI] [PubMed] [Google Scholar]
- 4.Massa E, Maier SA, Giannini V. An analytical approach to light scattering from small cubic and rectangular cuboidal nanoantennas. New J Phys. 2013. June 10;15(6):63013. [Google Scholar]
- 5.Dai H, Li M, Li Y, Yu H, Bai F, Ren X. Effective light trapping enhancement by plasmonic Ag nanoparticles on silicon pyramid surface. Opt Express. 2012. July 2;20(S4):A502. [DOI] [PubMed] [Google Scholar]
- 6.Farahani JN, Pohl DW, Eisler H-J, Hecht B. Single Quantum Dot Coupled to a Scanning Optical Antenna: A Tunable Superemitter. Phys Rev Lett. 2005. June 28;95(1):17402. [DOI] [PubMed] [Google Scholar]
- 7.Schuck PJ, Fromm DP, Sundaramurthy A, Kino GS, Moerner WE. Improving the Mismatch between Light and Nanoscale Objects with Gold Bowtie Nanoantennas. Phys Rev Lett. 2005. January 13;94(1):17402. [DOI] [PubMed] [Google Scholar]
- 8.Mühlschlegel P, Eisler H-J, Martin OJF, Hecht B, Pohl DW. Resonant optical antennas. Science. 2005. June 10;308(5728):1607–9. 10.1126/science.1111886 [DOI] [PubMed] [Google Scholar]
- 9.Zhang S, Bao K, Halas NJ, Xu H, Nordlander P. Substrate-Induced Fano Resonances of a Plasmonic Nanocube: A Route to Increased-Sensitivity Localized Surface Plasmon Resonance Sensors Revealed. Nano Lett. 2011. April 13;11(4):1657–63. 10.1021/nl200135r [DOI] [PubMed] [Google Scholar]
- 10.Ozhikandathil J, Packirisamy M. Simulation and Implementation of a Morphology-Tuned Gold Nano-Islands Integrated Plasmonic Sensor. Sensors. 2014. June 13;14(6):10497–513. 10.3390/s140610497 [DOI] [PMC free article] [PubMed] [Google Scholar]
- 11.Giannini V, Berrier A, Maier SA, Sánchez-Gil JA, Rivas JG. Scattering efficiency and near field enhancement of active semiconductor plasmonic antennas at terahertz frequencies. Opt Express. 2010. February 1;18(3):2797–807. 10.1364/OE.18.002797 [DOI] [PubMed] [Google Scholar]
- 12.Macpherson HA, Stoldt CR. Iron pyrite nanocubes: size and shape considerations for photovoltaic application. ACS Nano. 2012. October 23;6(10):8940–9. 10.1021/nn3029502 [DOI] [PubMed] [Google Scholar]
- 13.Derkacs D, Lim SH, Matheu P, Mar W, Yu ET. Improved performance of amorphous silicon solar cells via scattering from surface plasmon polaritons in nearby metallic nanoparticles. Appl Phys Lett. 2006. August 28;89(9):93103. [Google Scholar]
- 14.Mokkapati S, Catchpole KR. Nanophotonic light trapping in solar cells. J Appl Phys. 2012. November 15;112(10):101101. [Google Scholar]
- 15.Li X, Hylton NP, Giannini V, Lee K-H, Ekins-Daukes NJ, Maier SA. Bridging electromagnetic and carrier transport calculations for three-dimensional modelling of plasmonic solar cells. Opt Express. 2011. July 4;19 Suppl 4:A888–896. [DOI] [PubMed] [Google Scholar]
- 16.Catchpole KR, Polman A. Plasmonic solar cells. Opt Express. 2008. December 22;16(26):21793 [DOI] [PubMed] [Google Scholar]
- 17.Ferry VE, Verschuuren MA, Li HBT, Verhagen E, Walters RJ, Schropp REI, et al. Light trapping in ultrathin plasmonic solar cells. Opt Express. 2010. June 21;18(S2):A237. [DOI] [PubMed] [Google Scholar]
- 18.Pillai S, Catchpole KR, Trupke T, Green MA. Surface plasmon enhanced silicon solar cells. J Appl Phys. 2007. May 1;101(9):93105. [Google Scholar]
- 19.Abbey GP, Nusir AI, Manasreh O, Herzog JB. Structural characteristics of Au-GaAs nanostructures for increased plasmonic optical enhancement. Proc SPIE. 2016. March 15; 9758 0N. [Google Scholar]
- 20.Ekinci Y, Solak HH, Löffler JF. Plasmon resonances of aluminum nanoparticles and nanorods. J Appl Phys. 2008. October 15;104(8):83107. [Google Scholar]
- 21.Giannini R, Hafner CV, Löffler JF. Scaling Behavior of Individual Nanoparticle Plasmon Resonances. J Phys Chem C. 2015. March 19;119(11):6138–47. [Google Scholar]
- 22.Wiley BJ, Chen Y, McLellan JM, Xiong Y, Li Z-Y, Ginger D, et al. Synthesis and Optical Properties of Silver Nanobars and Nanorice. Nano Lett. 2007. April 1;7(4):1032–6. 10.1021/nl070214f [DOI] [PubMed] [Google Scholar]
- 23.Qiu Y-H, Nan F, Zhang Y-F, Wang J-H, He G-Y, Zhou L, et al. Size-dependent plasmon relaxation dynamics and saturable absorption in gold nanorods. J Phys Appl Phys. 2016;49(18):185107. [Google Scholar]
- 24.Muskens OL, Giannini V, Sánchez-Gil JA, Gómez Rivas J. Optical scattering resonances of single and coupled dimer plasmonic nanoantennas. Opt Express. 2007;15(26):17736 [DOI] [PubMed] [Google Scholar]
- 25.Langhammer C, Kasemo B, Zorić I. Absorption and scattering of light by Pt, Pd, Ag, and Au nanodisks: Absolute cross sections and branching ratios. J Chem Phys. 2007;126(19):194702 10.1063/1.2734550 [DOI] [PubMed] [Google Scholar]
- 26.Jain PK, El-Sayed MA. Plasmonic coupling in noble metal nanostructures. Chem Phys Lett. 2010. March 5;487(4–6):153–64. [Google Scholar]
- 27.Wu J, Lu X, Zhu Q, Zhao J, Shen Q, Zhan L, et al. Angle-Resolved Plasmonic Properties of Single Gold Nanorod Dimers. Nano-Micro Lett. 2014. September 26;6(4):372–80. [DOI] [PMC free article] [PubMed] [Google Scholar]
- 28.Kelly KL, Coronado E, Zhao LL, Schatz GC. The Optical Properties of Metal Nanoparticles: The Influence of Size, Shape, and Dielectric Environment. J Phys Chem B. 2003. January 1;107(3):668–77. [Google Scholar]
- 29.Massa E, Maier SA, Giannini V. An analytical approach to light scattering from small cubic and rectangular cuboidal nanoantennas. New J Phys. 2013. June 10;15(6):63013. [Google Scholar]
- 30.Shiohara A, Langer J, Polavarapu L, Liz-Marzán LM. Solution processed polydimethylsiloxane/gold nanostar flexible substrates for plasmonic sensing. Nanoscale. 2014. July 24;6(16):9817–23. 10.1039/c4nr02648a [DOI] [PubMed] [Google Scholar]
- 31.Polavarapu L, Mourdikoudis S, Pastoriza-Santos I, Pérez-Juste J. Nanocrystal engineering of noble metals and metal chalcogenides: controlling the morphology, composition and crystallinity. CrystEngComm. 2015. May 12;17(20):3727–62. [Google Scholar]
- 32.Polavarapu L, Liz-Marzán LM. Growth and galvanic replacement of silver nanocubes in organic media. Nanoscale. 2013. May 3;5(10):4355–61. 10.1039/c3nr01244a [DOI] [PubMed] [Google Scholar]
- 33.Kelly KL, Coronado E, Zhao LL, Schatz GC. The Optical Properties of Metal Nanoparticles: The Influence of Size, Shape, and Dielectric Environment. J Phys Chem B. 2003. January 1;107(3):668–77. [Google Scholar]
- 34.Muskens OL, Giannini V, Sánchez-Gil JA, Gómez Rivas J. Optical scattering resonances of single and coupled dimer plasmonic nanoantennas. Opt Express. 2007;15(26):17736 [DOI] [PubMed] [Google Scholar]
- 35.Fernández-López C, Polavarapu L, Solís DM, Taboada JM, Obelleiro F, Contreras-Cáceres R, et al. Gold Nanorod—pNIPAM Hybrids with Reversible Plasmon Coupling: Synthesis, Modeling, and SERS Properties. ACS Appl Mater Interfaces. 2015. June 17;7(23):12530–8. 10.1021/am5087209 [DOI] [PubMed] [Google Scholar]
- 36.Huang Y, Kim D-H. Dark-field microscopy studies of polarization-dependent plasmonic resonance of single gold nanorods: rainbow nanoparticles. Nanoscale. 2011;3(8):3228 10.1039/c1nr10336a [DOI] [PubMed] [Google Scholar]
- 37.Shao L, Tao Y, Ruan Q, Wang J, Lin H-Q. Comparison of the plasmonic performances between lithographically fabricated and chemically grown gold nanorods. Phys Chem Chem Phys. 2015;17(16):10861–70. 10.1039/c5cp00715a [DOI] [PubMed] [Google Scholar]
- 38.Stefan Kooij E, Poelsema B. Shape and size effects in the optical properties of metallic nanorods. Phys Chem Chem Phys. 2006;8(28):3349 10.1039/b518389h [DOI] [PubMed] [Google Scholar]
- 39.Wang F, Shen YR. General Properties of Local Plasmons in Metal Nanostructures. Phys Rev Lett. 2006. November 17;97(20):206806 10.1103/PhysRevLett.97.206806 [DOI] [PubMed] [Google Scholar]
- 40.Saylor C, Novak E, Debu D, Herzog JB. Investigation of maximum optical enhancement in single gold nanowires and triple nanowire arrays. J Nanophotonics. 2015;9(1):093053–093053. [Google Scholar]
- 41.Herzog JB, Knight MW, Li Y, Evans KM, Halas NJ, Natelson D. Dark Plasmons in Hot Spot Generation and Polarization in Interelectrode Nanoscale Junctions. Nano Lett. 2013. March 13;13(3):1359–64. 10.1021/nl400363d [DOI] [PubMed] [Google Scholar]
- 42.Herzog JB, Knight MW, Natelson D. Thermoplasmonics: Quantifying Plasmonic Heating in Single Nanowires. Nano Lett. 2014. February 12;14(2):499–503. 10.1021/nl403510u [DOI] [PubMed] [Google Scholar]
- 43.Choy TC. Effective Medium Theory: Principles and Applications. Oxford University Press; 2015. 257 p. [Google Scholar]
- 44.Johnson PB, Christy RW. Optical Constants of the Noble Metals. Phys Rev B. 1972. December 15;6(12):4370–9. [Google Scholar]
- 45.Song M, Chen G, Liu Y, Wu E, wu B, Zeng H. Polarization properties of surface plasmon enhanced photoluminescence from a single Ag nanowire. Opt Express. 2012. September 24;20(20):22290 10.1364/OE.20.022290 [DOI] [PubMed] [Google Scholar]
- 46.Knight MW, Liu L, Wang Y, Brown L, Mukherjee S, King NS, et al. Aluminum Plasmonic Nanoantennas. Nano Lett. 2012. November 14;12(11):6000–4. 10.1021/nl303517v [DOI] [PubMed] [Google Scholar]
- 47.Chen H, Shao L, Li Q, Wang J. Gold nanorods and their plasmonic properties. Chem Soc Rev. 2013;42(7):2679–724. 10.1039/c2cs35367a [DOI] [PubMed] [Google Scholar]
- 48.Raziman TV, Martin OJF. Polarisation charges and scattering behaviour of realistically rounded plasmonic nanostructures. Opt Express. 2013. September 9;21(18):21500–7. 10.1364/OE.21.021500 [DOI] [PubMed] [Google Scholar]
- 49.Huang Y, Zhang X, Ringe E, Hou M, Ma L, Zhang Z. Tunable Lattice Coupling of Multipole Plasmon Modes and Near-Field Enhancement in Closely Spaced Gold Nanorod Arrays. Sci Rep. 2016. March 17;6:23159 10.1038/srep23159 [DOI] [PMC free article] [PubMed] [Google Scholar]
Associated Data
This section collects any data citations, data availability statements, or supplementary materials included in this article.
Supplementary Materials
(XLSX)
(XLSX)
Data Availability Statement
All relevant data are within the paper and its Supporting Information files.


