

Abstract
Cross-linking/mass spectrometry is an increasingly popular approach to obtain structural information on proteins and their complexes in solution. However, methods for error assessment are under current development. We note that false-discovery rates can be estimated at different points during data analysis, and are most relevant for residue or protein pairs. Missing this point led in our example analysis to an actual 8.4% error when 5% error was targeted. In addition, prefiltering of peptide-spectrum matches and of identified peptide pairs substantially improved results. In our example, this prefiltering increased the number of residue pairs (5% FDR) by 33% (n = 108 to n = 144). This number improvement did not come at the expense of reduced accuracy as the added data agreed with an available crystal structure. We provide an open-source tool, xiFDR (https://github.com/rappsilberlab/xiFDR), that implements our observations for routine application. Data are available via ProteomeXchange with identifier PXD004749.
Cross-linking/mass spectrometry (CLMS) is emerging as a valuable tool to investigate protein structures, protein complexes, and protein–protein interactions.1−4 As any method relying on measurement as well as interpretation, CLMS has some level of error. One popular method in proteomics to assess the expected error among reported results is the false discovery rate (FDR) by the target-decoy approach.5 A decoy database is generated, typically by inverting all target sequences. This decoy database should not contain any peptide sequences that are in the analyzed sample. Any match to this database is therefore a false positive. Under the assumption that random identifications fall with equal probability into the target and decoy section of the database, the distribution of decoy hits reveals the distribution of random target hits and allows the reporting of results with defined FDR.
For CLMS, the FDR estimation is complicated by the fact that every match is a composite of two peptides, each with its own probability to be false. Previously, FDR estimation of cross-links was addressed by either inverting all possible cross-linked peptide pairs,6 not modeling cases that have one correctly identified peptide and one incorrectly identified peptide or by using a decoy (i.e., wrong mass) cross-linker.6 While the decoy cross-linker permits for one peptide to be right and one to be wrong as well as both peptides being wrong, it does not provide an easy way to model both cases separately. To model this, FDR calculations have to take into account a set of two interdependent problems. While for the false identification of a single peptide, only a linear random space needs to be considered; for two peptides, this needs to be extended to a quadratic random space as each peptide could be from both the target as well as the decoy database. MS2-cleavable cross-linkers7−11 may allow circumvention of a cross-linking specific FDR, at least in part. The cross-link is cleaved in MS2, separating the two peptides that can then be identified individually in MS3. As linear peptides are being identified, standard proteomic peptide FDR estimation has been applied,12 possibly falling short in considering errors from joining up peptides. Nevertheless, their data can also be assessed jointly as cross-links within a spectrum.13,14 A formalism for FDR estimation of cross-links has recently been proposed.15 However, some questions remain open such as how to handle directionality of the cross-linker or what levels to consider: peptide-spectrum matches (PSMs), peptide pairs, or residue pairs.
Here we share our considerations regarding FDR estimation in CLMS, based on the target-decoy approach. The FDR approach was tested using a data set of RNA Polymerase II (Pol II) cross-linked with Bis[sulfosuccinimidyl] suberate (BS3).16 Our data was compared against an available crystal structure of Pol II,17 which served as a mass spectrometry-independent evaluation of our FDR approach. We highlight the importance of considering the different information levels, PSMs, peptide pairs, and residue pairs, and how their relationship can be exploited productively.
Experimental Section
Dataset
The data set has been described previously16 and was reprocessed here. In short, purified RNA polymerase II (Pol II) from Saccharomyces cerevisiae was cross-linked with BS3. Cross-linked complexes were then digested with trypsin and analyzed by LC-MS/MS. Mass spectrometric data was acquired using a “high–high” strategy, meaning both MS1 and MS2 spectra were acquired with high resolution (R = 100000 and R = 7500, respectively).
Data Processing
Mass spectrometric raw files were processed into peak lists using MaxQuant version 1.2.2.518 using default parameters except the setting for “Top MS/MS peaks per 100 Da” being set to 100. Peak lists were searched against a target-decoy database of all Pol II proteins (Rpb1 to Rpb12, 4565 residues) and their decoy equivalents obtained by sequence inversion18 using Xi19 (http://github.com/Rappsilber-Laboratory/XiSearch) for identification of cross-linked peptides. Search parameters were MS accuracy, 6 ppm; MS/MS accuracy, 20 ppm; enzyme, trypsin; specificity, fully tryptic; allowed number of missed cleavages, four; cross-linker, BS3; fixed modifications, carbamidomethylation on cysteine; variable modifications, oxidation on methionine, hydrolyzed, amidated, and loop-linked versions of BS3. The linkage specificity for BS3 was assumed to be at lysine, serine, threonine, tyrosine, and protein N-termini. The data have been deposited to the ProteomeXchange20 Consortium via the PRIDE21 partner repository with the data set identifier PXD004749.
Comparison to Crystal Structure
As a mass spectrometry-independent assessment of identification success, the residue distance of identified cross-linked residue pairs was measured in an available crystal structure of Pol II (PDB|1WCM).17 CLMS and X-ray crystallography do not necessarily return identical results as CLMS investigates proteins in solution where conformational flexibility is likely much higher than in crystallized form. However, for our data set, a good agreement of the two methods has been reported.16 To compare decoy matches with the crystal structure, the linked residue in the decoy was assigned the position of the same residue in the forward sequence.
xiFDR Software
All FDR calculations were done with xiFDR. We provide xiFDR, an open-source program (https://github.com/lutzfischer/xiFDR), for researchers to analyze the results of their preferred cross-link search engine. The input of xiFDR is either an mzIdentML file or a table of PSMs (Table S1). The output is either an amended mzIdentML file or a set of tables containing PSMs, peptide pairs, residue pairs, and protein pairs that pass the requested FDR thresholds. It supports two modes of operation for cross-links: directional and nondirectional. Directional here refers to matches where the spectra of A being cross-linked to B would be significantly different then B being cross-linked to A and nondirectional refers to cross-linking methods where there is practically no distinction between A cross-linked B and B cross-linked A. The formula for directional cross-links is
with TT being the number of target–target matches, DD being the number of decoy–decoy matches, and TD the number of target–decoy and decoy–target matches. For nondirectional cross-links the formula is
with TDDB being the number off all possible unique target–decoy and decoy–target entries.
The difference here is in how decoy–decoy model the false peptide–false peptide matches among the target–target matches. A detailed derivation of both formulas and their impact is described in the Supporting Information (text and Figure S1). Both formulas converge quickly (at 200 linkable entities the deviation is <1%, Supporting Information, Figure S2 and supplemental discussion). Both formulas are applicable at PSM, peptide pair, residue pair, and protein pair level. Even so, how directionality would look for residue and protein pairs is currently unclear.
The calculated FDRs are being reported with an attached resolution. The resolution here is being defined as the difference of the next higher computable FDR minus the next lower FDR. This is exemplified in Supporting Information, Figure S3. While not providing an actual accuracy it gives an indication of the range into which the actual FDR might fall. xiFDR is described in more detail as part of the Supporting Information.
Results and Discussion
Database searches of mass spectrometry data in proteomics return peptide-spectra matches (PSMs). Consequently, one may want to assess the error made in this process and FDR calculations for PSMs have been validated extensively for linear peptides based on a number of tests.22−24 However, for protein cross-linking, there are three additional information levels. PSMs aggregate to peptide pairs, these then aggregate to linked residue pairs, which in turn aggregate to protein pairs. To assess if FDR estimation at the different information levels is actually valid we used a crystal structure as “ground truth”. We compared our search results for data of a RNA polymerase II analysis16 filtered to 50% FDR at different levels (PSMs, peptide pairs, residue pairs) to the crystal structure of Pol II (PDB|1WCM),17 measuring the distance of residue pairs that were identified as being cross-linked. If the distance of a cross-linked residue pair is feasible the identification is possibly right. If not, it is likely wrong. When looking at the distance histogram of target and decoy matches, the distribution of target and decoy matches should be distinct for the cross-linkable distance with more targets then decoys (Figure 1a). This indicates that there are actually true identifications among the target matches. On the other hand, for long, structurally unfeasible, distances the curves should overlay. Most of the identifications of residue pairs that are long distance are structurally unfeasible and, hence, likely false positives, which decoys are supposed to model. Indeed, we found that the decoy distributions match the long-distance part of the target distribution for each observed level of information: PSMs (Figure 1b), peptide pairs (Figure 1c), and residue pairs (Figure 1d). Decoys (always false) and long-distance links (mostly false) agree for PSMs, peptide pairs, and residue pairs. Consequently, FDRs of PSMs, peptide pairs, and residue pairs can be obtained by target-decoy searches.
Figure 1.
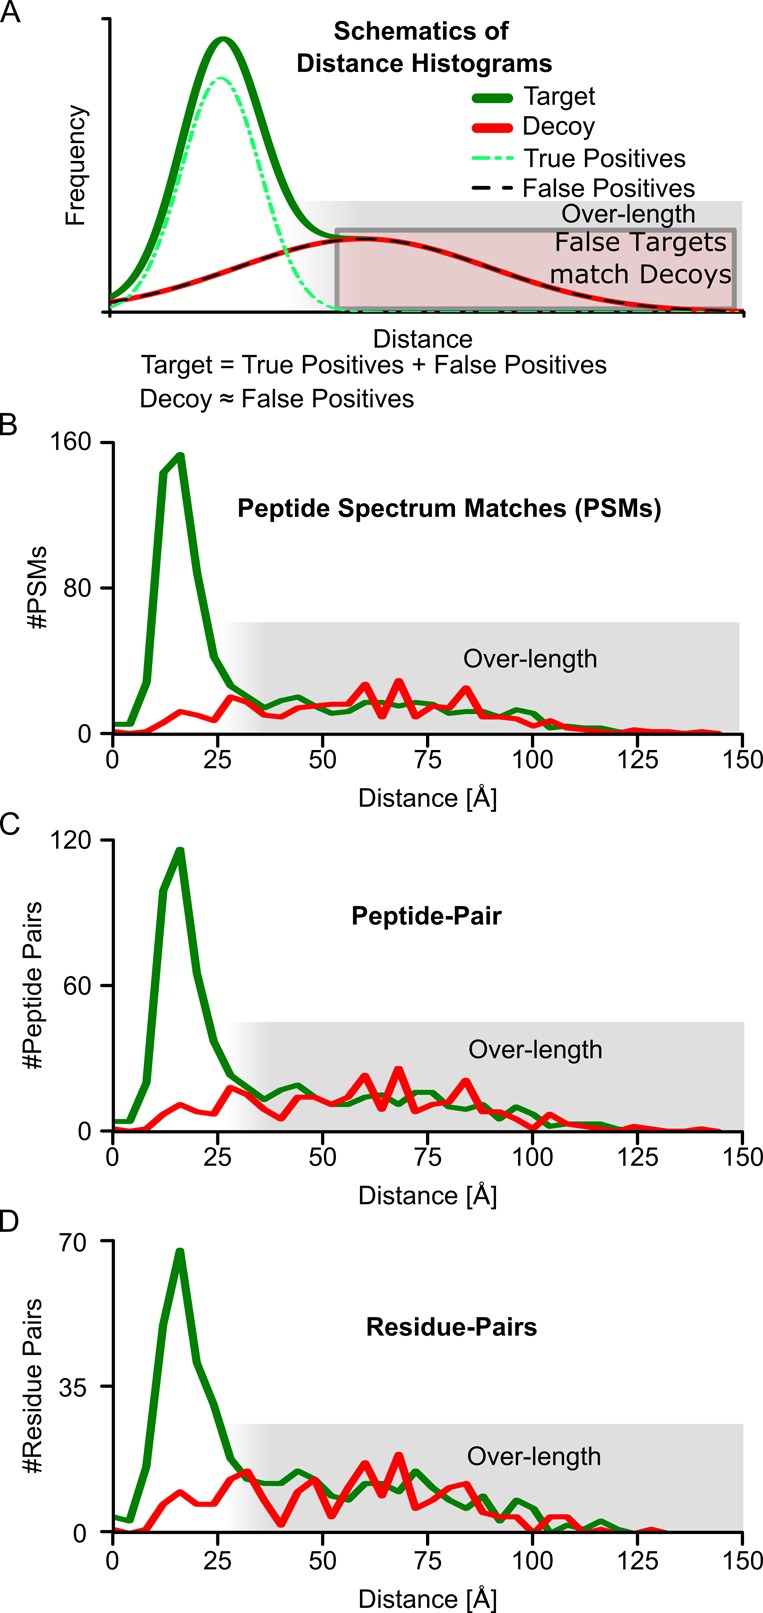
Validation of FDR on different levels by crystal structure. (A) Schematic distance-histograms showing the expected overlap of false positive and decoys and resulting overlap of overlength cross-links with decoy cross-links. (B) Residue-pair distance-histogram based on identified PSMs for a PSM FDR of 50%. (C) Residue-pair distance-histogram based on identified peptide pairs for a peptide-pair FDR cutoff of 50%, calculated at the level of peptide pairs. (D) Residue pair distance-histogram for a residue-pair FDR of 50%. All distances are Cα–Cα distances of the identified residue pairs in a crystal structure of Pol II (PDB|1WCM).
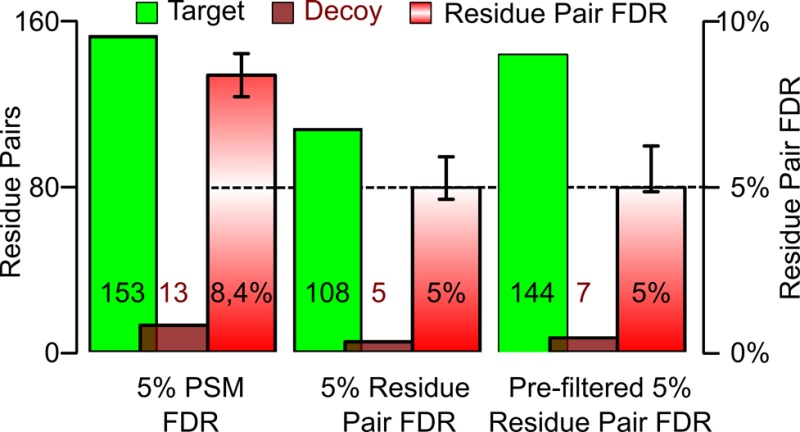
In a cross-linking experiment, the information of interest lies with the cross-linked residue pairs and the cross-linked protein pairs. Restricting FDR analysis to PSMs or peptide pairs leads to a problem: A defined FDR for PSMs or peptide pairs gives an unpredictable and typically larger FDR at the level of residue pairs or protein pairs (Figure 2). For our RNA polymerase II analysis 5% FDR at the level of PSMs leads to 5.8% FDR at the level of peptide pairs and 8.4% at the level of residue pairs. While we can also look at protein pairs, and the trend seems to persist, the actual number of possible pairs in Pol II does not permit for any statistically meaningful results. At no FDR is the PSM FDR a good guide for the accuracy of information at the level of residue pairs. Also peptide-pair FDR is not a good guide for the situation at residue-pair level. Consequently, the error should be estimated for the information that is of actual interest, that is, linked residue and protein pairs. Similar arguments have been made for protein identification:25 correct matches tend to aggregate when combining PSMs to peptides and peptides to proteins. In contrast, false matches tend to stay alone. False matches are random and have a low probability to fall by chance into the same protein. Therefore, the proportion of false results increases when combining results.
Figure 2.
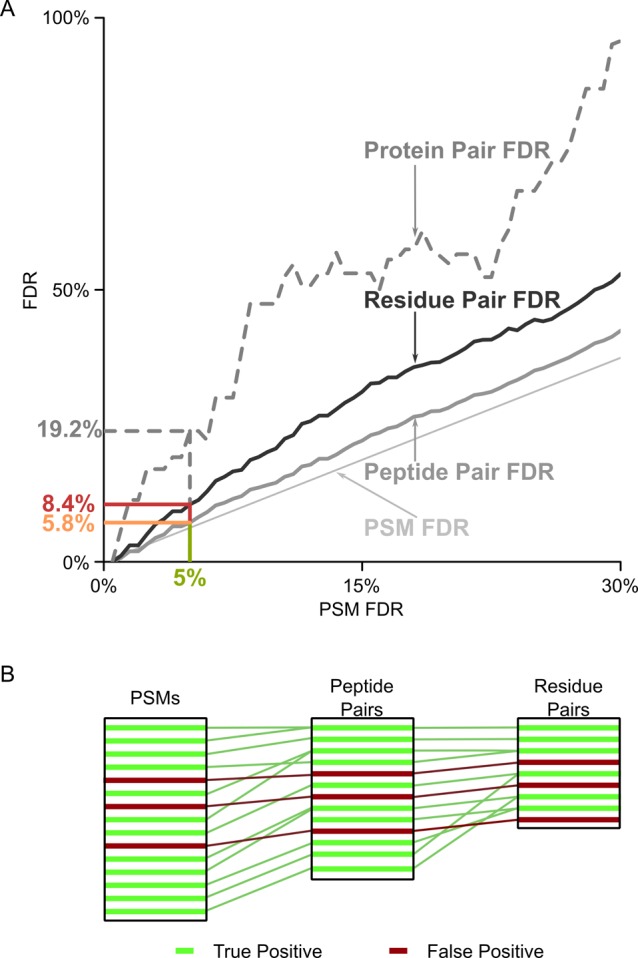
FDR propagation from PSMs to peptide pairs and residue pairs. (A) Actual peptide-pair FDR (solid gray) and residue-pair FDR (solid black) in dependence of PSM FDR (dashed gray line) for a cross-link data set of RNA Pol II.16 The protein-pair FDR is plotted as a trend only, due to data sparseness. (B) Exemplification of the error propagation, in form of wrong identifications, from PSMs to peptide pairs and residue pairs. Correctly identified PSMs (true positives = green) tend to cluster, for example, several correctly identified PSMs support the same unique peptide pair and correctly identified peptide pairs in turn support one residue pair. Incorrectly identified PSMs (false positives = red) are random and do not cluster to the same extend.
Given that residue-pair FDRs should and can be calculated leaves the question of how to treat PSMs and peptide pairs. One could ignore their error and leave error estimation to the level of residue pairs entirely. Instead, we restrict the number of false PSMs and peptide pairs by applying a FDR threshold at their respective level as a prefilter. Importantly, the way one handles PSMs and peptide pairs actually influences the number of residue pairs passing a given FDR threshold. For example, aiming for 5% FDR on residue pairs in our data we observe 108 hits if only applying the cutoff at residue level, compared to 144 hits if we apply 6% FDR cutoff at PSM level, and a 10.5% FDR cutoff at peptide-pair level (Figure 3). Prefiltering in PSMs and peptide pairs added 36 (33%) additional residue pairs without affecting their FDR. To test if our FDR is still reflecting the likely accuracy of cross-links reported in our analysis, we compared the initial as well as the number-improved set of cross-links with an available crystal structure of Pol II (PDB|1WCM). Of the additional 36 residue pairs, 33 showed a distance in the crystal structure that matched the possible cross-link length (∼27 Å for lysine–lysine links with BS316). In addition, two of the three remaining residue pairs involve the very flexible N-terminal loop-region of Rbp1, offering an explanation for seeing these cross-links despite residues being distant in the crystal structure. In conclusion, prefiltering added 35 plausible residue pairs (33%) at the expense of adding one implausible one. Prefiltering therefore appears to be a valid way of improving search sensitivity without compromising search accuracy.
Figure 3.
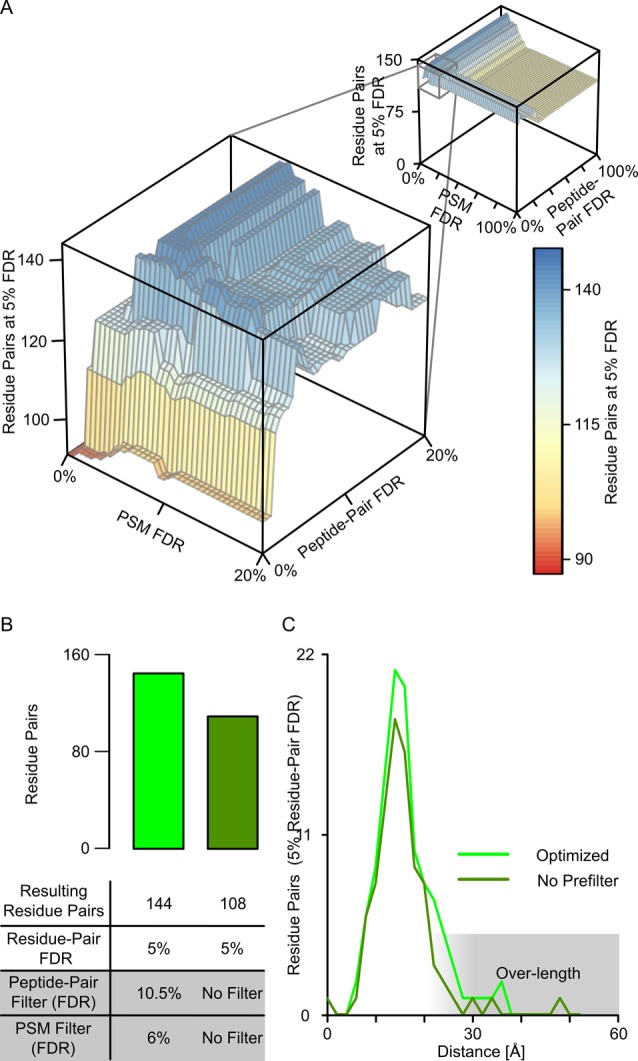
Increased search sensitivity by prefiltering. (A) The number of identified residue pairs (at 5% FDR, z-axis) depends on the FDR-threshold applied to PSMs (x-axis) and peptide pairs (y-axis). (B) Optimal FDR thresholds on PSMs and peptide pairs (left) return more cross-links (at 5% FDR) than not applying prefilters (right). (C) Distance distribution of the residue pairs (5% residue-pair FDR). The prefiltering does increase the number of cross-links but does not lead to a notable increase in long distance links (see text for a more detailed discussion).
The success of prefiltering by applying FDR thresholds at lower levels in improving search sensitivity depends on combining multiple PSMs to support a peptide pair and multiple peptide pairs to support a residue pair. We are not aware of a way to predict best filter settings, or in fact if different filter settings at lower information levels would always be beneficial. We, therefore, suggest exploring this numerically by software. We supply such a software here, xiFDR (see Experimental Section). Note that this tool uses a CSV file or mzIdentML26 version 1.2 (submitted) as input and is therefore independent of the search software. XiFDR reports the FDR interval (Supporting Information, Figure S3).
Conclusion
Current FDR approaches in cross-linking/mass spectrometry stop at the PSM or peptide-pair level, often missing to specify which one was actually used. Consequently, the information of interest, links between sites (residue pairs) or proteins (protein pairs), is reported with an unknown and typically higher (potentially much higher) error. Our data indicate that our FDR approach can be extended to assess the error on residue-pair level and presumably also protein-pair level. As contributions to finding the most sensitive but also fair report of identified links we propose to prefilter on PSMs and peptide pairs, and to report FDR together with the interval of uncertainty resulting from limited data. FDR estimation played an important role in consolidating proteomics and it has a similar role to play for cross-linking/mass spectrometry.
Acknowledgments
The Wellcome Trust generously funded this work through a Senior Research Fellowship to J.R. (103139), a Centre Core Grant (092076), and an Instrument Grant (108504).
Supporting Information Available
The Supporting Information is available free of charge on the ACS Publications website at DOI: 10.1021/acs.analchem.6b03745.
Derivation of formulas for directional and nondirectional cross-linker and the impact of using one vs the other. Description of xiFDR software. Description and example for the resolution of an FDR calculation (PDF).
Author Contributions
Both authors designed research, analyzed data, and wrote the paper together. L.F. wrote the software.
The authors declare no competing financial interest.
Supplementary Material
References
- Sinz A. Mass Spectrom. Rev. 2006, 25, 663–682. 10.1002/mas.20082. [DOI] [PubMed] [Google Scholar]
- Gingras A. C.; Gstaiger M.; Raught B.; Aebersold R. Nat. Rev. Mol. Cell Biol. 2007, 8, 645–654. 10.1038/nrm2208. [DOI] [PubMed] [Google Scholar]
- Petrotchenko E. V.; Borchers C. H. Mass Spectrom. Rev. 2010, 29, 862–876. 10.1002/mas.20293. [DOI] [PubMed] [Google Scholar]
- Rappsilber J. J. Struct. Biol. 2011, 173, 530–540. 10.1016/j.jsb.2010.10.014. [DOI] [PMC free article] [PubMed] [Google Scholar]
- Moore R. E.; Young M. K.; Lee T. D. J. Am. Soc. Mass Spectrom. 2002, 13, 378–386. 10.1016/S1044-0305(02)00352-5. [DOI] [PubMed] [Google Scholar]
- Maiolica A.; Cittaro D.; Borsotti D.; Sennels L.; Ciferri C.; Tarricone C.; Musacchio A.; Rappsilber J. Mol. Cell. Proteomics 2007, 6, 2200–2211. 10.1074/mcp.M700274-MCP200. [DOI] [PubMed] [Google Scholar]
- Tang X.; Munske G. R.; Siems W. F.; Bruce J. E. Anal. Chem. 2005, 77, 311–318. 10.1021/ac0488762. [DOI] [PubMed] [Google Scholar]
- Soderblom E. J.; Goshe M. B. Anal. Chem. 2006, 78, 8059–8068. 10.1021/ac0613840. [DOI] [PubMed] [Google Scholar]
- Kao A.; Chiu C. L.; Vellucci D.; Yang Y.; Patel V. R.; Guan S.; Randall A.; Baldi P.; Rychnovsky S. D.; Huang L. Mol. Cell. Proteomics 2011, 10, M110 002212. 10.1074/mcp.M110.002212. [DOI] [PMC free article] [PubMed] [Google Scholar]
- Liu F.; Wu C.; Sweedler J. V.; Goshe M. B. Proteomics 2012, 12, 401–405. 10.1002/pmic.201100352. [DOI] [PMC free article] [PubMed] [Google Scholar]
- Luo J.; Fishburn J.; Hahn S.; Ranish J. Mol. Cell. Proteomics 2012, 11, M111 008318. 10.1074/mcp.M111.008318. [DOI] [PMC free article] [PubMed] [Google Scholar]
- Chavez J. D.; Schweppe D. K.; Eng J. K.; Zheng C.; Taipale A.; Zhang Y.; Takara K.; Bruce J. E. Nat. Commun. 2015, 6, 7928. 10.1038/ncomms8928. [DOI] [PMC free article] [PubMed] [Google Scholar]
- Gotze M.; Pettelkau J.; Fritzsche R.; Ihling C. H.; Schafer M.; Sinz A. J. Am. Soc. Mass Spectrom. 2015, 26, 83–97. 10.1007/s13361-014-1001-1. [DOI] [PubMed] [Google Scholar]
- Liu F.; Rijkers D. T.; Post H.; Heck A. J. Nat. Methods 2015, 12, 1179–1184. 10.1038/nmeth.3603. [DOI] [PubMed] [Google Scholar]
- Walzthoeni T.; Claassen M.; Leitner A.; Herzog F.; Bohn S.; Forster F.; Beck M.; Aebersold R. Nat. Methods 2012, 9, 901–903. 10.1038/nmeth.2103. [DOI] [PubMed] [Google Scholar]
- Chen Z. A.; Jawhari A.; Fischer L.; Buchen C.; Tahir S.; Kamenski T.; Rasmussen M.; Lariviere L.; Bukowski-Wills J. C.; Nilges M.; Cramer P.; Rappsilber J. EMBO J. 2010, 29, 717–726. 10.1038/emboj.2009.401. [DOI] [PMC free article] [PubMed] [Google Scholar]
- Armache K. J.; Mitterweger S.; Meinhart A.; Cramer P. J. Biol. Chem. 2005, 280, 7131–7134. 10.1074/jbc.M413038200. [DOI] [PubMed] [Google Scholar]
- Cox J.; Mann M. Nat. Biotechnol. 2008, 26, 1367–1372. 10.1038/nbt.1511. [DOI] [PubMed] [Google Scholar]
- Giese S. H.; Fischer L.; Rappsilber J. Mol. Cell. Proteomics 2016, 15, 1094–1104. 10.1074/mcp.M115.049296. [DOI] [PMC free article] [PubMed] [Google Scholar]
- Vizcaino J. A.; Deutsch E. W.; Wang R.; Csordas A.; Reisinger F.; Rios D.; Dianes J. A.; Sun Z.; Farrah T.; Bandeira N.; Binz P. A.; Xenarios I.; Eisenacher M.; Mayer G.; Gatto L.; Campos A.; Chalkley R. J.; Kraus H. J.; Albar J. P.; Martinez-Bartolome S.; Apweiler R.; Omenn G. S.; Martens L.; Jones A. R.; Hermjakob H. Nat. Biotechnol. 2014, 32, 223–226. 10.1038/nbt.2839. [DOI] [PMC free article] [PubMed] [Google Scholar]
- Vizcaino J. A.; Csordas A.; del-Toro N.; Dianes J. A.; Griss J.; Lavidas I.; Mayer G.; Perez-Riverol Y.; Reisinger F.; Ternent T.; Xu Q. W.; Wang R.; Hermjakob H. Nucleic Acids Res. 2016, 44, D447–456. 10.1093/nar/gkv1145. [DOI] [PMC free article] [PubMed] [Google Scholar]
- Elias J. E.; Gygi S. P. Nat. Methods 2007, 4, 207–214. 10.1038/nmeth1019. [DOI] [PubMed] [Google Scholar]
- Sennels L.; Bukowski-Wills J. C.; Rappsilber J. BMC Bioinf. 2009, 10, 179. 10.1186/1471-2105-10-179. [DOI] [PMC free article] [PubMed] [Google Scholar]
- Elias J. E.; Gygi S. P. Methods Mol. Biol. 2010, 604, 55–71. 10.1007/978-1-60761-444-9_5. [DOI] [PMC free article] [PubMed] [Google Scholar]
- Reiter L.; Claassen M.; Schrimpf S. P.; Jovanovic M.; Schmidt A.; Buhmann J. M.; Hengartner M. O.; Aebersold R. Mol. Cell. Proteomics 2009, 8, 2405–2417. 10.1074/mcp.M900317-MCP200. [DOI] [PMC free article] [PubMed] [Google Scholar]
- Jones A. R.; Eisenacher M.; Mayer G.; Kohlbacher O.; Siepen J.; Hubbard S. J.; Selley J. N.; Searle B. C.; Shofstahl J.; Seymour S. L.; Julian R.; Binz P. A.; Deutsch E. W.; Hermjakob H.; Reisinger F.; Griss J.; Vizcaino J. A.; Chambers M.; Pizarro A.; Creasy D. Mol. Cell. Proteomics 2012, 11, M111 014381. 10.1074/mcp.M111.014381. [DOI] [PMC free article] [PubMed] [Google Scholar]
Associated Data
This section collects any data citations, data availability statements, or supplementary materials included in this article.