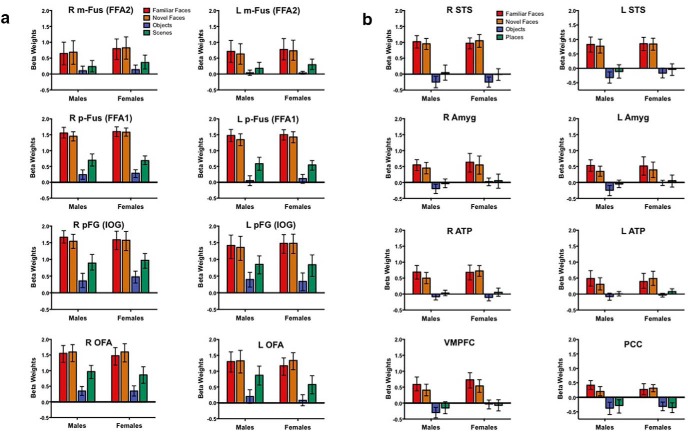
Figure 4.
A, B, Comparing face-related activation as defined by magnitude throughout the face-processing network in individually defined face-selective ROIs. The ROIs in the core and extended (A, B) face-processing network were defined using the visual stimulation task and were thresholded for each individual participant using the FDR procedure (q < 0.001). Each graph represents the mean parameter estimates (e.g., β weight) from the ROI-based GLM with 95% confidence intervals for male and female participants. There were no sex differences in the magnitude of the response to faces in any ROI.

