
Figure 3. PDE2A2 controls cAMP at the outer mitochondrial membrane.
(A) FRET analysis in NRVM expressing the cytosolic EPAC-based H90 sensor (left) and treated with the PDE2 selective inhibitor Bay 60–7550 (BAY60, 1 µM) or the PDE3 selective inhibitor cilostamide (Cilo), 10 µM). 25 µM Forskolin and 100 µM IBMX (F/I) was applied at the end of the experiment to achieve saturation of the sensor. Representative kinetics of FRET change are shown in the middle panel and summary of all experiments is shown in the panel on the right. n = 15 cells from three biological replicates. Scale bar: 10 µm. (B) FRET analysis in NRVM expressing an outer mitochondrial membrane-targeted version (OMM) of H90 and relative representative traces and summary of all the experiments. Cell treatment was as in A). n = 15 cells from three biological replicates. Scale bar: 10 µm. (C) FRET analysis in NRVM expressing a version of H90 targeted to the matrix and challenged with PDE selective inhibitors as in A, followed by application of the membrane permeable cAMP analogue 8CPT (200 µM). Representative kinetics and summary of experiments is shown in the middle and right panel, respectively. n = 12 cells from three biological replicates. Scale bar: 10 µm. (D) FRET analysis in Wild type (MEFwt) and PDE2KO (MEFPDE2KO) MEFs expressing the cytosolic EPAC-based H90 sensor (left) and treated with the non-selective PDEs inhibitor IBMX (100 µM) or the PDE2 selective inhibitor Bay 60–7550 (BAY60 100 nM). 25 µM Forskolin and 100 µM IBMX (F/I) was applied at the end of the experiment to achieve saturation of the sensor. Representative kinetics of FRET change are shown in the middle panel and summary of all experiments is shown in the panel on the right. n = 10 cells from three biological replicates. Scale bar: 10 µm. (E) FRET analysis in Wild type (MEFwt) and PDE2KO (MEFPDE2KO) expressing the outer mitochondrial membrane-targeted version (OMM) of H90 (left) and treated with the non-selective PDEs inhibitor IBMX (100 µM) or the PDE2 selective inhibitor Bay 60–7550 (BAY60 100 nM). Representative kinetics and summary of experiments is shown in the middle and right panel, respectively. n = 10 cells from three biological replicates. Scale bar: 10 µm. (F) FRET analysis in Wild type (MEFwt) and PDE2KO (MEFPDE2KO) expressing the mitochondrial matrix-targeted version of H90 (left) and treated with the PDE2 selective inhibitor Bay 60–7550 (BAY60 100 nM). Representative kinetics and summary of experiments is shown in the middle and right panel, respectively. n = 6 cells from two biological replicates. Scale bar: 10 µm. ANOVA test with Bonferroni correction was used for statistical analysis. *0.01≤p≤0.05, **0.001≤p<0.01, ***p<0.001.

Figure 3—figure supplement 1. Localisation of cytosolic and targeted H90.
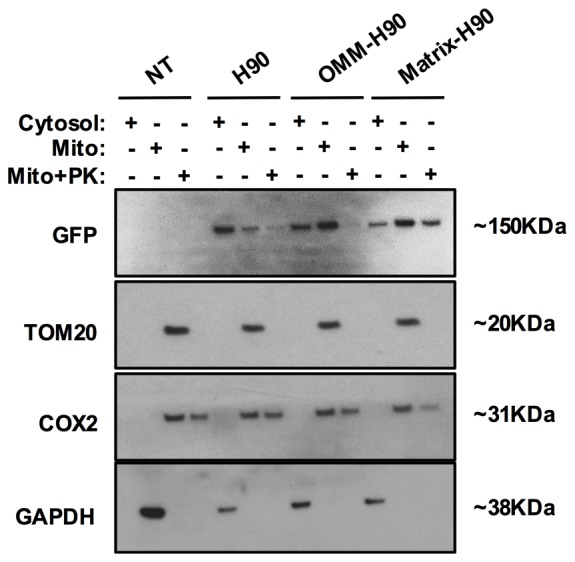
Figure 3—figure supplement 2. Effect of PDE2A inhibition on cAMP levels in the matrix.
