. 2017 May 9;6:e15651. doi: 10.7554/eLife.15651

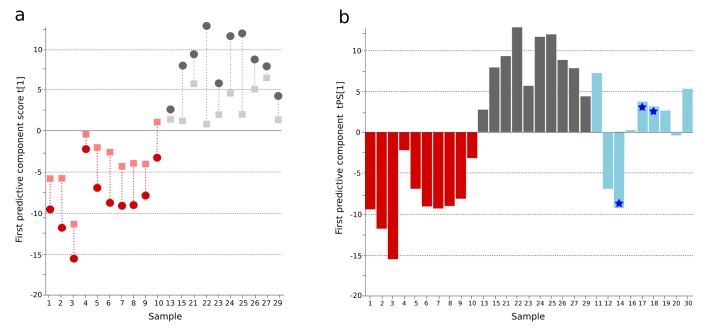
Figure 1. OPLS-DA model of plasma metabolites from a Bangladeshi cohort of patients with culture-positive typhoid and fever controls, with prediction of suspected typhoid.

(A) OPLS-DA model generated from GCxGC-TOFMS data from the plasma of 10 patients with culture-positive typhoid and 10 fever controls using 236 metabolites. Regular (circles) and cross-validated (squares) scores for the first predictive component (t[1] and tcv[1], respectively, linked by broken line) showing a separation between culture-positive typhoid (red) and fever control samples (grey) (p=0.006). (B) Column plot of the predicted scores for the first predictive component (tPS[1]) where clinically suspected typhoid samples (n = 9) (blue columns) have been predicted into the model distinguishing between culture-positive typhoid (red) and fever control samples (grey). Plot shows five samples were more similar to the culture-positive typhoid samples and three more similar to the controls; one sample remained marginal. The blue stars identify PCR-amplification-positive samples.

DOI: http://dx.doi.org/10.7554/eLife.15651.002

Figure 1.

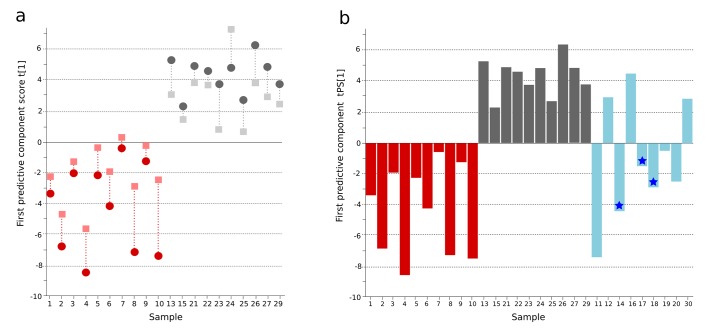
Figure 1—figure supplement 1. OPLS-DA model of urine metabolites from a Bangladeshi cohort including patients with culture-positive typhoid and fever controls, with prediction of suspected typhoid.

Figure 1—figure supplement 1.

(A) OPLS-DA model generated from UHPLC-Q-TOFMS data from the urine of 10 patients with culture-positive typhoid and 10 fever controls using 941 metabolites (positive ionization mode). Regular (circles) and cross-validated (squares) scores for the first predictive component (t[1] and tcv[1], respectively, linked by broken line) showing a separation between culture-positive typhoid (red) and fever control samples (grey) (p=0.025). (B) Column plot of the predicted scores for the first predictive component (tPS[1]) where culture-negative/suspected typhoid typhoid samples (n = 9) (blue columns) have been predicted into the model distinguishing between culture-positive typhoid (red) and fever control samples (grey); PCR-amplification-positive samples are identified by the blue stars.