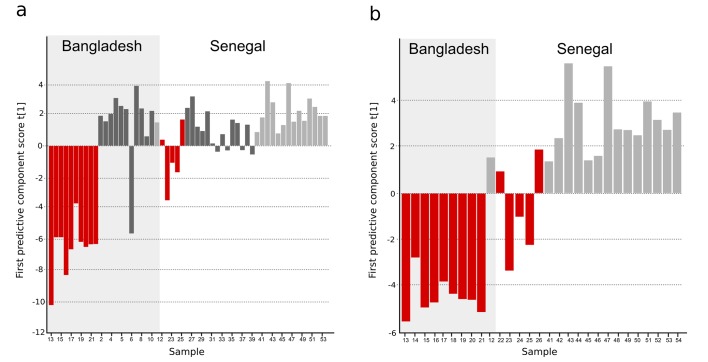
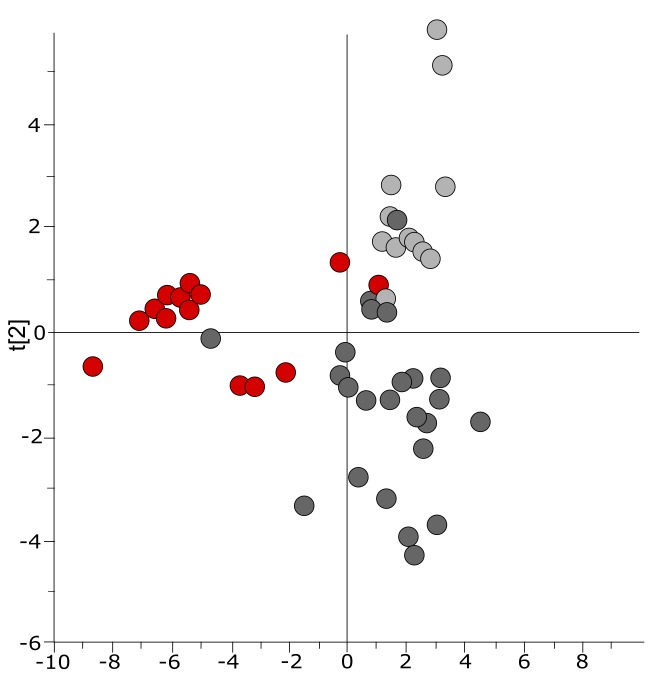
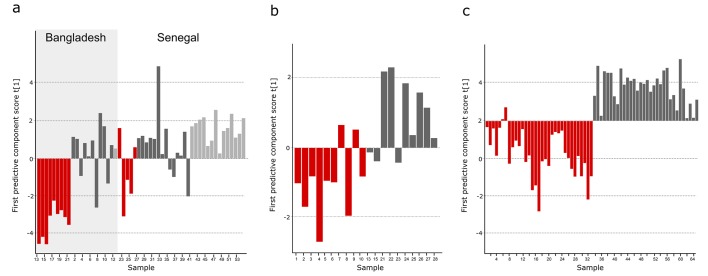
Figure 3. OPLS-DA models of plasma metabolites from Bangladeshi/Senegalese validation cohorts of patients with typhoid, malaria and other infections.
OPLS-DA models generated from GC-TOFMS using 104 metabolites. (A) Column plot of the first predictive component scores, t[1] showing a separation of typhoid infection samples (red; n = 14) from the two control groups; malaria (light grey; n = 15) and infections caused by other bacteria/pathogens (grey; n = 25) (p<0.0001). For the Bangladeshi samples, there is a clear separation except for one control sample behaving as a typhoid sample, there is more overlap for the Senegalese samples. (B) Column plot of the first predictive component scores, t[1] showing a separation of typhoid infection samples (red; n = 14) from malaria samples (light grey; n = 15) (p<0.001). There is a clear separation for the Bangladeshi samples and for the Senegalese samples except two typhoid samples behaving as malaria.


