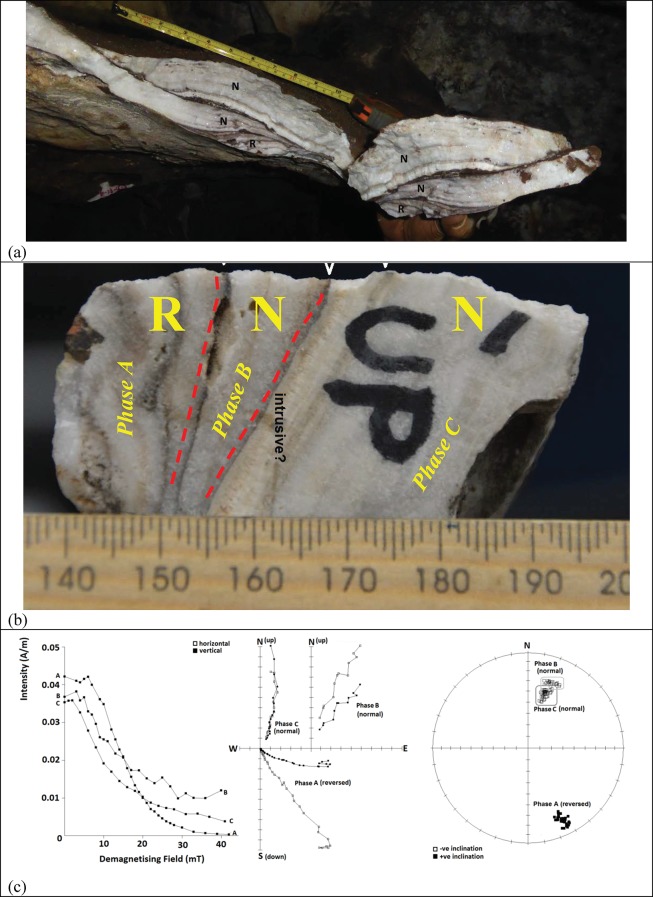
Figure 13. Samples and results of palaeomagnetic analyses forFlowstone 1a.
(a) Outcrop photo of hanging erosion remnant of Flowstone 1a from which the palaeomagnetic sample was taken. The three flowstone phases separated by detrital horizons are clearly visible, and their magnetic polarity has been marked (N = normal; R = reverse). The stratigraphic top is towards the top of the photo; (b) close-up of a hand sample taken for palaeomagnetic analysis from Flowstone 1a in the Dinaledi Chamber. The sample is layered and comprises three distinct phases (from base to top: A-C marked in yellow) separated by thin clastic horizons that mark disconformities indicated with red dashed lines. The larger-scale extent of the three phases can be seen in (a); (c) intensity spectra, Zijderveld plots, and stereo plots for samples from phases A to C taken from (b). Phases B and C show normal polarity and phase A shows reversed and intermediate polarity directions.

