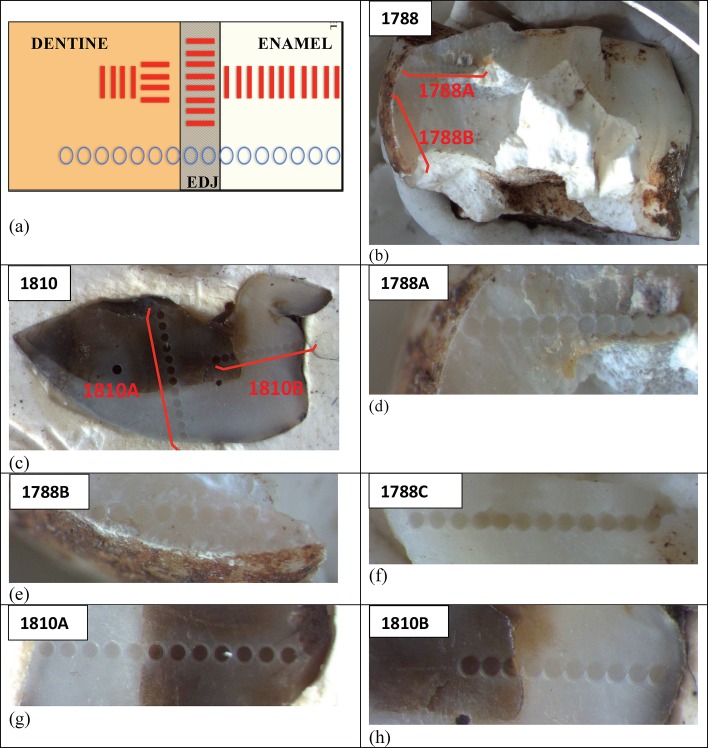
Figure 9. Photographs illustrating the sampling approaches taken by SCU-UoW and GU-ANU in obtaining the U-Th results presented in Tables 4 and 5.
(a) Comparison of sampling grids across the enamel-dentine boundary measured by SCU-UoW (red lines) vs. GU-ANU (blue circles). SCU-UoW (red lines) measured a series of parallel, shallow (<5 μm) pits along grid lines across the teeth and averaged U concentrations across each grid. GU-ANU (blue circles) measured the average composition of the tooth in single spots that were laser-bored along profiles across the teeth, and report results for each spot. (b, c) Locations of LA-ICP-MS spot analyses for teeth samples 1788 (b) and 1810 (c) conducted by GU-ANU. The detailed transects are shown in panels (d) to (h).

