Abstract
Background
Based on a fully coupled computational model of esophageal transport, we analyzed how varied esophageal muscle fiber architecture and/or dual contraction waves affect bolus transport. Specifically, we studied the luminal pressure profile in those cases to better understand possible origins of the peristaltic transition zone.
Methods
Two groups of studies were conducted using a computational model. The first studied esophageal transport with circumferential-longitudinal fiber architecture, helical fiber architecture and various combinations of the two. In the second group, cases with dual contraction waves and varied muscle fiber architecture were simulated. Overall transport characteristics were examined and the space-time profiles of luminal pressure were plotted and compared.
Key Results
Helical muscle fiber architecture featured reduced circumferential wall stress, greater esophageal distensibility, and greater axial shortening. Non-uniform fiber architecture featured a peristaltic pressure trough between two high pressure segments. The distal pressure segment showed greater amplitude than the proximal segment, consistent with experimental data. Dual contraction waves also featured a pressure trough between two high-pressure segments. However, the minimum pressure in the region of overlap was much lower, and the amplitudes of the two high pressure segments were similar.
Conclusions & Inferences
The efficacy of esophageal transport is greatly affected by muscle fiber architecture. The peristaltic transition zone may be attributable to non-uniform architecture of muscle fibers along the length of the esophagus and/or dual contraction waves. The difference in amplitude between the proximal and distal pressure segments may be attributable to non-uniform muscle fiber architecture.
Keywords: esophageal peristalsis, transition zone, esophageal myoarchitecture, esophageal manometry, computer simulation
Graphical Abstract
Abbreviated abstract
The effect of varied muscle fiber architecture on esophageal peristalsis was studied based on a fully-coupled computational model. Results show that helical fiber architecture featured lesser wall stress and higher distensibility. Non-uniform fiber architecture and dual contraction waves featured a pressure trough between two high pressure segments. The peristaltic transition zone may be attributable to non-uniform muscle fiber architecture and/or dual contraction waves.
INTRODUCTION
Esophageal peristalsis is a biophysical process that transfers food through the esophagus. Bolus transport results from the contraction of muscle fibers controlled by the nervous system, potentially affected by both esophageal myoarchitecture and the neural control mechanism. With respect to esophageal myoarchitecture, a recent study of the bovine esophagus reported that esophageal muscle fiber architecture, i.e. the muscle fiber orientation, is quite complex (1). Specifically, in the proximal esophagus, both layers of muscle fibers are helically aligned, referred to here as helical muscle fiber architecture. On the other hand, in the distal esophagus, the muscle fibers are circumferentially (inner) and longitudinally (outer) aligned, referred to here as circumferential-longitudinal (C-L) fiber architecture. We refer to the transitioning from one to another myoarchitecture (e.g. helical to C-L) as non-uniform fiber architecture. Note that previous studies of esophageal musculature are almost exclusively based on the C-L fiber architecture, probably due to its simplicity (2–6). The mechanical and physiological implications of helical and non-uniform fiber architecture are essentially unstudied. We hypothesized that varied esophageal muscle fiber architecture imparts unique characteristics on esophageal peristalsis. In particular, we hypothesized that non-uniform fiber architecture could be a contributing factor for the peristaltic transition zone and a luminal pressure trough between two segments of greater peristaltic amplitude. In addition we hypothesized that it could lead to greater peristaltic amplitude in the distal pressure segment than that of the proximal segment, as observed in clinical studies. The first group of studies reported here addressed this issue.
The peristaltic pressure transition zone was initially reported as a locus of failed esophageal bolus transport by Kahrilas et al (7). Based on a mathematic model, Li et al. (8) reanalyzed the clinical data from Kahrilas et al. (7), and hypothesized the existence of two overlapping, but independent contractions as the genesis of the transition zone. Ghosh et al. (9, 10) studied normal and abnormal cases with concurrent high-resolution manometry and digital fluoroscopy. They reported that a luminal pressure trough between two high pressure segments was a uniform feature of esophageal peristalsis and labeled this as the pressure “transition zone”. Ghosh et al. (9) proposed dual contraction waves as the cause of the transition zone. Specifically, they proposed that an upper contraction wave (UCW) originated from the striated muscle in the pharynx and proximal esophageal body, and terminated in the transition zone. A lower contraction wave (LCW) was initiated distal to the UCW termination point in the smooth muscle in the lower esophageal body, and preceded by a short indentation wave (IW). Although these studies were based on clinical data, the underlying bio-physical cause of this unique pressure pattern remains speculative. Moreover, previous computer simulations by Li et al.(8) did not attempt to model the esophageal wall. The current model builds on this by integrating the esophageal wall, the bolus, and muscle activation into a single simulation. Furthermore, in our second group of studies, we simulated cases with dual contraction waves and extract detailed information on esophageal wall stress, bolus morphology, and the morphology of peristalsis during bolus transport.
MATERIALS AND METHODS
Model components
Our simulation studies are based on a recently developed computational model of esophageal transport (11), the second version of a fully-coupled esophageal model that incorporates more realistic behavior of the biological tissue, such as the interaction between connective tissue and embedded muscle fibers (12). In contrast, our first version (5) was limited to using a simple fiber network in characterizing the material behavior. The technical details of the fully-coupled model as well as related validation studies can be found in (11). The mathematical principles of the model are also briefly discussed in the Appendix. Here we summarize only the essential information relevant to the current study.
Most of the biophysical parameters used in these simulations are the same as in our previous model (5, 6) and can be found in the technical report (11). The esophagus was modeled as a multilayered deformable 18 cm tube, with its top end anchored in place and its bottom end free to move. We excluded the sphincters in the model. Initially, the proximal esophagus was distended by a swallowed liquid bolus. Distal to the bolus, the esophagus was at rest with a thin liquid film lining the lumen. The bolus was modeled as a Newtonian fluid with a viscosity of 10 centipoise and a volume of about 1 ml, within the range used in clinical studies (13). The specific problem we simulated was: How is the bolus transported to the distal esophagus after the muscle activation wave is initiated?
Anatomical model of esophageal wall: geometry and structure
Corresponding to histological data, the esophageal wall was modeled as a three-layered wall consisting of mucosa-submucosa (collectively called “mucosa”), circular muscle (CM) and longitudinal muscle (LM) layers. Similar to previous model (5, 6), we deduced the thickness of each layer from ultrasound data reported by Puckett et al. (14). The thickness of each esophageal layer was deduced based on the conservation of cross-sectional area (CSA). The lumen radius at rest was 0.3 mm. The calculated thickness of mucosal, CM and LM layers were 3.8 mm, 0.6 mm, and 0.6 mm, respectively. For the material property, in-vitro experiments have shown that each layer can be generally characterized as a fiber-reinforced material, i.e. a material with families of thin fibers embedded in the ground substance (15, 16). Specifically, the CM and LM consist of muscle fibers embedded in ground substance and the mucosal layer is composed of collagen fibrils embedded in connective tissue (15). The stiffness (or compliance) of each layer was characterized by the moduli of the fibers and surrounding tissue. Similar to our previous studies (5, 6), the moduli used for muscle fiber for both CM and LM were 4 kPa and the modulus used for the ground substance in both muscle layers was 0.4 kPa. The orientation of muscle fibers in CM and LM layers was varied as discussed in “Methods for case studies”. For the mucosa, we used moduli of 0.004 kPa for the connective tissue, and 0.04 kPa for a family of fibers running in the axial direction. This is because mucosa is highly buckled at rest (16), indicating its high compliance, especially in the lateral direction.
Muscle activation model
Experimental data have shown that both CM contraction and LM shortening are involved in esophageal transport (17–19). CM contraction and LM shortening originate from the sequential contraction and relaxation of corresponding muscle fibers, and normally occur in almost perfect synchrony (17–19). Our model “mimicked” the neurally controlled contraction/relaxation events by dynamically changing the rest stretch ratio of muscle fibers in the CM and LM layers. When the rest stretch ratio = 1.0, the muscle fiber is at rest or at relaxation; when the rest stretch ratio = 1.0 − a0, where 0< a0 < 1.0, the muscle fiber is in the contracted state. We refer to a0 here as the reduction ratio, which characterized the extent of fiber shortening in the contracted state. The active stress of muscle fiber increases with the modulus and with the reduction ratio. In all of the cases, we set the reduction ratio for both CM and LM muscle fibers as 0.4. We also used a Gaussian-shaped spatial distribution of sequential muscle activation. Greater detail can be found in our previous reports (5, 11, 20).
Methods for case studies
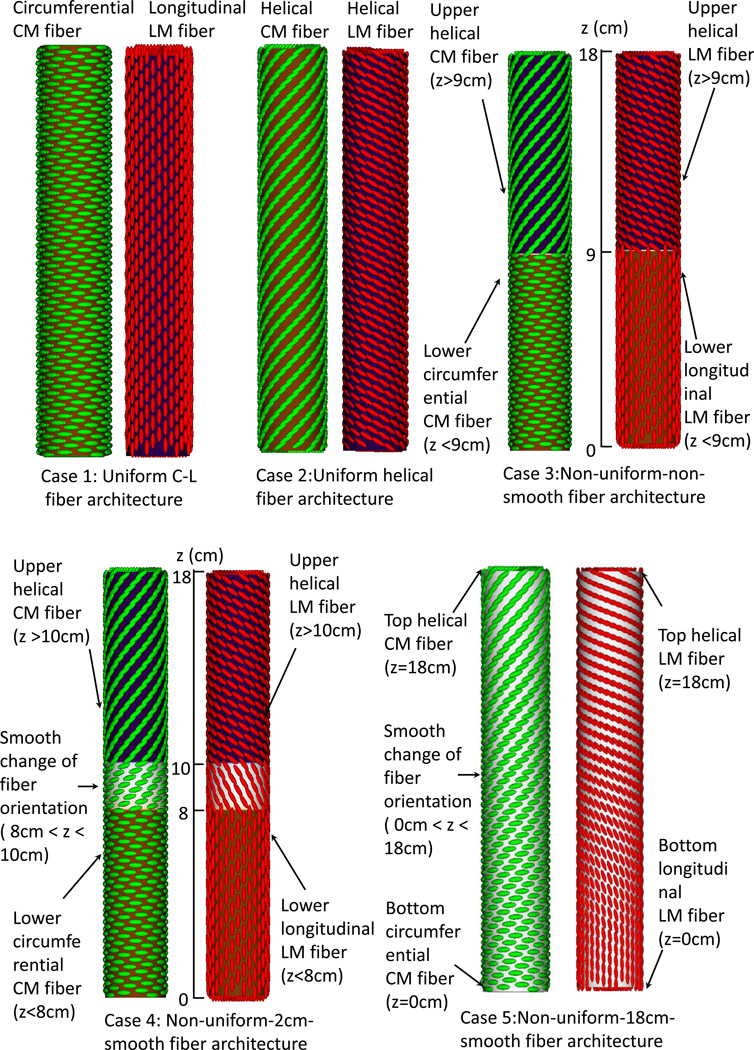
Two groups of case studies were conducted. The first group studied esophageal transport with varied fiber architecture, motivated by the bovine esophagus data (1). It had 5 cases, as illustrated in Figure 1A. Case 1 adopted uniform circumferential-longitudinal (C-L) fiber architecture and case 2 had uniform helical fiber architecture with the helical angle at 60° relative to the CM. Case 3 had non-uniform-non-smooth fiber architecture with an abrupt transition in the middle. Case 4 had non-uniform-2cm-smooth fiber architecture with a 2-cm transition region in the middle and case 5 had non-uniform-18 cm-smooth fiber architecture such that the fiber orientation smoothly transitioned from helical to C-L orientation.
Figure 1.
Illustration of the seven study cases for the Group 1(A) and Group 2(B). (A) Group 1: five cases of esophageal model (not to scale) that differ in fiber architecture. Notice the helical CM fiber orientation is 60 degrees with respect to the circumferential orientation. The helical LM fiber orientation is of 120 degrees with respect to the circumferential orientation. Case 1: Uniform circumferential-longitudinal (C-L) fiber architecture. Case 2: Uniform helical fiber architecture. Case 3: Non-uniform-non-smooth fiber architecture. The fiber orientation changes at the middle of the esophagus (i.e. z=9 cm). Case 4: Non-uniform-2cm-smooth fiber architecture. Between 10 cm to 8 cm is a 2-cm transition region where the fiber orientation smoothly changes from the proximal helical to the distal C-L orientation. Case 5: Non-uniform-18 cm-smooth fiber architecture. Along the entire esophagus (i.e. 18 cm), the fiber orientation smoothly transitions from the proximal helical to the distal C-L orientation.
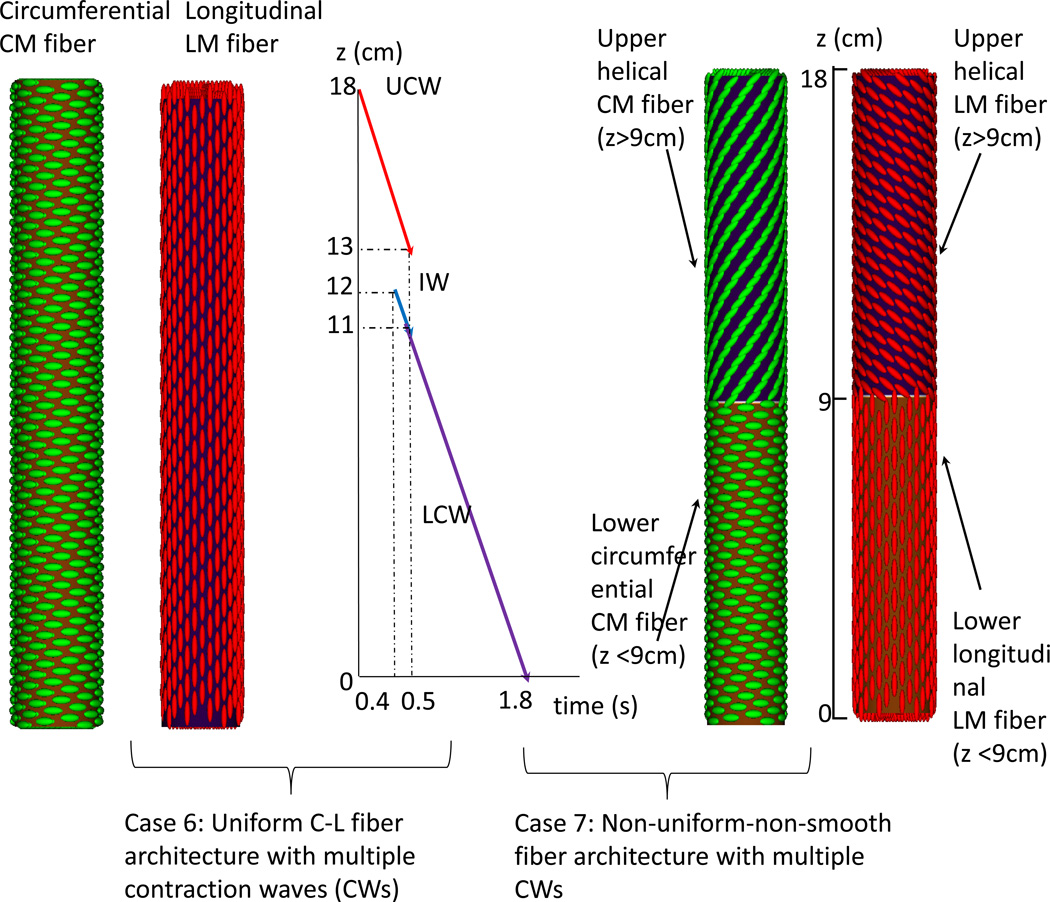
(B) Group 2: two cases with multiple contraction waves. Three contraction waves that correspond to the study in Ghosh et al. (9, 10) are specified: upper contraction wave (UCW), lower contraction wave (LCW), and indentation wave (IW). UCW occurs in the proximal 5-cm of the esophagus (i.e. 18 cm – 13 cm). LCW occurs in the distal 11-cm of the esophagus. LCM starts just when the UCW terminates. Preceding LCW is a 1-cm indentation wave (IW), which overlaps with the UCW in time. The speed of all three waves is specified as 10 cm/s. Case 6: Uniform C-L fiber architecture with dual contraction waves. Case 7: Non-uniform-non-smooth fiber architecture with dual contraction waves.
The second group of studies examined esophageal transport with dual contraction waves (CWs) and an indentation wave (IW), motivated by the Ghosh et al study (9, 10). This is illustrated in Figure 1B. Approximating the values reported by Ghosh et al (10), we specify a UCW that terminates at 5 cm, a 2-cm spatial jump between UCW and LCW, and a 1-cm IW. Case 6 had uniform C-L fiber architecture and Case 7 had non-uniform-non-smooth fiber architecture.
Software and visualization method
All cases were simulated using our in-house code built on the top of IBAMR (21) software, a parallelized code to simulate large systems involving fluid-structure interactions. For each case, we solved 100,000 time steps to advance the simulation of bolus transport by 2 seconds in physical time. The solution of each time step involved several million variables in both the fluid (i.e. the bolus) and the structure (i.e. the multi-layered esophagus). We ran our cases on the Northwestern University supercomputer, Quest; each simulation used 48 processors and took about 150 hours. We used ‘Visit’ (22) for post-processing of simulation results to examine the esophageal wall stress, velocity and intraluminal pressure. We also used MATLAB (The MathWorks, Inc., Natick, Massachusetts, United States) to quantify detailed geometric information and luminal pressure along the axial direction.
RESULTS
Group 1 cases
Varied muscle fiber architecture
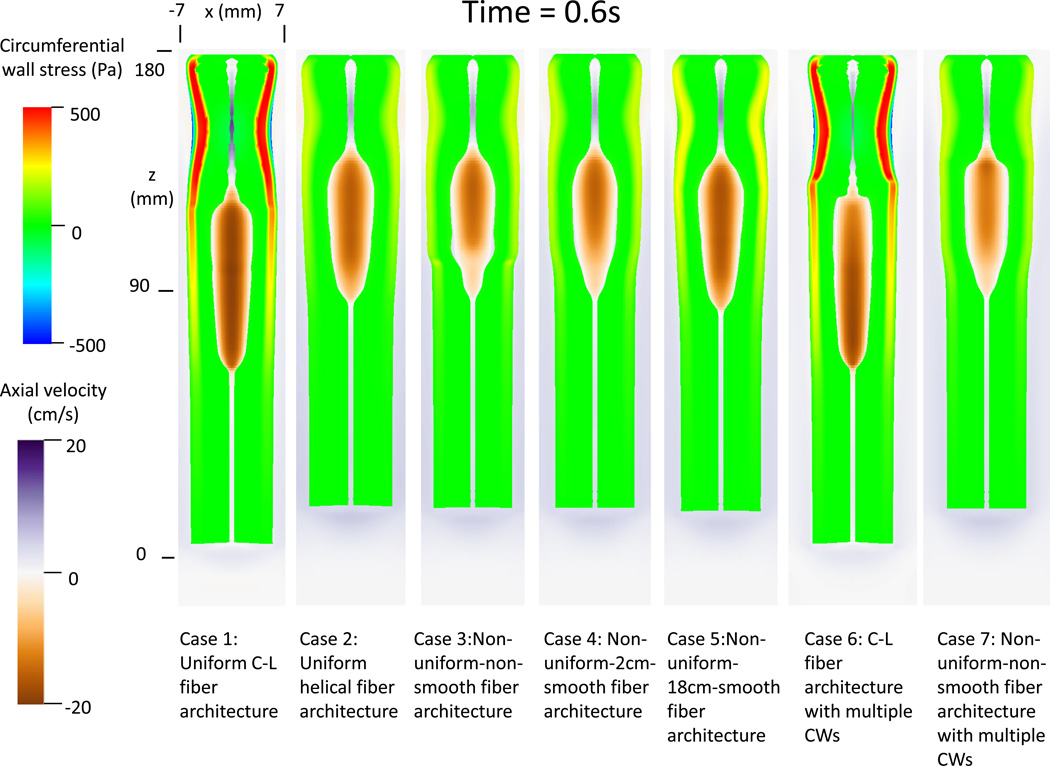
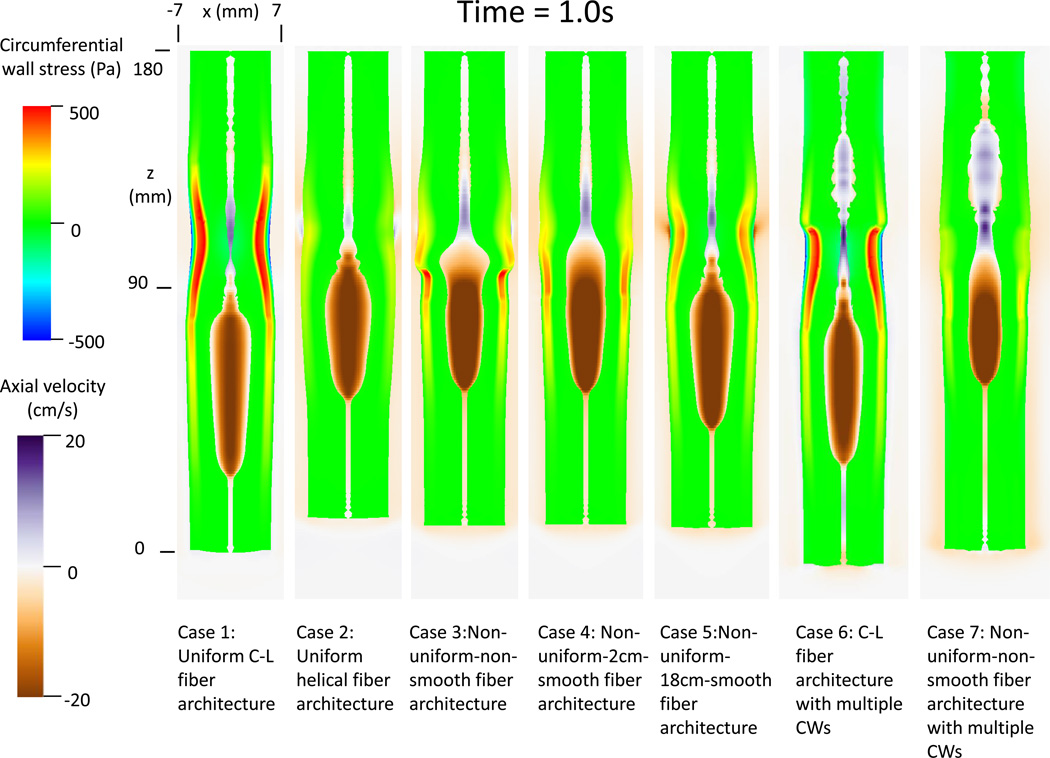
Figure 2A and 2B depicts the circumferential wall stress and axial bolus velocity of all the cases, at times 0.6 s and 1.0 s, respectively. Although all 5 cases in Group 1 resulted in successful bolus transport, the esophageal wall behavior was quite different. Case 1 with uniform C-L fiber architecture showed the greatest peak in circumferential wall stress, whereas Case 2 with uniform helical fiber architecture showed the least. Also evident in Figure 2A and 2B, cases with the helical configuration (2, 3, 4, 5 and 7) led to more pronounced axial shortening. Finally, cases with uniform fiber architecture (1 and 2), showed minimal spatial variation in peak circumferential stress. In contrast, cases with non-uniform fiber architecture exhibited increased circumferential wall stress at time 1.0 s compared to time 0.6 s. These observations imply that contraction of C-L fiber architecture generates a higher wall squeezing stress, while the contraction of helical fiber architecture generates more pronounced axial shortening. Also, as expected, esophageal wall thickness is diminished in the bolus region due to distention and increased in the region where muscle contraction occurred (see, for example, Case 2 in Figure 2A).
Figure 2.
Circumferential esophageal wall stress and velocity field of bolus in the plane y = 0 (i.e. x-z plane) for modeled cases. (A) Results at time t = 0.6s; (B) Results at time t = 1.0 s.
The bolus profile was also affected by muscle fiber architecture. Contraction of helical muscle fibers tended to have a shorter and broader bolus region. Moreover, cases with non-uniform muscle fiber architecture showed a distinctive change of bolus profile near the location where the muscle fiber architecture transitioned. The change was less abrupt with a longer transition region, as seen in Cases 3–5. The change of bolus profile relates to the change of both muscle fiber contractile force and esophageal wall distensibility. In particular, the helical fiber architecture featured a lower contractile force and higher esophageal distensibility, as seen from Cases 3–4 at time = 1.0s.
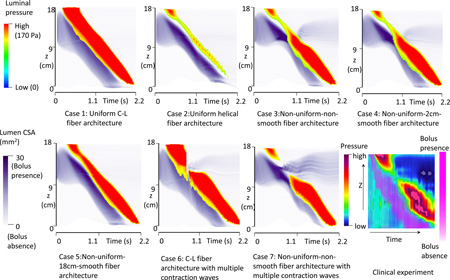
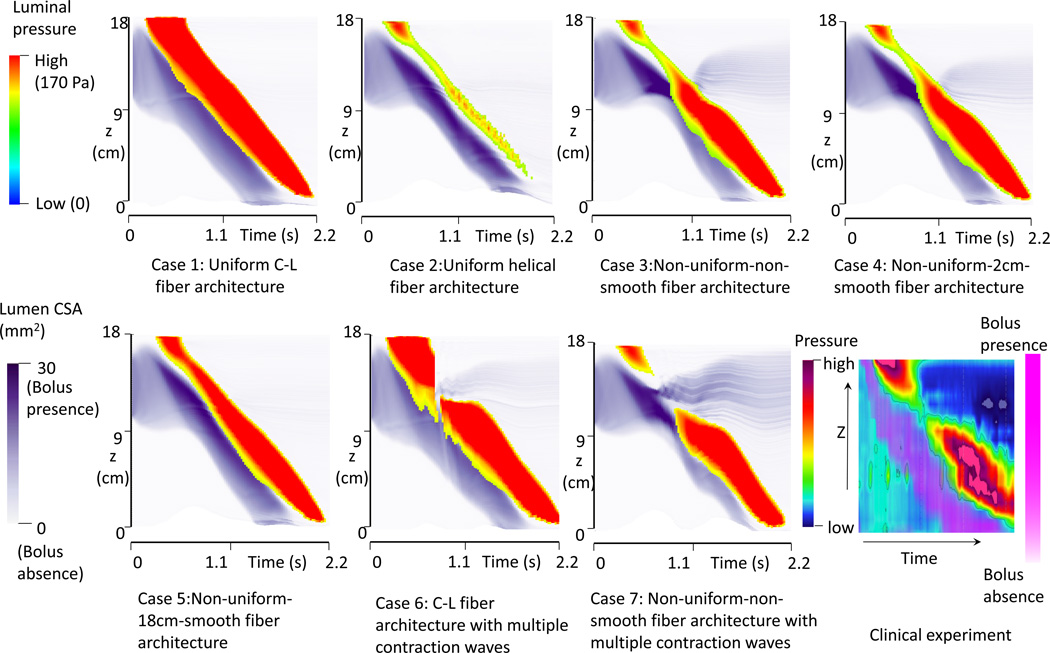
The space-time profiles for both luminal pressure and bolus CSA are plotted in Figure 3. The magnitude of luminal pressure reflects the squeezing strength from muscle activation, similar to high-resolution manometric measurement. The intensity of the purple shading in Figure 3 indicates the spatial distribution and CSA of the moving bolus, analogous to fluoroscopy. Contrasting Cases1 and 2 exemplifies that helical muscle fiber architecture is associated with lower luminal pressure and a wider, shorter bolus region. Cases 3–5 demonstrate that non-uniform muscle fiber architecture is associated with a pressure trough (transition zone) between two high-pressure waves. Comparing Cases 3–4 with Case 5, the pressure transition zone was more pronounced with a shorter region of muscle fiber transition. The transition zone was also associated with a wider bolus, (greater CSA) and bolus retention (residual bolus above the muscle contraction). Mechanically, this occurred because esophageal wall distensibility was low for the distal segment with C-L muscle fiber architecture and the squeezing force from the above helical muscle fibers was also low. Hence, the bolus tended to slow and grow laterally in the helical fiber segment.
Figure 3.
The time-space profile of the luminal pressure and bolus CSA for all modeled cases and from a clinical manometry study. The luminal CSA indicates the bolus location. Luminal pressure magnitude indicates the active tone of muscle contraction.
Group 2 cases
Dual contraction waves
Cases 6 and 7 in Figure 2A and 2B illustrate the cases with dual contraction waves. Compared with Case 1, Case 6 showed segmentation of esophageal wall stress as a result of segmentation of muscle activation. This resulted in bolus retention. Mechanically, the spatial jump in muscle activation waves led to a loss of pumping force during that period. Case 7 with non-uniform-non-smooth fiber architecture showed even more pronounced bolus retention. This occurred because the variation of esophageal wall distensibility and contractile force associated with helical fiber architecture compounded the effect of the dual contraction waves.
The space-time profile for luminal pressure and bolus CSA for Cases 6 and 7 are shown in Figure 3. Compared with Case 3 and Case 4 in Figure 3, Cases 6 and 7 showed a loss of the pressure wave, instead of a pressure trough and both cases were associated with bolus retention. In particular, Case 7 showed a wider region of pressure loss with greater bolus retention.
DISCUSSION
The major finding from the simulations described in this study was that variations in esophageal muscle fiber architecture affected both the active (contractile) and passive (distensive) behavior of the esophageal wall. Specifically, we found that helical fiber architecture led to less circumferential wall stress during muscle fiber contraction, greater esophageal distensibility, and more pronounced axial shortening. More interestingly, cases with non-uniform fiber architecture (i.e. upper helical and lower C-L fiber architecture) exhibited a distinctive luminal pressure trough between two segments of greater peristaltic amplitude, similar to the clinically observed peristaltic transition zone (9). Moreover, cases with non-uniform fiber architecture also showed that the distal segment was of greater peristaltic amplitude than the proximal one, consistent with clinical observations.
Ultimately, the genesis of the peristaltic transition zone is unknown. A previous hypothesis proposed dual contraction waves of neurogenic origin. An attractive feature of that hypothesis is that it fits with the duality of esophageal musculature transitioning from striated in the proximal esophagus to smooth distally. Presumably, the striated muscle is under the control of the central nervous system as a continuation of the pharyngeal swallow and the enteric nervous system generates the distal wave beginning at the transition zone. Electrophysiological experiments in baboons have demonstrated the proximal (striated muscle) contraction to be a function of a medullary pattern generator(23). Similarly, nerve transection and bolus deviation experiments demonstrate vagal control of the distal (smooth muscle) esophagus through the intervening myenteric plexus in opossum, monkey and humans(24). However, the current study adds the possibility of a myogenic origin as well, i.e. non-uniform muscle fiber architecture.
In addition, the two pressure segments typically do not show similar peristaltic amplitude. Clinical studies show that the distal pressure segment often has greater amplitude than the proximal one (see the last plot in Figure 3). This difference in amplitude has not been explained by the previous dual-wave hypothesis. Our simulations show that this difference may also be attributable to the non-uniform fiber architecture. In particular, the distal C-L fiber architecture generates greater peristaltic amplitude than the proximal helical fiber architecture.
Cases with non-uniform fiber architecture are based on the assumption that the human esophagus consists of a similar upper-helical and lower C-L fiber architecture as has been demonstrated with diffusion spectrum imaging in the bovine esophagus. If this assumption holds, we conjecture that the spatial variation of both muscle type and muscle fiber architecture of human esophagus contribute to the observed pressure transition zone. The spatial variation of muscle fiber architecture also contributes to the difference in the peristaltic amplitude between the two pressure segments. Future experiments to obtain muscle fiber architecture data from the human esophagus are needed to further substantiate that conjecture.
Ghosh et al. (10) studied patients with poor bolus clearance using concurrent high resolution manometry and digital fluoroscopy. They reported that bolus retention in the transition zone was associated with excessive spatial separation between the upper and lower pressure waves leading to low amplitude contraction in the transition zone. This is consistent with the observation from our modeling results, shown in Case 7 of Figure 3. This might be linked to discoordination between the proximal and distal neural control mechanisms governing the UCW and LCW.
Our computational model has limitations. First we modeled the wave speed of sequential muscle contraction as 10 cm/s, which is faster than normally observed. We did this to reduce the computational time required for these large-scale simulations. Second, we assumed that the active muscle tone is from the contraction of muscle fibers with the same stiffness as in the passive state. This may under-predict the magnitude of muscle tension and luminal pressure. However, we present our results and conclusions in such a way that they depend on the relative, but not the absolute magnitude of pressure. In all of our cases, we specified a sequential muscle contraction wave of constant magnitude to minimize the influence of muscle contraction strength on luminal pressure variation. However, a more realistic muscle contraction wave with varying strength, if known, can be easily incorporated into the model. Finally, we modeled esophageal mucosa as a compliant material. This is likely valid as an “effective behavior” in the low-distention realm with minimal esophageal distention where the mucosa is highly buckled. The mucosal layer likely stiffens in the large-distention realm, for example, due to a larger bolus than modeled here or during balloon distention. This stiffening behavior of the mucosa may be the object of future studies.
In conclusion, based on a fully coupled computational model of esophageal transport, we found that varied muscle fiber architecture altered the characteristics of esophageal peristalsis. These are among the first studies to examine non-simplistic myoarchitecture as a determinant of complex physiological processes such as esophageal transport. Of interest, we found that helical muscle fiber architecture featured less circumferential wall stress, greater esophageal distensibility and more pronounced axial shortening. Non-uniform fiber architecture (i.e. proximal helical and distal C-L fiber architecture) featured a distinctive luminal pressure trough between two segments of greater peristaltic amplitude, similar to the clinically observed pressure transition zone (9). The amplitude of the distal pressure segment was greater than that of the proximal one, similar to clinical observations. Dual contraction waves also features a pressure trough between two greater amplitude peristaltic segments, but the minimum pressure in the region of overlap was lower and the amplitudes of the two pressure segments were similar. We conclude that the clinically observed transition zone may be partially attributable to non-uniform esophageal muscle fiber architecture in addition to dual contraction waves of neurogenic origin.
Key Points.
The mechanical and physiological implication of helical fiber architecture and non-uniform fiber architecture, which more closely resemble observations, is essentially unstudied. Here we used computer simulations to study the effect of varied muscle fiber architecture on esophageal peristalsis.
Helical fiber architecture featured lesser wall stress and higher distensibility. Non-uniform fiber architecture and dual contraction waves featured a pressure trough between two high pressure segments.
The peristaltic transition zone may be attributable to non-uniform muscle fiber architecture and/or dual contraction waves.
Acknowledgments
Financial support: This work was supported by Public Health Service grants DK056033 (to P.J.K.) and DK079902 (to J.E.P.).
Abbreviations
- LM
longitudinal muscle
- CM
circular muscle
- CSA
cross-sectional area
- C-L fiber
circumferential-longitudinal fiber
- UCW
upper contraction wave
- LCW
lower contraction wav
Appendix: mathematical information of the simulation model
Here we provide a brief discussion on mathematical information of the model for readers that have interests in the simulation techniques. We refer to our technique report (11) for more details, including related derivations, discussions and validations. The model is based on the immersed-boundary-finite-element method (11). The method adopts an Eulerian description of the momentum and continuity equations of the fluid-structure system (i.e. the bolus-esophagus system here), and a Lagrangian description of the deformation and stresses of the structure only (i.e. the esophageal structure here). The governing equations are as below,
| (1) |
| (2) |
| (3) |
| (4) |
| (5) |
| (6) |
| (7) |
Eqs. (1) and (2) are the momentum equation and continuity equations in the Eulerian description, where u and p are Eulerian velocity and pressure, respectively. ρ and μ are the uniform density and viscosity of the fluid-structure system. Eqs. (3)–(6) are fluid-structure interaction equations, in which fe and Fe are the Eulerian and Lagrangian elastic force density, respectively. Ue(s, t), χ(s, t) and Σ are velocity, position and the first Piola-Kirchhoff stress of the structure, respectively. Eq. (8) is the stress equation that depends on the active and passive material model. Eq. (8) is a generic form, whose specific expression in this work is complicated in order to account for multiple active muscle contractions and fiber-matrix elasticity of the multiple-layered esophageal wall (see Section 4.1 in Ref.(11)). Details on the governing equations including its derivation can be found in Section 2 of Ref. (11).
As for the boundary conditions, the top of the esophageal structure is fixed in place to account for the physiological constraints. The inner and outer surfaces as well as the bottom of the esophageal structure are free from constraints, so that the esophageal dilation and contraction as well as esophageal shortening can be replicated by the simulation. To use the immersed boundary method, the whole esophagus is immersed in a background fluid box, which is also needed to describe the moving bolus. Corresponding to the boundary conditions of the esophagus structure, we specify zero-velocity boundary conditions on the top surface of the fluid box and traction-free boundary conditions on all the other surfaces. More details can be found in Section 4.1 of Ref. (11).
Our model includes two meshes, the Eulerian mesh and Lagrangian mesh. The Eulerian mesh adopts a Cartesian mesh. The mesh size in x and y direction is 0.2mm, and in 0.9 mm in z direction, as the esophagus is a very long and thick tube. This leads to around one million Eulerian cells. The Lagrangian mesh is based on finite element description. Three-dimensional linear finite elements are used and a novel adaptive interaction quadrature rule is introduced to handle the fluid-structure interaction. More details can be found in Ref. (11). Validations studies including the dilation of a short thick tube and the dilation of a long thin tube are also included in the Ref.(11).
Footnotes
Specific author contributions:
W.K., N.A.P., J.E.P., and P.J.K. conceived research and designed simulations; W.K. and N.A.P. did computational work; W.K. and N.A.P. theoretically analyzed the results; W.K., N.A.P, J.E.P., and P.J.K. interpreted simulation results; W.K. drafted the manuscript; W.K., N.A.P., J.E.P., and P.J.K. edited and revised the manuscript.
Potential competing interests: John E. Pandolfino discloses consulting and educational association with Given Imaging and Sandhill Scientific. No relevant competing financial and other interests exist for other authors (W.K., P.J.K. and N.A.P.).
References
- 1.Gilbert RJ, Gaige TA, Wang R, et al. Resolving the three-dimensional myoarchitecture of bovine esophageal wall with diffusion spectrum imaging and tractography. Cell Tissue Res. 2008;332:461–468. doi: 10.1007/s00441-008-0601-0. [DOI] [PubMed] [Google Scholar]
- 2.Brasseur JG, Nicosia MA, Pal A, Miller LS. Function of longitudinal vs circular muscle fibers in esophageal peristalsis, deduced with mathematical modeling. World J Gastroenterol. 2007;13:1335–1346. doi: 10.3748/wjg.v13.i9.1335. [DOI] [PMC free article] [PubMed] [Google Scholar]
- 3.Nicosia MA, Brasseur JG. A mathematical model for estimating muscle tension in vivo during esophageal bolus transport. J Theor Biol. 2002;219:235–255. doi: 10.1006/jtbi.2002.3118. [DOI] [PubMed] [Google Scholar]
- 4.Ghosh SK, Kahrilas PJ, Brasseur JG. Liquid in the gastroesophageal segment promotes reflux, but compliance does not: a mathematical modeling study. Am J Physiol Gastrointest Liver Physiol. 2008;295:G920–G933. doi: 10.1152/ajpgi.90310.2008. [DOI] [PMC free article] [PubMed] [Google Scholar]
- 5.Kou W, Bhalla APS, Griffith BE, Pandolfino JE, Kahrilas PJ, Patankar NA. A fully resolved active musculo-mechanical model for esophageal transport. J Comput Phys. 2015;298:446–465. doi: 10.1016/j.jcp.2015.05.049. [DOI] [PMC free article] [PubMed] [Google Scholar]
- 6.Kou W, Pandolfino JE, Kahrilas PJ, Patankar NA. Simulation studies of circular muscle contraction, longitudinal muscle shortening, and their coordination in esophageal transport. Am J Physiol Gastrointest Liver Physiol. 2015;309:G238–G247. doi: 10.1152/ajpgi.00058.2015. [DOI] [PMC free article] [PubMed] [Google Scholar]
- 7.Kahrilas P, Dodds W, Hogan W. Effect of peristaltic dysfunction on esophageal volume clearance. Gastroenterology. 1988;94:73–80. doi: 10.1016/0016-5085(88)90612-9. [DOI] [PubMed] [Google Scholar]
- 8.Li M, Brasseur JG, Dodds WJ. Analyses of normal and abnormal esophageal transport using computer simulations. Am J Physiol Gastrointest Liver Physiol. 1994;266:G525–G543. doi: 10.1152/ajpgi.1994.266.4.G525. [DOI] [PubMed] [Google Scholar]
- 9.Ghosh SK, Janiak P, Schwizer W, Hebbard GS, Brasseur JG. Physiology of the esophageal pressure transition zone: separate contraction waves above and below. Am J Physiol Gastrointest Liver Physiol. 2006;290:G568–G576. doi: 10.1152/ajpgi.00280.2005. [DOI] [PubMed] [Google Scholar]
- 10.Ghosh SK, Janiak P, Fox M, Schwizer W, Hebbard GS, Brasseur JG. Physiology of the oesophageal transition zone in the presence of chronic bolus retention: studies using concurrent high resolution manometry and digital fluoroscopy. Neurogastroenterology & Motility. 2008;20:750–759. doi: 10.1111/j.1365-2982.2008.01129.x. [DOI] [PubMed] [Google Scholar]
- 11.Kou W, Griffith BE, Pandolfino JE, Kahrilas PJ, Patankar NA. A continuum mechanics-based musculo-mechanical model for esophageal transport. 2016 doi: 10.1016/j.jcp.2017.07.025. arXiv:1609 03965. [DOI] [PMC free article] [PubMed] [Google Scholar]
- 12.Limbert G, Taylor M. On the constitutive modeling of biological soft connective tissues: A general theoretical framework and explicit forms of the tensors of elasticity for strongly anisotropic continuum fiber-reinforced composites at finite strain. International Journal of Solids and Structures. 2002;39:2343–2358. [Google Scholar]
- 13.Dantas RO, Kern MK, Massey BT, et al. Effect of swallowed bolus variables on oral and pharyngeal phases of swallowing. Am J Physiol. 1990;258:G675–G681. doi: 10.1152/ajpgi.1990.258.5.G675. [DOI] [PubMed] [Google Scholar]
- 14.Puckett JL, Bhalla V, Liu J, Kassab G, Mittal RK. Oesophageal wall stress and muscle hypertrophy in high amplitude oesophageal contractions. Neurogastroenterol Motil. 2005;17:791–799. doi: 10.1111/j.1365-2982.2005.00693.x. [DOI] [PubMed] [Google Scholar]
- 15.Natali AN, Carniel EL, Gregersen H. Biomechanical behaviour of oesophageal tissues: Material and structural configuration, experimental data and constitutive analysis. Med Eng Phys. 2009;31:1056–1062. doi: 10.1016/j.medengphy.2009.07.003. [DOI] [PubMed] [Google Scholar]
- 16.Yang W, Fung TC, Chian KS, Chong CK. Directional, regional, and layer variations of mechanical properties of esophageal tissue and its interpretation using a structure-based constitutive model. J Biomech Eng. 2006;128:409–418. doi: 10.1115/1.2187033. [DOI] [PubMed] [Google Scholar]
- 17.Pouderoux P, Lin S, Kahrilas PJ. Timing, propagation, coordination, and effect of esophageal shortening during peristalsis. Gastroenterology. 1997;112:1147–1154. doi: 10.1016/s0016-5085(97)70125-2. [DOI] [PubMed] [Google Scholar]
- 18.Nicosia MA, Brasseur JG, Liu JB, Miller LS. Local longitudinal muscle shortening of the human esophagus from high-frequency ultrasonography. Am J Physiol Gastrointest Liver Physiol. 2001;281:G1022–G1033. doi: 10.1152/ajpgi.2001.281.4.G1022. [DOI] [PubMed] [Google Scholar]
- 19.Mittal RK, Padda B, Bhalla V, Bhargava V, Liu JM. Synchrony between circular and longitudinal muscle contractions during peristalsis in normal subjects. Am J Physiol Gastrointest Liver Physiol. 2006;290:G431–G438. doi: 10.1152/ajpgi.00237.2005. [DOI] [PubMed] [Google Scholar]
- 20.Kou W, Griffith BE, Pandolfino JE, Kahrilas PJ, Patankar NA. A musculo-mechanical model of esophageal transport based on an immersed boundary-finite element approach. APS Division of Fluid Dynamics (Fall) 2015, abstract #G26009. 2015 [Google Scholar]
- 21.Griffith BE, Hornung RD, McQueen DM, Peskin CS. An adaptive, formally second order accurate version of the immersed boundary method. J Comput Phys. 2007;223:10–49. [Google Scholar]
- 22.Childs H. VisIt: An end-user tool for visualizing and analyzing very large data. 2013 [Google Scholar]
- 23.Roman C, Tieffenbach L. Enregistrement de l'activité unitaire des fibres motrices vagales destinées à l'oesophage du babouin. J Physiol (Paris) 1972;64:479–506. [PubMed] [Google Scholar]
- 24.Janssens J, De Wever I, Vantrappen G, Hellemans J. Peristalsis in smooth muscle esophagus after transection and bolus deviation. Gastroenterology. 1976;71:1004–1009. [PubMed] [Google Scholar]


