

Abstract
Notch induces Hairy Enhancer of Split (Hes)1 and Hes-related with YRPW motif (Hey) Hey1, Hey2 and Hey-like (HeyL) expression in osteoblasts, but it is not known whether any of these target genes mediates the effect of Notch in the skeleton. We demonstrated that Notch1 activation in osteoblasts/osteocytes induces Hes1, Hey1, Hey2 and HeyL, but HeyL was induced to a greater extent than other target genes. To characterize HeyL null mice for their skeletal phenotype, microcomputed tomography (μCT) and histomorphometric analysis of HeyL null and sex-matched littermate controls was performed. μCT demonstrated modest cancellous bone osteopenia in 1 month old male mice and normal microarchitecture in 3 month old male HeyL null mice. Female HeyL null mice were not different from controls at either 1 or 3 months of age. Bone histomorphometry did not demonstrate differences between HeyL null mice of either sex and littermate controls. In conclusion, HeyL null mice do not exhibit an obvious skeletal phenotype demonstrating that HeyL is dispensable for skeletal homeostasis.
Keywords: Notch, HeyL, bone remodeling, osteoblasts, osteocytes
INTRODUCTION
Notch (1 to 4) are transmembrane receptors that play a central role in skeletal development and homeostasis, and in osteoblast and osteoclast differentiation [Fortini, 2009; Sahlgren and Lendahl, 2006; Zanotti and Canalis, 2010; Zanotti and Canalis, 2016]. Notch signaling is activated following interactions of Notch receptors with ligands of the Jagged and Delta-like families. This results in the proteolytic cleavage of the receptor and the release of the Notch intracellular domain (NICD) [Zanotti and Canalis, 2010]. The NICD translocates to the nucleus, where it forms a complex with recombination signal binding protein for immunoglobulin kappa J region and mastermind-like to induce the transcription of Notch target genes [Kovall, 2008; Nam et al., 2006; Schroeter et al., 1998; Wilson and Kovall, 2006]. Classic canonical Notch target genes include Hairy Enhancer of Split (Hes) and Hes-related with YRPW motif (Hey) [Iso et al., 2003; Kageyama et al., 2007]. Activation of Notch1 in skeletal cells leads to the induction of Hes1, Hey1, Hey2 and Hey-like (HeyL), but it is not known which, if any, of these target genes mediates the effects of Notch in the skeleton [Canalis et al., 2013b].
Hey genes encode for 3 basic helix-loop-helix (bHLH) transcription factors termed Hey1, Hey2 and Hey-like (HeyL) [Iso et al., 2003]. Hey proteins are structurally similar to Hes, and Hes and Heys, can form homodimers and heterodimers that bind to DNA to regulate transcription [Iso et al., 2003]. Heys play an important role in cardiovascular development. Inactivation of Hey2 results in embryonic lethality due to cardiovascular defects, and the dual inactivation of Hey1 and Hey2 phenocopies the global deletion of Notch1 [Fischer et al., 2004; Kokubo et al., 2005; Kokubo et al., 2004; Xin et al., 2007]. Similarly, the deletion of Hey1 and HeyL in mice impairs cardiovascular development [Fischer et al., 2007].
Notch1 and Notch2 inhibit the maturation of osteoblasts and their activation causes osteopenia [Canalis et al., 2013b; Canalis et al., 2016; Yorgan et al., 2016; Zanotti and Canalis, 2014; Zanotti et al., 2008]. However, the effects of Notch are cell-context dependent; and when activated in osteocytes, Notch1 induces osteoprotegerin, inhibits bone resorption and causes osteopetrosis [Canalis et al., 2013a]. The effects of Notch in the skeleton appear to be mediated by the canonical signaling pathway, but the genes responsible for the actions of Notch in bone have not been defined [Canalis et al., 2015; Dong et al., 2010; Tao et al., 2010]. Hes1, Hey1, Hey2 and HeyL are responsive to Notch canonical signaling and may be responsible, singly or in combination, for the effects of Notch in the skeleton [Zanotti et al., 2011b; Zanotti et al., 2013]. Previously, we reported that transgenic expression of Hes1 under the control of the collagen type-I α1 (Col1a1) promoter causes osteopenia by inhibiting bone formation and inducing bone resorption [Zanotti et al., 2011a]. These effects of Hes1 phenocopied only partially the skeletal phenotype of mice harboring a gain-of-Notch1 function, suggesting that other genes might be downstream effectors of Notch signaling in the skeleton [Engin et al., 2008; Zanotti et al., 2011a; Zanotti et al., 2008]. Transgenic expression of Hey1 under the control of the β-actin promoter as well as the global inactivation of Hey1 cause modest osteopenia [Salie et al., 2010]. We demonstrated that the conditional inactivation of Hey2 in cells of the osteoblastic lineage cause a modest and apparently transient increase in cancellous bone, whereas the transgenic expression of Hey2 in Col1a1-expressing cells causes osteopenia [Zanotti and Canalis, 2013]. These observations would suggest that Hes and Hey genes play a negative regulatory role in bone homeostasis. HeyL inactivation was reported to cause an increase in trabecular bone volume, but the effect was mostly observed in the context of a heterozygous inactivation of Hey1 [Tu et al., 2012].
HeyL is particularly responsive to Notch1 activation in skeletal cells, suggesting that it could be an important mediator of Notch action in bone. Because of these reasons, we wished to reassess the role of HeyL in bone remodeling. The purpose of the present work was to define the skeletal phenotype of HeyL null mice and answer the question as to whether the phenotype of Notch1 activation could be explained by direct effects of HeyL in bone cells. To this end, HeyL null and control sex-matched littermate mice were characterized by bone microarchitectural and histomorphometric analyses.
MATERIALS AND METHODS
RosaNotch Mice
RosaNotch mice were obtained from the Jackson Laboratory in a C57BL/6J genetic background [Murtaugh et al., 2003; Stanger et al., 2005]. In these mice, the Rosa26 locus is targeted with a DNA construct encoding for the Notch1 intracellular domain (NICD), preceded by a STOP cassette flanked by loxP sites, cloned downstream of the Rosa26 promoter. Expression of the NICD from the targeted Rosa26 locus occurs following the excision of the STOP cassette by Cre recombination of loxP sequences [Buchholz et al., 1996; Sauer and Henderson, 1988]. To activate Notch1 in mature cells of the osteoblastic lineage and osteocytes, transgenic mice expressing the Cre recombinase under the control of a ~10 kilobase fragment of the dentin matrix protein (Dmp)1 promoter (Dmp1-Cre) in a C57BL/6J genetic background were obtained from J. Feng (Dallas, TX) [Lu et al., 2007]. Homozygous RosaNotch mice were mated with hemizygous Dmp1-Cre+/− mice to create 50% Dmp1-Cre+/−;RosaNotch/WT experimental and 50% RosaNotch/WT littermate controls. Genotyping was carried out by polymerase chain reaction (PCR) in tail DNA extracts using specific primers (all from Integrated DNA Technologies (IDT), Coralville, IA; Table 1A). Deletion of the loxP-flanked STOP cassette by the Cre recombinase was documented by PCR in DNA extracted from tibiae, as previously published [Canalis et al., 2015; Canalis et al., 2013b].
Table 1.
Primers used for allele identification by PCR or for qRT-PCR determination.
| A. Genotyping | |||
|---|---|---|---|
| Allele | Strand | Sequence 5′-3′ | Amplicon Size (base pairs) |
| Dmp1-Cre transgene | Forward Reverse |
CCCGCAGAACCTGAAGATG GACCCGGCAAAACAGGTAG |
534 |
| HeyL | Wild type Forward Null Forward Reverse |
GGATCCTTCAGCTCTGAGAAA CGCCAGGGTTTTCCCAGTCACGAC TGTTGCACACTCACCCCTCT |
Wild type = 123 Null = 210 |
| RosaNotch | Forward Wild type Reverse RosaNotch Reverse |
GGAGCGGGAGAAATGGATATG AAAGTCGCTCTGAGTTGTTATTG GCGAAGAGTTTGTCCTCAACC |
Wild type = 600 RosaNotch = 250 |
| B. qRT-PCR | |||
|---|---|---|---|
| Gene | Strand | Sequence 5′-3′ | GenBank Accession Number |
| Hes1 | Forward Reverse |
ACCAAAGACGGCCTCTGAGCACAGAAAGT ATTCTTGCCCTTCGCCTCTT |
NM_008235 |
| Hey1 | Forward Reverse |
ATCTCAACAACTACGCATCCCAGC GTGTGGGTGATGTCCGAAGG |
NM_010423 |
| Hey2 | Forward Reverse |
AGCGAGAACAATTACCCTGGGCAC GGTAGTTGTCGGTGAATTGGACCT |
NM_013904 |
| HeyL | Forward Reverse |
CAGTAGCCTTTCTGAATTGCGAC AGCTTGGAGGAGCCCTGTTTC |
NM_013905 |
| Notch1 | Forward Reverse |
GTGCTCTGATGGACGACAAT GCTCCTCAAACCGGAACTTC |
NM_008714 |
| Rpl38 | Forward Reverse |
AGAACAAGGATAATGTGAAGTTCAAGGTTC CTGCTTCAGCTTCTCTGCCTTT |
NM_001048057; NM_001048058; NM_023372 |
HeyL Null Mice
To study the skeletal consequences of the global HeyL inactivation, we used mice where exons 2 to 4, encoding for the bHLH domain, were replaced with an in-frame LacZ-neo cassette [Fischer et al., 2007]. HeyL null mice were backcrossed into a C57BL/6J background for >9 generations and were kindly provided by M. Gessler (Wuerzburg, Germany) following the removal of the neo selection cassette by Cre recombination. HeyL null mice were previously shown to be grossly normal and fertile [Fischer et al., 2007]. Genotyping of HeyL null mice was conducted in tail DNA extracts by PCR using specific primers (all from IDT; Table 1A). In this study, mice homozygous for the HeyL deletion and control mice were obtained by intermating heterozygous HeyL null mice. One and 3 month old male and female null and control sex-matched littermate mice were analyzed.
Animal studies were approved by the Institutional Animal Care and Use Committee of St. Francis Hospital and Medical Center.
Microcomputed Tomography (μCT)
Bone microarchitecture of femurs from experimental and control mice was determined using a microcomputed tomography instrument (μCT 40; Scanco Medical AG, Bassersdorf, Switzerland), which was calibrated periodically using a phantom provided by the manufacturer [Bouxsein et al., 2010; Glatt et al., 2007]. Femurs were scanned in 70% ethanol at high resolution, energy level of 55 kVp, intensity of 145 μA and integration time of 200 ms. A total of 100 slices at midshaft and 160 slices at the distal metaphysis were acquired at an isotropic voxel size of 216 μm3 and a slice thickness of 6 μm, and chosen for analysis. Trabecular bone volume fraction and microarchitecture were evaluated starting approximately 1.0 mm proximal from the femoral condyles. Contours were manually drawn every 10 slices a few voxels away from the endocortical boundary to define the region of interest for analysis. The remaining slice contours were iterated automatically. Trabecular regions were assessed for total volume, bone volume, bone volume fraction (bone volume/total volume), trabecular thickness, trabecular number, trabecular separation, connectivity density and structure model index (SMI), using a Gaussian filter (σ = 0.8), and user defined thresholds [Bouxsein et al., 2010; Glatt et al., 2007]. For analysis of femoral cortical bone, contours were iterated across 100 slices along the cortical shell of the femoral mid shaft, excluding the marrow cavity. Analysis of bone volume/total volume, porosity, cortical thickness, total cross sectional and cortical bone area, periosteal perimeter, endosteal perimeter and material density were performed using a Gaussian filter (σ = 0.8, support = 1), and user defined thresholds.
Bone Histomorphometric Analysis
Static and dynamic cancellous bone histomorphometry was carried out on experimental and control mice after they were injected with calcein, 20 mg/kg, and demeclocycline, 50 mg/kg, both intraperitoneally, at an interval of 2 to 5 days, and sacrificed 2 days following demeclocycline injections. Five micron longitudinal sections of undecalcified femurs embedded in methyl methacrylate were cut on a microtome (Microm, Richards-Allan Scientific, Kalamazoo, MI), and stained with 0.1% toluidine blue. Static parameters of bone formation and resorption were measured in a defined area between 360 μm and 2160 μm from the growth plate, using an OsteoMeasure morphometry system (OsteoMetrics, Atlanta, GA). For dynamic histomorphometry, mineralizing surface per bone surface and mineral apposition rate were measured on unstained sections under ultraviolet light, using a triple diamidino-2-phenylindole/fluorescein/Texas red set long pass filter, and bone formation rate was calculated. The terminology and units used for cancellous bone are those recommended by the Histomorphometry Nomenclature Committee of the American Society for Bone and Mineral Research [Dempster et al., 2013; Parfitt et al., 1987].
Osteoblast/Osteocyte-enriched Cultures
Osteoblast/osteocyte-enriched cells were obtained following a modification of a previously described method [Halleux et al., 2012]. Femurs were removed aseptically from 1 month old Dmp1-Cre+/−;RosaNotch/WT and RosaNotch/WT control mice; the surrounding tissues were dissected, the proximal epiphyseal end was excised, and the bone marrow was removed by centrifugation. The distal epiphysis was excised, and femurs were digested for 20 min at 37°C with type II collagenase from Clostridium histolyticum (Worthington Biochemical Corp., Lakewood, NJ) pretreated with N-α-tosyl-L-lysyl-chloromethylketone hydrochloride) (Calbiochem, La Jolla, CA) and subsequently exposed to 5mM EDTA (Life Technologies, Grand Island, NY) for 20 min at 37°C. The resulting terminally differentiated osteoblast/osteocyte-enriched cortical femurs were cultured in DMEM supplemented with non-essential amino acids (both from Life Technologies), 100 μg/ml ascorbic acid (Sigma-Aldrich, St. Louis, MO), and heat-inactivated 10% fetal bovine serum (FBS, Atlanta Biologicals, Inc., Atlanta, GA) for 4 days in a humidified 5% CO2 incubator at 37°C.
Quantitative Reverse Transcription (qRT)-PCR
Total RNA was extracted by chloroform/phenol extraction from homogenized osteoblast/osteocyte-enriched cell cultures and from tibiae of 3 month old mice with the micro RNeasy kit (Qiagen, Valencia, CA), in accordance with manufacturer’s instructions. The integrity of the RNA was assessed by microfluidic electrophoresis on an Experion system (Bio-Rad, Hercules, CA) and mRNA levels were determined by qRT-PCR [Nazarenko et al., 2002a; Nazarenko et al., 2002b]. For this purpose, equal amounts of RNA were reverse-transcribed using iScript RT-PCR kit (Bio-Rad), according to manufacturer’s instructions, and amplified in the presence of specific primers (all from IDT; Table 1B), and iQ SYBR Green Supermix (BioRad), at 60°C for 35 cycles. Transcript copy number was estimated by comparison with a serial dilution of cDNA for Notch1 Nicd (from Thermo Fischer Scientific, Waltham, MA), Hes1 (from American Type Tissue Collection (ATCC), Manassas, VA), Hey1 and Hey2 (both from T. Iso, Los Angeles, CA) and HeyL (from D. Srivastava, Dallas, TX) [Iso et al., 2001a; Nakagawa et al., 1999]. Amplification reactions were conducted in a CFX96 qRT-PCR detection system (BioRad), and fluorescence was monitored during every PCR cycle at the annealing step. Data are expressed as copy number corrected for ribosomal protein L38 (Rpl38) copy number, estimated by comparison with a serial dilution of Rpl38 (from ATCC), and controls normalized to 1 [Kouadjo et al., 2007].
Statistics
Data are expressed as means ± SEM. Statistical differences were determined by unpaired Student’s t-test.
RESULTS
Induction of Notch Target Genes in Osteoblasts/Osteocytes
To explore for differential gene expression in response to Notch activation in mature cells of the osteoblastic lineage, femurs enriched in osteoblasts/osteocytes from Dmp1-Cre+/−;RosaNotch/WT mice, were analyzed for changes in Notch target gene expression. Transcript levels for the Notch1 Nicd and its target genes Hey1, Hey2, HeyL and Hes1 were increased in femurs from Dmp1-Cre+/−;RosaNotch/WT mice compared to controls (Figure 1). Although transcripts for all Notch canonical target genes were increased, Notch1 activation caused a greater induction of HeyL transcripts, suggesting that HeyL could mediate effects of Notch1 in osteoblasts. As an initial step to understand the role of HeyL in skeletal homeostasis, we analyzed the skeletal phenotype of HeyL null mice.
Figure 1.

Notch1 Nicd, Hey1, Hey2, HeyL and Hes1 mRNA levels in osteoblast/osteocyte-rich cell extracts from 1 month old Dmp1-Cre+/−;RosaNotch/WT male mice (black bars) and control RosaNotch/WT littermates (white bars) cultured for 4 days. mRNA levels are expressed as copy number corrected for Rpl38 and controls normalized to 1. Values are means ± SEM; n = 4. *Significantly different from control mice, p < 0.05 by unpaired t-test.
General Characteristics of HeyL Null Mice
Homozygous HeyL null mice were obtained following heterozygous intercrossings and compared to sex-matched littermate controls, all in a C57BL/6J genetic background. Homozygous HeyL null mice did not express HeyL mRNA, appeared normal, were fertile and their weight and femoral length were not different from that of littermate wild type controls (Figure 2).
Figure 2.

HeyL expression, weight and femoral length of HeyL null mice (black bars and dots) and littermate sex-matched controls (white bars, open circles). Total RNA was obtained from tibiae of 3 month old mice and HeyL mRNA levels are shown in A, whereas weight and femoral length were obtained at 1 and 3 months of age and are shown in B. Transcript levels are expressed as HeyL copy number corrected for Rpl38 expression. Values are means ± SEM; n = 4 to 9.
Femoral Microarchitecture
μCT of the distal femur revealed that 1 month old male HeyL null mice had a modest decrease in trabecular bone volume associated with reduced trabecular thickness and higher SMI, indicative of a higher prevalence of rod-like trabeculae (Table 2). The modest cancellous bone osteopenia was transient and 3 month old HeyL null male mice had bone volume/total volume, connectivity and SMI that were not different from values obtained in wild type littermate sex-matched mice (Table2, Figure 3). μCT of the distal femur of female 1 and 3 month old mice revealed no differences in either cancellous or cortical bone between HeyL null mice and littermate female control mice (Table 3, Figure 3).
Table 2.
Femoral microarchitecture assessed by μCT of 1 and 3 month old HeyL null male mice and littermate controls.
| 1 Month | 3 Months | |||
|---|---|---|---|---|
| Control | HeyL null | Control | HeyL null | |
| Distal Femur Trabecular Bone | ||||
| Bone Volume/Total Volume (%) | 6.6 ± 0.7 | 5.1 ± 0.3* | 8.4 ± 1.6 | 8.0 ± 0.5 |
| Trabecular Separation (μm) | 213 ± 8 | 208 ± 6 | 203 ± 10 | 197 ± 5 |
| Trabecular Number (1/mm) | 4.8 ± 0.2 | 4.9 ± 0.1 | 4.9 ± 0.2 | 5.0 ± 0.1 |
| Trabecular Thickness (μm) | 24 ± 1 | 22 ± 1* | 33 ± 2 | 31 ± 1 |
| Connectivity Density (1/mm3) | 379 ± 51 | 288 ± 34 | 240 ± 42 | 260 ± 20 |
| Structure Model Index | 2.5 ± 0.1 | 2.8 ± 0.1* | 2.3 ± 0.2 | 2.4 ± 0.1 |
| Density of Material (mg HA/cm3) | 853 ± 4 | 891 ± 8* | 966 ± 9 | 963 ± 5 |
| Femoral Midshaft Cortical Bone | ||||
| Bone Volume/Total Volume (%) | 89.2 ± 0.3 | 89.3 ± 0.4 | 88.6 ± 0.2 | 89.0 ± 0.3 |
| Porosity (%) | 10.8 ± 0.3 | 10.7 ± 0.4 | 11.4 ± 0.2 | 11.0 ± 0.3 |
| Cortical Thickness (μm) | 93 ± 1 | 94 ± 2 | 150 ± 4 | 152 ± 4 |
| Total Area (mm2) | 1.46 ± 0.08 | 1.53 ± 0.05 | 1.59 ± 0.08 | 1.58 ± 0.05 |
| Bone Area (mm2) | 0.45 ± 0.03 | 0.45 ± 0.02 | 0.73 ± 0.04 | 0.72 ± 0.02 |
| Periosteal Perimeter (mm) | 4.3 ± 0.1 | 4.4 ± 0.1 | 4.5 ± 0.1 | 4.4 ± 0.1 |
| Endocortical Perimeter (mm) | 3.6 ± 0.1 | 3.7 ± 0.1 | 3.3 ± 0.1 | 3.3 ± 0.1 |
| Density of Material (mg HA/cm3) | 935 ± 5 | 937 ± 7 | 1159 ± 4 | 1165 ± 8 |
μCT was performed on distal femurs for trabecular bone and midshaft for cortical bone from 1 and 3 month old male HeyL null mice and control male littermates (Control). Values are means ± SEM; n = 4 to 9.
Significantly different between HeyL null and control, p < 0.05.
Figure 3.
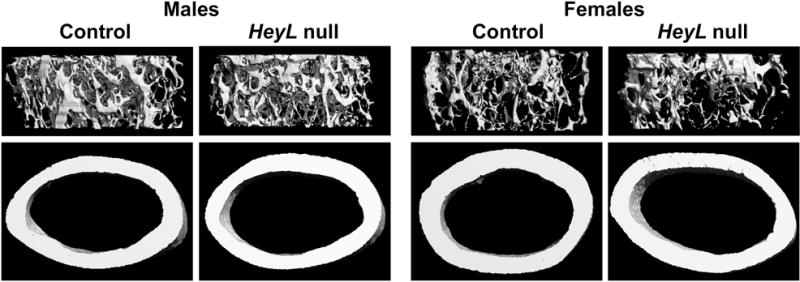
Representative skeletal microarchitecture assessed by μCT of 3 month old male and female HeyL null mice and littermate sex-matched controls.
Table 3.
Femoral microarchitecture assessed by μCT of 1 and 3 month old HeyL null female mice and littermate controls.
| 1 Month | 3 Months | |||
|---|---|---|---|---|
| Control | HeyL null | Control | HeyL null | |
| Distal Femur Trabecular Bone | ||||
| Bone Volume/Total Volume (%) | 3.6 ± 0.4 | 3.6 ± 0.4 | 4.5 ± 0.5 | 4.7 ± 0.7 |
| Trabecular Separation (μm) | 265 ± 16 | 247 ± 14 | 278 ± 11 | 301 ± 10 |
| Trabecular Number (1/mm) | 3.9 ± 0.3 | 4.1 ± 0.2 | 3.6 ± 0.1 | 3.4 ± 0.1 |
| Trabecular Thickness (μm) | 22 ± 1 | 21 ± 1 | 34 ± 0 | 38 ± 2 |
| Connectivity Density (1/mm3) | 148 ± 3 | 98 ± 30 | 98 ± 16 | 89 ± 21 |
| Structure Model Index | 2.9 ± 0.1 | 3.0 ± 0.1 | 3.0 ± 0.1 | 2.9 ± 0.1 |
| Density of Material (mg HA/cm3) | 868 ± 8 | 894 ± 10 | 979 ± 8 | 995 ± 6 |
| Femoral Midshaft Cortical Bone | ||||
| Bone Volume/Total Volume (%) | 88.7 ± 0.2 | 89.0 ± 0.6 | 88.9 ± 0.2 | 88.4 ± 0.3 |
| Porosity (%) | 11.3 ± 0.2 | 11.0 ± 0.6 | 11.1 ± 0.2 | 11.6 ± 0.3 |
| Cortical Thickness (μm) | 90 ± 2 | 93 ± 2 | 156 ± 2 | 151 ± 3 |
| Total Area (mm2) | 1.42 ± 0.10 | 1.47 ± 0.08 | 1.54 ± 0.04 | 1.57 ± 0.03 |
| Bone Area (mm2) | 0.42 ± 0.02 | 0.43 ± 0.02 | 0.73 ± 0.02 | 0.74 ± 0.01 |
| Periosteal Perimeter (mm) | 4.2 ± 0.1 | 4.3 ± 0.1 | 4.4 ± 0.1 | 4.4 ± 0.1 |
| Endocortical Perimeter (mm) | 3.5 ± 0.1 | 3.6 ± 0.1 | 3.1 ± 0.1 | 3.2 ± 0.1 |
| Density of Material (mg HA/cm3) | 921 ±7 | 919 ± 10 | 1188 ± 3 | 1178 ± 7 |
μCT was performed on distal femurs for trabecular bone and midshaft for cortical bone from 1 and 3 month old female HeyL null mice and control female littermates (Control). Values are means ± SEM; n = 4 to 6.
Bone Histomorphometric Analysis
Cancellous bone histomorphometric analysis of femurs from 1 and 3 month old male mice confirmed that the skeleton of HeyL null mice was essentially normal and not different from wild type littermate controls, and HeyL null mice exhibited normal bone volume/tissue volume, osteoblast and osteoclast numbers, and parameters of bone formation and bone resorption (Table 4).
Table 4.
Cancellous bone histomorphometry of 1 and 3 month old HeyL null male mice and littermate controls.
| 1 Month | 3 Months | |||
|---|---|---|---|---|
| Control | HeyL null | Control | HeyL null | |
| Distal Femur Trabecular Bone | ||||
| Bone Volume/Tissue Volume (%) | 7.6 ± 1.6 | 9.6 ± 1.1 | 11.3 ± 2.2 | 9.4 ± 0.2 |
| Trabecular Number (1/mm) | 2.5 ± 0.3 | 3.4 ± 0.2* | 2.9 ± 0.2 | 3.1 ± 0.5 |
| Trabecular Thickness (μm) | 30 ± 3 | 28 ± 2 | 38 ± 5 | 31 ± 1 |
| Osteoblasts/Bone Perimeter (1/mm) | 19.9 ± 3.6 | 20.1 ± 2.3 | 10.1 ± 1.6 | 10.2 ± 1.7 |
| Osteoid Surface/Bone Surface (%) | 1.4 ± 0.2 | 1.2 ± 0.4 | 2.7 ± 0.9 | 1.2 ± 0.2 |
| Osteoclasts/Bone Perimeter (1/mm) | 6.8 ± 0.6 | 6.6 ± 0.5 | 4.9 ± 0.3 | 5.6 ± 0.5 |
| Eroded Surface/Bone Surface (%) | 16.6 ± 1.6 | 17.4 ± 1.2 | 8.9 ± 0.7 | 9.3 ± 0.7 |
| Mineral Apposition Rate (μm/day) | 3.3 ± 0.1 | 3.7 ± 0.4 | 0.9 ± 0.1 | 1.1 ± 0.1 |
| Mineralizing Surface/Bone Surface (%) | 7.8 ± 2.0 | 4.1 ± 0.3 | 3.1 ± 0.6 | 3.0 ± 1.0 |
| Bone Formation Rate (μm3/μm2/day) | 0.26 ± 0.08 | 0.15 ± 0.01 | 0.03 ± 0.01 | 0.03 ± 0.01 |
Bone histomorphometry was performed on distal femurs from 1 and 3 month old male HeyL null mice and control male littermates (Control). Values are means ± SEM; n = 3 to 6.
Significantly different between HeyL null and control, p < 0.05.
Cancellous bone histomorphometry of 3 month old female mice confirmed that HeyL null mice were not different from wild type sex-matched littermates (Table 5).
Table 5.
Cancellous bone histomorphometry of 3 month old HeyL null female mice and littermate controls.
| Control | HeyL null | |
|---|---|---|
| Distal Femur Trabecular Bone | ||
| Bone Volume/Tissue Volume (%) | 3.1 ± 0.7 | 4.1 ± 0.2 |
| Trabecular Number (1/mm) | 1.3 ± 0.3 | 1.6 ± 0.1 |
| Trabecular Thickness (μm) | 23 ± 1 | 25 ± 1 |
| Osteoblasts/Bone Perimeter (1/mm) | 21.9 ± 3.3 | 24.3 ± 0.7 |
| Osteoid Surface/Bone Surface (%) | 1.7 ± 0.9 | 2.8 ± 0.8 |
| Osteoclasts/Bone Perimeter (1/mm) | 7.6 ± 0.8 | 8.0 ± 0.5 |
| Eroded Surface/Bone Surface (%) | 18.1 ± 2.2 | 18.7 ± 1.0 |
| Mineral Apposition Rate (μm/day) | 1.9 ± 0.1 | 2.1 ± 0.2 |
| Mineralizing Surface/Bone Surface (%) | 11.7 ± 3.2 | 7.7 ± 2.2 |
| Bone Formation Rate (μm3/μm2/day) | 0.22 ± 0.06 | 0.15 ± 0.03 |
Bone histomorphometry was performed on distal femurs from 3 month old female HeyL null mice and control female littermates (Control). Values are means ± SEM; n = 3.
DISCUSSION
In the present work, we confirmed Hes1, Hey1, Hey2 and HeyL induction following the activation of Notch1 in preparations enriched in osteoblasts/osteocytes. We demonstrate that even though all these Notch target genes were induced, the greatest response was observed on the expression of HeyL mRNA, suggesting that HeyL could be a mediator of Notch actions in bone. To this end, we explored the general and skeletal phenotypic characteristics of HeyL null mice. Confirming prior observations, the global inactivation of HeyL had no obvious phenotypic impact and mice appeared healthy and of normal weight [Fischer et al., 2007]. In addition, the HeyL inactivation caused only a minimal phenotypic impact in the skeleton.
The skeletal phenotype of HeyL null mice was mild, transient and observed only in 1 month old male mice, indicating that HeyL does not play a significant role in skeletal homeostasis. Global HeyL null mice, particularly when carrying a heterozygous null mutation of Hey1 were reported to have increased bone mass, but we were unable to reproduce these results [Tu et al., 2012]. The reason for the discrepancy in the results between the two studies is not immediately apparent. Since the deletion of one Hey1 allele accentuated the phenotype of HeyL null mice it is possible that Hey1 played a compensatory role preventing the detection of a HeyL null phenotype in the present study. It is of interest that we detected a modest decrease in bone mass instead of the increase reported in the previous study [Tu et al., 2012]. Moreover, the decrease in cancellous bone volume was transient, and observed only in 1 month old male mice, and the skeletal phenotype of adult HeyL null mice was not different from wild type mice. The genetic background of the mice studied in the previous and present report was C57BL/6, so that it should have not influenced the phenotypic manifestations [Tu et al., 2012]. It is of interest that the previous report shows data only for female mice, although this should not explain the differences observed since we did not detect a skeletal phenotype in either sex.
The differences between the skeletal phenotype of HeyL male and female mice were slight, although sexually dimorphic phenotypes have been shown for other members of the Hes and Hey families. For example, Hes1 overexpression under the control of the 3.6 kb fragment of the Col1a1 promoter induces osteoclastogenesis in male mice and suppresses osteoblastogenesis in female mice, confirming the need to report the skeletal consequences of genetic manipulations in animals of both sexes [Canalis et al., 2017; Glatt et al., 2007; Zanotti et al., 2014; Zanotti et al., 2011a].
The absence of an obvious skeletal phenotype in HeyL null mice is likely because of genetic compensation by other members of the Hey family of genes, since Hey1 can compensate for HeyL, and Hey2 can compensate for Hey1 function [Fischer et al., 2004; Fischer et al., 2007]. The reason is because members of the Hey family of proteins can form homodimers as well as heterodimers with other Hes or Hey proteins to bind to DNA consensus sequences [Fischer et al., 2007; Iso et al., 2001b]. Our studies are in line with the modest skeletal phenotype exhibited by Hey1 null mice and by mice harboring a conditional inactivation of Hey2 in cells of the osteoblast lineage [Salie et al., 2010; Zanotti and Canalis, 2013]. This would suggest that each independent member of the Hey family of genes plays only a modest role in skeletal homeostasis. It is conceivable that the simultaneous inactivation of Hey1, 2 and L would obviate genetic compensation and result in a pronounced skeletal phenotype, or one resembling the phenotype caused by the dual deletion of Notch1 and Notch2 or of Presenilin (Psen)1 and Psen2 in skeletal cells [Hilton et al., 2008; Zanotti and Canalis, 2014]. Since canonical Notch signaling induces Hes1, Hey1, Hey2 and HeyL in an indiscriminate fashion, it is not possible to define which of these Notch targets plays a greater role mediating the actions of Notch in a given cellular context. Moreover, the local environment likely plays a role in modifying the actions of Notch and its target genes in a tissue specific manner.
In conclusion, HeyL plays a minimal role in the regulation of skeletal remodeling and is dispensable for skeletal homeostasis.
Acknowledgments
Contract grant name: National Institute of Diabetes and Digestive and Kidney Diseases; Contract grant number: DK045227, Contract grant name: National Institute of Arthritis and Musculoskeletal and Skin Diseases (NIAMS); Contract grant number: AR063049
Footnotes
The authors thank J. Feng for Dmp1-Cre transgenic mice, M. Gessler for HeyL null mice, T. Iso for the Hey1 and Hey2 cDNA, D. Srivastava for HeyL cDNA, Lauren Schilling, Allison Kent and David Bridgewater for technical assistance and Mary Yurczak for secretarial support.
The abbreviations used are: ATCC, American type culture collection; bHLH, basic helix-loop-helix; Col1a1 collagen type I α1; FBS, fetal bovine serum; Hes, Hairy Enhancer of Split; Hey, Hes-related with YRPW motif; HeyL, Hey-like; IDT, integrated DNA technologies; μCT, microcomputed tomography; NICD, Notch intracellular domain; PCR, polymerase chain reaction; Psen, Presenilin, qRT-PCR, quantitative reverse transcription-PCR; Rpl38, ribosomal protein L38; SMI, structure model index.
The authors declare that they have no conflicts of interest with the contents of this article.
The in vivo animal work was conducted while the investigators worked at St Francis Hospital and Medical Center (Hartford, CT) and the analysis of the samples was completed at UConn Health (Farmington, CT).
References
- Bouxsein ML, Boyd SK, Christiansen BA, Guldberg RE, Jepsen KJ, Muller R. Guidelines for assessment of bone microstructure in rodents using micro-computed tomography. J Bone Miner Res. 2010;25:1468–1486. doi: 10.1002/jbmr.141. [DOI] [PubMed] [Google Scholar]
- Buchholz F, Ringrose L, Angrand PO, Rossi F, Stewart AF. Different thermostabilities of FLP and Cre recombinases: implications for applied site-specific recombination. Nucleic Acids Res. 1996;24:4256–4262. doi: 10.1093/nar/24.21.4256. [DOI] [PMC free article] [PubMed] [Google Scholar]
- Canalis E, Adams DJ, Boskey A, Parker K, Kranz L, Zanotti S. Notch Signaling in Osteocytes Differentially Regulates Cancellous and Cortical Bone Remodeling. J Biol Chem. 2013a;288:25614–25625. doi: 10.1074/jbc.M113.470492. [DOI] [PMC free article] [PubMed] [Google Scholar]
- Canalis E, Bridgewater D, Schilling L, Zanotti S. Canonical Notch Activation in Osteocytes Causes Osteopetrosis. Am J Physiol Endocrinol Metab. 2015;310:E171–E182. doi: 10.1152/ajpendo.00395.2015. [DOI] [PMC free article] [PubMed] [Google Scholar]
- Canalis E, Parker K, Feng JQ, Zanotti S. Osteoblast Lineage-specific Effects of Notch Activation in the Skeleton. Endocrinology. 2013b;154:623–634. doi: 10.1210/en.2012-1732. [DOI] [PMC free article] [PubMed] [Google Scholar]
- Canalis E, Schilling L, Yee SP, Lee SK, Zanotti S. Hajdu Cheney Mouse Mutants Exhibit Osteopenia, Increased Osteoclastogenesis and Bone Resorption. J Biol Chem. 2016;291:1538–1551. doi: 10.1074/jbc.M115.685453. [DOI] [PMC free article] [PubMed] [Google Scholar]
- Canalis E, Schilling L, Zanotti S. Effects of Sex and Notch Signaling on the Osteocyte Cell Pool. J Cell Physiol. 2017;232:363–370. doi: 10.1002/jcp.25433. [DOI] [PMC free article] [PubMed] [Google Scholar]
- Dempster DW, Compston JE, Drezner MK, Glorieux FH, Kanis JA, Malluche H, Meunier PJ, Ott SM, Recker RR, Parfitt AM. Standardized nomenclature, symbols, and units for bone histomorphometry: a 2012 update of the report of the ASBMR Histomorphometry Nomenclature Committee. J Bone Miner Res. 2013;28:2–17. doi: 10.1002/jbmr.1805. [DOI] [PMC free article] [PubMed] [Google Scholar]
- Dong Y, Jesse AM, Kohn A, Gunnell LM, Honjo T, Zuscik MJ, O’Keefe RJ, Hilton MJ. RBPjkappa-dependent Notch signaling regulates mesenchymal progenitor cell proliferation and differentiation during skeletal development. Development. 2010;137:1461–1471. doi: 10.1242/dev.042911. [DOI] [PMC free article] [PubMed] [Google Scholar]
- Engin F, Yao Z, Yang T, Zhou G, Bertin T, Jiang MM, Chen Y, Wang L, Zheng H, Sutton RE, Boyce BF, Lee B. Dimorphic effects of Notch signaling in bone homeostasis. Nat Med. 2008;14:299–305. doi: 10.1038/nm1712. [DOI] [PMC free article] [PubMed] [Google Scholar]
- Fischer A, Schumacher N, Maier M, Sendtner M, Gessler M. The Notch target genes Hey1 and Hey2 are required for embryonic vascular development. Genes Dev. 2004;18:901–911. doi: 10.1101/gad.291004. [DOI] [PMC free article] [PubMed] [Google Scholar]
- Fischer A, Steidl C, Wagner TU, Lang E, Jakob PM, Friedl P, Knobeloch KP, Gessler M. Combined loss of Hey1 and HeyL causes congenital heart defects because of impaired epithelial to mesenchymal transition. Circ Res. 2007;100:856–863. doi: 10.1161/01.RES.0000260913.95642.3b. [DOI] [PubMed] [Google Scholar]
- Fortini ME. Notch signaling: the core pathway and its posttranslational regulation. Dev Cell. 2009;16:633–647. doi: 10.1016/j.devcel.2009.03.010. [DOI] [PubMed] [Google Scholar]
- Glatt V, Canalis E, Stadmeyer L, Bouxsein ML. Age-Related Changes in Trabecular Architecture Differ in Female and Male C57BL/6J Mice. J Bone Miner Res. 2007;22:1197–1207. doi: 10.1359/jbmr.070507. [DOI] [PubMed] [Google Scholar]
- Halleux C, Kramer I, Allard C, Kneissel M. Isolation of mouse osteocytes using cell fractionation for gene expression analysis. Methods Mol Biol. 2012;816:55–66. doi: 10.1007/978-1-61779-415-5_5. [DOI] [PubMed] [Google Scholar]
- Hilton MJ, Tu X, Wu X, Bai S, Zhao H, Kobayashi T, Kronenberg HM, Teitelbaum SL, Ross FP, Kopan R, Long F. Notch signaling maintains bone marrow mesenchymal progenitors by suppressing osteoblast differentiation. Nat Med. 2008;14:306–314. doi: 10.1038/nm1716. [DOI] [PMC free article] [PubMed] [Google Scholar]
- Iso T, Kedes L, Hamamori Y. HES and HERP families: multiple effectors of the Notch signaling pathway. J Cell Physiol. 2003;194:237–255. doi: 10.1002/jcp.10208. [DOI] [PubMed] [Google Scholar]
- Iso T, Sartorelli V, Chung G, Shichinohe T, Kedes L, Hamamori Y. HERP, a new primary target of Notch regulated by ligand binding. Mol Cell Biol. 2001a;21:6071–6079. doi: 10.1128/MCB.21.17.6071-6079.2001. [DOI] [PMC free article] [PubMed] [Google Scholar]
- Iso T, Sartorelli V, Poizat C, Iezzi S, Wu HY, Chung G, Kedes L, Hamamori Y. HERP, a novel heterodimer partner of HES/E(spl) in Notch signaling. Mol Cell Biol. 2001b;21:6080–6089. doi: 10.1128/MCB.21.17.6080-6089.2001. [DOI] [PMC free article] [PubMed] [Google Scholar]
- Kageyama R, Ohtsuka T, Kobayashi T. The Hes gene family: repressors and oscillators that orchestrate embryogenesis. Development. 2007;134:1243–1251. doi: 10.1242/dev.000786. [DOI] [PubMed] [Google Scholar]
- Kokubo H, Miyagawa-Tomita S, Nakazawa M, Saga Y, Johnson RL. Mouse hesr1 and hesr2 genes are redundantly required to mediate Notch signaling in the developing cardiovascular system. Dev Biol. 2005;278:301–309. doi: 10.1016/j.ydbio.2004.10.025. [DOI] [PubMed] [Google Scholar]
- Kokubo H, Miyagawa-Tomita S, Tomimatsu H, Nakashima Y, Nakazawa M, Saga Y, Johnson RL. Targeted disruption of hesr2 results in atrioventricular valve anomalies that lead to heart dysfunction. Circ Res. 2004;95:540–547. doi: 10.1161/01.RES.0000141136.85194.f0. [DOI] [PubMed] [Google Scholar]
- Kouadjo KE, Nishida Y, Cadrin-Girard JF, Yoshioka M, St-Amand J. Housekeeping and tissue-specific genes in mouse tissues. BMC Genomics. 2007;8:127. doi: 10.1186/1471-2164-8-127. [DOI] [PMC free article] [PubMed] [Google Scholar]
- Kovall RA. More complicated than it looks: assembly of Notch pathway transcription complexes. Oncogene. 2008;27:5099–5109. doi: 10.1038/onc.2008.223. [DOI] [PubMed] [Google Scholar]
- Lu Y, Xie Y, Zhang S, Dusevich V, Bonewald LF, Feng JQ. DMP1-targeted Cre expression in odontoblasts and osteocytes. J Dent Res. 2007;86:320–325. doi: 10.1177/154405910708600404. [DOI] [PubMed] [Google Scholar]
- Murtaugh LC, Stanger BZ, Kwan KM, Melton DA. Notch signaling controls multiple steps of pancreatic differentiation. Proc Natl Acad Sci U S A. 2003;100:14920–14925. doi: 10.1073/pnas.2436557100. [DOI] [PMC free article] [PubMed] [Google Scholar]
- Nakagawa O, Nakagawa M, Richardson JA, Olson EN, Srivastava D. HRT1, HRT2, and HRT3: a new subclass of bHLH transcription factors marking specific cardiac, somitic, and pharyngeal arch segments. Dev Biol. 1999;216:72–84. doi: 10.1006/dbio.1999.9454. [DOI] [PubMed] [Google Scholar]
- Nam Y, Sliz P, Song L, Aster JC, Blacklow SC. Structural basis for cooperativity in recruitment of MAML coactivators to Notch transcription complexes. Cell. 2006;124:973–983. doi: 10.1016/j.cell.2005.12.037. [DOI] [PubMed] [Google Scholar]
- Nazarenko I, Lowe B, Darfler M, Ikonomi P, Schuster D, Rashtchian A. Multiplex quantitative PCR using self-quenched primers labeled with a single fluorophore. Nucleic Acids Res. 2002a;30:e37. doi: 10.1093/nar/30.9.e37. [DOI] [PMC free article] [PubMed] [Google Scholar]
- Nazarenko I, Pires R, Lowe B, Obaidy M, Rashtchian A. Effect of primary and secondary structure of oligodeoxyribonucleotides on the fluorescent properties of conjugated dyes. Nucleic Acids Res. 2002b;30:2089–2195. doi: 10.1093/nar/30.9.2089. [DOI] [PMC free article] [PubMed] [Google Scholar]
- Parfitt AM, Drezner MK, Glorieux FH, Kanis JA, Malluche H, Meunier PJ, Ott SM, Recker RR. Bone histomorphometry: standardization of nomenclature, symbols, and units. Report of the ASBMR Histomorphometry Nomenclature Committee. J Bone Miner Res. 1987;2:595–610. doi: 10.1002/jbmr.5650020617. [DOI] [PubMed] [Google Scholar]
- Sahlgren C, Lendahl U. Notch signaling and its integration with other signaling mechanisms. Regen Med. 2006;1:195–205. doi: 10.2217/17460751.1.2.195. [DOI] [PubMed] [Google Scholar]
- Salie R, Kneissel M, Vukevic M, Zamurovic N, Kramer I, Evans G, Gerwin N, Mueller M, Kinzel B, Susa M. Ubiquitous overexpression of Hey1 transcription factor leads to osteopenia and chondrocyte hypertrophy in bone. Bone. 2010;46:680–694. doi: 10.1016/j.bone.2009.10.022. [DOI] [PubMed] [Google Scholar]
- Sauer B, Henderson N. Site-specific DNA recombination in mammalian cells by the Cre recombinase of bacteriophage P1. Proc Natl Acad Sci U S A. 1988;85:5166–5170. doi: 10.1073/pnas.85.14.5166. [DOI] [PMC free article] [PubMed] [Google Scholar]
- Schroeter EH, Kisslinger JA, Kopan R. Notch-1 signalling requires ligand-induced proteolytic release of intracellular domain. Nature. 1998;393:382–386. doi: 10.1038/30756. [DOI] [PubMed] [Google Scholar]
- Stanger BZ, Datar R, Murtaugh LC, Melton DA. Direct regulation of intestinal fate by Notch. Proc Natl Acad Sci U S A. 2005;102:12443–12448. doi: 10.1073/pnas.0505690102. [DOI] [PMC free article] [PubMed] [Google Scholar]
- Tao J, Chen S, Yang T, Dawson B, Munivez E, Bertin T, Lee B. Osteosclerosis owing to Notch gain of function is solely Rbpj-dependent. J Bone Miner Res. 2010;25:2175–2183. doi: 10.1002/jbmr.115. [DOI] [PMC free article] [PubMed] [Google Scholar]
- Tu X, Chen J, Lim J, Karner CM, Lee SY, Heisig J, Wiese C, Surendran K, Kopan R, Gessler M, Long F. Physiological notch signaling maintains bone homeostasis via RBPjk and Hey upstream of NFATc1. PLoS Genet. 2012;8:e1002577. doi: 10.1371/journal.pgen.1002577. [DOI] [PMC free article] [PubMed] [Google Scholar]
- Wilson JJ, Kovall RA. Crystal structure of the CSL-Notch-Mastermind ternary complex bound to DNA. Cell. 2006;124:985–996. doi: 10.1016/j.cell.2006.01.035. [DOI] [PubMed] [Google Scholar]
- Xin M, Small EM, van RE, Qi X, Richardson JA, Srivastava D, Nakagawa O, Olson EN. Essential roles of the bHLH transcription factor Hrt2 in repression of atrial gene expression and maintenance of postnatal cardiac function. Proc Natl Acad Sci U S A. 2007;104:7975–7980. doi: 10.1073/pnas.0702447104. [DOI] [PMC free article] [PubMed] [Google Scholar]
- Yorgan T, Vollersen N, Riedel C, Jeschke A, Peters S, Busse B, Amling M, Schinke T. Osteoblast-specific Notch2 inactivation causes increased trabecular bone mass at specific sites of the appendicular skeleton. Bone. 2016;87:136–146. doi: 10.1016/j.bone.2016.04.012. [DOI] [PubMed] [Google Scholar]
- Zanotti S, Canalis E. Notch and the Skeleton. Mol Cell Biol. 2010;30:886–896. doi: 10.1128/MCB.01285-09. [DOI] [PMC free article] [PubMed] [Google Scholar]
- Zanotti S, Canalis E. Hairy and Enhancer of Split-related with YRPW Motif (HEY)2 Regulates Bone Remodeling in Mice. J Biol Chem. 2013;288:21547–21557. doi: 10.1074/jbc.M113.489435. [DOI] [PMC free article] [PubMed] [Google Scholar]
- Zanotti S, Canalis E. Notch1 and Notch2 expression in osteoblast precursors regulates femoral microarchitecture. Bone. 2014;62:22–28. doi: 10.1016/j.bone.2014.01.023. [DOI] [PMC free article] [PubMed] [Google Scholar]
- Zanotti S, Canalis E. Notch Signaling and the Skeleton. Endocr Rev. 2016;37:223–53. doi: 10.1210/er.2016-1002. [DOI] [PMC free article] [PubMed] [Google Scholar]
- Zanotti S, Kalajzic I, Aguila HL, Canalis E. Sex and genetic factors determine osteoblastic differentiation potential of murine bone marrow stromal cells. PLoS One. 2014;9:e86757. doi: 10.1371/journal.pone.0086757. [DOI] [PMC free article] [PubMed] [Google Scholar]
- Zanotti S, Smerdel-Ramoya A, Canalis E. Hairy and enhancer of split (HES)1 is a determinant of bone mass. J Biol Chem. 2011a;286:2648–2657. doi: 10.1074/jbc.M110.183038. [DOI] [PMC free article] [PubMed] [Google Scholar]
- Zanotti S, Smerdel-Ramoya A, Canalis E. Reciprocal regulation of notch and nuclear factor of activated T-cells (NFAT)c1 transactivation in osteoblasts. J Biol Chem. 2011b;286:4576–4588. doi: 10.1074/jbc.M110.161893. [DOI] [PMC free article] [PubMed] [Google Scholar]
- Zanotti S, Smerdel-Ramoya A, Canalis E. Nuclear Factor of Activated T-cells (Nfat)c2 Inhibits Notch Signaling in Osteoblasts. J Biol Chem. 2013;288:624–632. doi: 10.1074/jbc.M112.340455. [DOI] [PMC free article] [PubMed] [Google Scholar]
- Zanotti S, Smerdel-Ramoya A, Stadmeyer L, Durant D, Radtke F, Canalis E. Notch Inhibits Osteoblast Differentiation And Causes Osteopenia. Endocrinology. 2008;149:3890–3899. doi: 10.1210/en.2008-0140. [DOI] [PMC free article] [PubMed] [Google Scholar]