Abstract
Background
Myocardial 18F-deoxyglucose (18F-FDG) uptake has been observed to be enhanced in patients with coronary artery disease (CAD) under fasting conditions. However, whether the increased 18F-FDG is induced by myocardial ischemia and how to discriminate ischemic from physiological 18F-FDG uptake have rarely been investigated.
Methods
Under fasting conditions, 18F-FDG PET imaging was performed in 52 patients with suspected CAD. Two 18F-FDG imaging sessions were conducted within two hours after a single administration of 18F-FDG (dual-time-point imaging), and with an intervention of an exercise test after the first imaging. Abnormal 18F-FDG uptake was determined by the classification of the 18F-FDG distribution pattern, and the changes of the 18F-FDG distribution between the two PET imaging sessions were analyzed. 99mTc-sestamibi was injected at peak exercise and myocardial perfusion imaging (MPI) was conducted after 18F-FDG imaging. Coronary angiography was considered the reference for diagnosing CAD.
Results
Overall, 54.8% (17/31) of CAD patients and 36.2% (21/58) of stenotic coronaries showed exercise-induced abnormal uptake of 18F-FDG. Based on the classification of the 18F-FDG distribution pattern, the sensitivity and specificity of exercise 18F-FDG imaging to diagnose CAD was 80.6% and 95.2% by patient analysis, 56.9% and 98.0% by vascular analysis, respectively. Compared with MPI, 18F-FDG imaging had a tendency to have higher sensitivity (80.6% vs 64.5%, P = 0.06) on the patient level.
Conclusion
Myocardial ischemia can induce 18F-FDG uptake. With the classification of the 18F-FDG distribution pattern, dual-time-point 18F-FDG imaging under fasting conditions is efficient in diagnosing CAD.
Keywords: Dual-time-point imaging, 18F-FDG, Coronary artery disease, Myocardial ischemia
Background
Glucose uptake in normal myocardium is suppressed under fasting conditions, nevertheless myocardial ischemia results in a dramatic switch of metabolic substrate to glucose uptake. Hence, the ischemic and normal myocardium have significant difference in glucose uptake [1, 2]. Therefore, myocardial 18F-deoxyglucose (18F-FDG) imaging under fasting conditions is in theory a potential method to detect myocardial ischemia. Previous studies have observed enhanced 18F-FDG uptake in myocardium supplied by stenotic coronaries or in myocardium with perfusion abnormalities [3–11]. However, whether the enhanced 18F-FDG uptake is induced by myocardial ischemia is controversial [12], since non-ischemic myocardium can also exhibit varying extents of 18F-FDG uptake even under strict dietary control [13–15]. In the present study, we performed dual-time-point imaging within two hours after a single administration of 18F-FDG, and myocardial ischemia was induced using an exercise test after the first imaging. We speculated that most factors that presumably affect myocardial 18F-FDG uptake would not significantly change in such a short time, and thus we could evaluate whether exercise-induced myocardial ischemia would induce myocardial 18F-FDG uptake.
Moreover, even if myocardial ischemia can induce 18F-FDG uptake, another issue that comes along is how to differentiate the ischemic uptake from the uptake in non-ischemic myocardium, which was considered physiological. Several studies have investigated the distribution pattern of 18F-FDG in patients without heart disease [11, 16, 17]. These studies found that most individuals had no obvious 18F-FDG uptake, or had diffuse but homogenous uptake. Contrarily, ‘focal’ or ‘focal on diffuse’ uptake was rarely observed. Even if some patients showed focal uptake, the uptake was usually located on the basal segments, including the papillary muscle. We had adopted these classification methods to differentiate ischemic from physiological uptake in patients with suspected unstable angina who underwent resting 18F-FDG imaging, and obtained favorable diagnostic results [11]. In this study, we evaluated the diagnostic performance of 18F-FDG imaging in patients with suspected CAD using the classification of 18F-FDG distribution pattern.
Methods
Study population
This prospective study was approved by the Institutional Ethics Committee of Fuwai Hospital, and written consent was obtained from all patients before study entry. Fifty-five patients with suspected stable angina (37 patients) or unstable angina (18 patients) were recruited. Patients with suspected unstable angina were simultaneously included in the other study aiming at investigating the value of 18F-FDG imaging in the diagnosis of unstable angina [11]. Angina was well controlled in all patients and no new onset of angina occurred for > 40 h before the entry to the present study. Patients with the following conditions were not recruited: prior myocardial infarction (history of previously documented myocardial infarction or Q waves on electrocardiogram), acute myocardial infarction, unable to exercise, prior coronary revascularization of less than 3 months, left bundle branch block, diagnosed valvular heart disease, or idiopathic cardiomyopathy.
Study protocol
Figure 1 shows the flow diagram of the study protocol. Enrolled subjects were asked to have an overnight fast (>12 h). The imaging studies were arranged in the morning, and anti-angina medications were withheld for > 12 h before exercise testing. Patients first had their blood glucose levels measured using finger blood samples, and then were intravenously injected with 18F-FDG (5–8 mCi) at rest. Thereafter, patients underwent two separate PET imaging sessions with a single dose of 18F-FDG. This imaging protocol was named as dual-time-point imaging. Briefly, patients underwent the first 18F-FDG imaging (rest) using PET/CT one hour after 18F-FDG injection. After the first imaging session, they immediately underwent a symptom-limited exercise test using a bicycle ergometer with continuous electrocardiogram (ECG) and blood pressure monitoring. 99mTc-sestamibi (20–25 mCi) was intravenously injected at peak exercise. Approximately two hours after 18F-FDG injection, the second 18F-FDG imaging (exercise) was performed.
Fig. 1.

Schematic of imaging protocols
Exercise 99mTc-sestamibi myocardial perfusion imaging (MPI) was done after the second 18F-FDG imaging using SPECT. Resting MPI was completed within 3 days of exercise imaging.
Image acquisition and reconstruction
18F-FDG images were acquired, using a Biograph 64 PET/CT scanner (Siemens Medical Solutions, Knoxville, TN, USA) equipped with high-performance LSO PET crystals and a 64-slice CT. After a scout CT acquisition (120 kV, 10 mA), used for appropriate patient positioning, a CT transmission scan (140 kV, 35 mA) was performed for attenuation correction and anatomical localization. PET images were then acquired in list mode with a static 10-min frame. Raw images of 18F-FDG were reconstructed by iterative ordered subset expectation maximization (OSEM) reconstructions (8 subsets, 4 iterations) and automatically corrected for photon attenuation using the CT scans.
Exercise 99mTc-sestamibi images were obtained as previously described using a dual-head, large-field-of-view SPECT (Infinia; GE Healthcare, Milwaukee, Wisconsin, USA), equipped with ultra-high-energy parallel-hole collimators [9, 11]. Resting 99mTc-sestamibi images were obtained using the same SPECT with ultra-high-energy parallel-hole collimators or low-energy high-resolution parallel-hole collimators. Thirty projection images were acquired over a 180° arc at 6° intervals. Perfusion images were reconstructed using standard filtered back projection.
Image analysis
18F-FDG and 99mTc-sestamibi images were analyzed separately. Two experienced nuclear physicians interpreted the images independently, and disagreements were resolved by consensus.
18F-FDG
18F-FDG images were first semi-quantitatively analyzed using standard uptake value (SUV). The left ventricle was divided into 17 segments using the standard American Heart Association model, and each segment was further assigned to three major coronary territories. The maximal SUV of each segment (SUVmyo) was manually measured guided by CT and fusion images. The SUV of each coronary was represented by the highest segmental SUVmyo within its territory. Furthermore, a ROI of 3.0 cm3 was placed over the LV chamber near the mitral valve plane to measure the SUVblood. Each pair of ROIs on the rest and exercise images was carefully placed on the same region.
Thereafter, the myocardial18F-FDG uptake of left ventricle as a whole was classified into four patterns, based on the results of semi-quantitative analysis as well as visual observation [11, 16, 17]: the ‘none’ pattern, indicated the SUVmyo in all segments was below or equal to the SUVblood; the ‘diffuse’ pattern, indicated the SUVmyo in all segments was higher than the SUVblood, nonetheless no significant difference existed among them (i.e., homogenous uptake); the ‘focal’ pattern, indicated that at least one segment had a SUVmyo higher than the SUVblood and the SUVmyo in other segments was below or equal to the SUVblood; and the ‘focal on diffuse’ pattern, indicated the SUVmyo in all segments was higher than the SUVblood, and even higher uptake was identified in one or more segments. Finally, focal uptake in the ‘focal’ or ‘focal on diffuse’ pattern was defined as abnormal, except those on the basal segments and papillary muscle, which were considered normal [18]. Moreover, the changes of 18F-FDG distribution pattern between exercise and resting images were analyzed.
99mTc-sestamibi
99mTc-sestamibi images were scored using the same 17-segment model, but with a 5-score scale (0 = normal uptake, 1 = mild, 2 = moderate and 3 = severe reduction in uptake, and 4 = no uptake). Exercise–rest perfusion defects were classified as fixed, reversible, or partially reversible. Abnormal 99mTc-sestamibi uptake was further assigned to three major coronary territories.
Coronary angiography
Coronary angiography within 3 months of scintigraphic imaging was analyzed. Angiographic results were reviewed for the presence, localization, and severity of coronary artery lesions. Luminal diameter narrowing of ≥ 50% in any of the major epicardial coronary arteries was considered significant and was defined as CAD.
Statistical analysis
Statistical analyses were performed using SPSS software (version 17.0, SPSS, Inc, Chicago, IL, USA). Continuous variables were described as means and standard deviations (SD) or medians and interquartile ranges, depending on the normality of distribution assessed using the Kolmogorov-Smirnoff test. Categorical variables were described as numbers and percentage. Paired t test or Wilcoxon rank test was used to compared the differences of SUVs between resting and exercise 18F−FDG imaging, depending on the normality of the distribution. McNemar’s test was used to compare the differences of the diagnostic performance between perfusion and 18F−FDG imaging, and to compare the differences of the prevalence rate of 18F-FDG abnormalities between resting and exercise imaging. The variables that potentially influenced the diagnostic sensitivity of 18F-FDG imaging, were analyzed using χ2 test. A P value of < 0.05 was considered statistically significant.
Results
Patient characteristics
Of 55 patients initially recruited, 3 cases without coronary angiography were excluded from the final analysis. The demographic, angiographic, and exercise testing data of the remaining 52 patients are listed in Table 1. Of them, 54% were men and the average age was 58 ± 8 years. Ten subjects (19%) had a history of percutaneous coronary intervention (>3 months). Coronary angiography showed significant coronary stenosis in 58 coronaries of 31 patients. Of them, 1-, 2- and 3-vessel disease was 42%, 29%, and 29%, respectively. The mean exercise time was 461 ± 169 s, and the rate-pressure product increased from (7.9 ± 1.9) x 103 at baseline to (22.0 ± 6.5) x 103 at peak exercise. During exercise, 32% of the patients had chest pain and 48% of the patients had ischemic ECG changes.
Table 1.
Patient characteristics
| Characteristics | Results |
|---|---|
| Age (years) | 58 ± 8 |
| Male (%) | 28 (54) |
| Diabetes mellitus (%) | 22 (42) |
| Hypertension (%) | 38 (73) |
| Hypercholesterolemia (%) | 32 (62) |
| Smoker (%) | 21 (40) |
| Family history of CAD | 7 (14) |
| Previous PCI (%) | 10 (19) |
| Blood glucose (mmol/L) | 6.7 ± 1.5 |
| Coronary angiography (%) | |
| One-vessel disease | 13 (42) |
| Two-vessel disease | 9 (29) |
| Three-vessel disease | 9 (29) |
| Exercise test | |
| Exercise time (s) | 461 ± 169 |
| Baseline RPP | 7900 ± 1900 |
| Peak RPP | 22000 ± 6500 |
| Chest pain (%) | 17 (32) |
| Positive ECG results (%) | 25 (48) |
CAD coronary artery disease, PCI percutaneous coronary intervention; and RPP, rate pressure product
Myocardial perfusion imaging
In total, 20 CAD patients had perfusion abnormalities. Of them, 6 patients had partially reversible perfusion defects, and 14 had reversible perfusion defects. No patients without CAD showed perfusion abnormality. Therefore, the sensitivity and specificity of exercise MPI in the diagnosis of CAD was 64.5% and 100%, respectively. By vascular analysis, the sensitivity and specificity was 53.4% and 99.0%, respectively (Table 2).
Table 2.
Diagnostic performance of exercise perfusion and 18F-FDG imaging
| Patient analysis | Vascular analysis | |||
|---|---|---|---|---|
| Sensitivity | Specificity | Sensitivity | Specificity | |
| 99mTc-sestamibi | 64.5% (20/31) | 100% (21/21) | 53.4% (31/58) | 99.0% (97/98) |
| 18F-FDG | 80.6% (25/31) | 95.2% (20/21) | 56.9% (33/58) | 98.0% (96/98) |
| P value | 0.06 | 1.00 | 0.79 | 1.00 |
18F-FDG imaging
Changes of 18F-FDG uptake on dual-time-point imaging
By semi-quantitative analysis, all coronary territories with abnormal 18F-FDG uptake showed an increase in SUVmyo on exercise imaging, and that was only 44.6% in coronaries with normal 18F-FDG uptake (Fig. 2a-c). Meanwhile, the SUVblood was decreased on exercise imaging in all patients (Fig. 2d-f). Consequently, the SUVmyo/SUVblood consistently increased from rest to exercise 18F-FDG imaging in all coronaries, nevertheless, coronaries with abnormal 18F-FDG uptake had a higher increment (Fig. 2g-i).
Fig. 2.
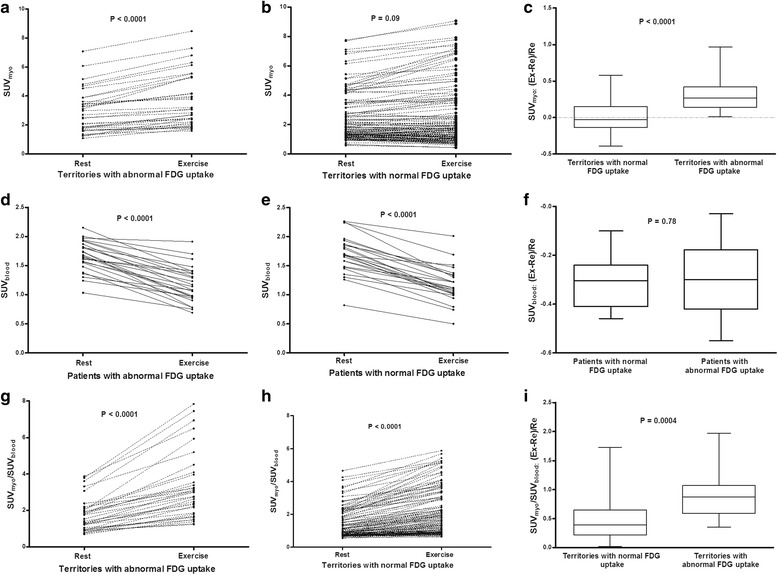
SUV changes of 18F-FDG uptake on dual-time-point imaging. All coronary territories with abnormal 18F-FDG uptake show an increase in SUVmyo on exercise imaging (a). Contrarily, only 44.6% of coronaries with normal 18F-FDG uptake show increased uptake (b). Therefore, the increment in territories with abnormal 18F-FDG uptake is significant higher than that in normal territories (c). The SUVblood consistently decreases from rest to exercise imaging in patients with abnormal (d) and normal 18F-FDG uptake (e), and the reduction is similar between the two groups (f). As a result, although both abnormal and normal territories show an increase in SUVmyo/SUVblood (g, h), the increment is higher in territories with abnormal 18F-FDG uptake (i)
By qualitative analysis, 10 CAD patients had abnormal 18F-FDG uptake on exercise imaging but normal uptake on resting imaging (Fig. 3a-b, Figs. 4 and 5). Fifteen patients had abnormal uptake on both imaging, but 7 of them had more myocardial segments involved on the exercise imaging (Fig. 6). Of the stenotic coronaries, 12 showed abnormal 18F-FDG uptake exclusively on exercise imaging. Twenty-one stenotic coronaries showed abnormal uptake on both imaging, but 9 of them had more myocardial segments involved on the exercise imaging (Fig. 3c-d). In sum, 54.8% (17/31) of CAD patients and 36.2% (21/58) of stenotic coronaries exhibited exercise-induced 18F-FDG changes.
Fig. 3.
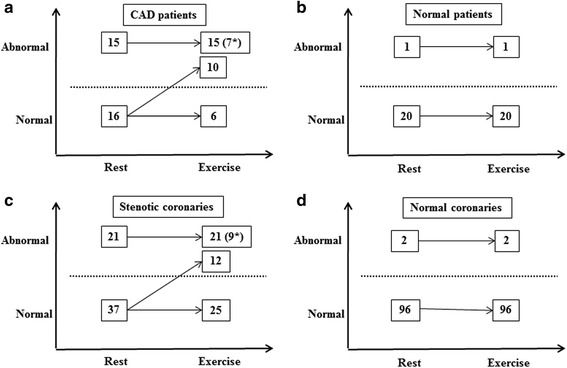
Changes of 18F-FDG distribution characteristics between resting and exercise imaging. By patientanalysis, the prevalence rate of 18F-FDGabnormalities increases from 48.4% (15/31) on resting imaging to80.6% (25/31) (P = 0.004) on exercise imaging in CAD patient (a) nevertheless it does not significantly change in patients without CAD [4.8% (1/21) vs 4.8% (1/21) P = NS] (b) By vascular analysis, the prevalence rate of 18F-FDG abnormalities on exercise imaging is significantly higher than that on resting imaging in stenotic coronaries [56.9% (33/58) vs 34.5% (21/58), P < 0.0001] (c) but not in normal coronaries [2.0% (2/98) vs 2.0% (2/98), P = NS] (d). (*)Indicates the increased 18 F-FDG uptake is exclusively located on the basal segments or papillary muscle
Fig. 4.
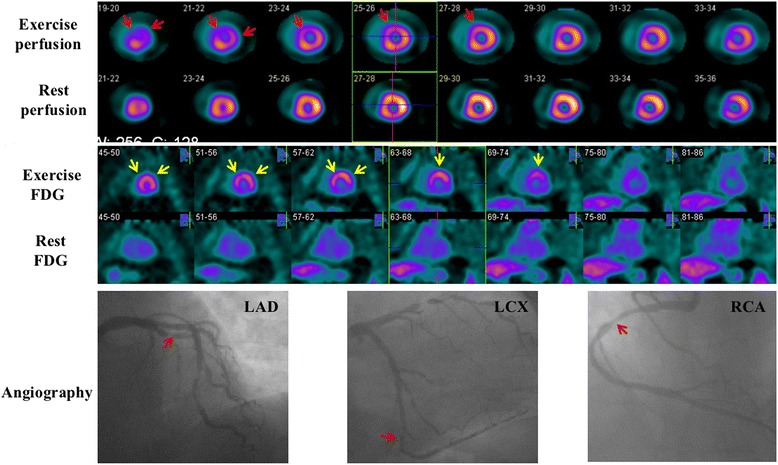
Images of a 61-year-old woman. She had a 99% stenosis in the left anterior descending coronary (LAD), a 90% stenosis in the left circumflex coronary (LCX), and a 70% stenosis in the right coronary artery (RCA). Perfusion images show reversible defects in the anterior and lateral wall (red arrows). Resting 18F-FDG images indicate only background uptake in the cardiac cavities and no visible uptake in the left ventricular wall (‘none’ pattern). Nevertheless, exercise 18F-FDG images exhibit intense uptake in the anterior and lateral wall (‘focal’ pattern, yellow arrows) which is in accordance with exercise perfusion images
Fig. 5.
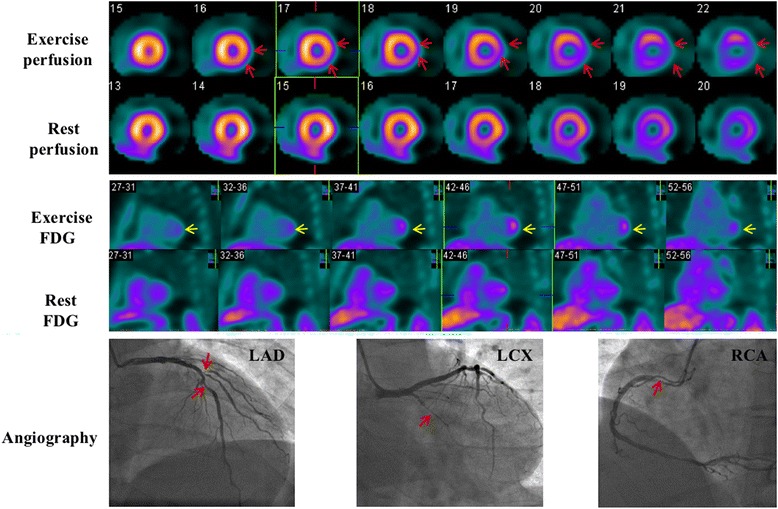
Images of a 39-year-old man. He had a 70% stenosis in the LAD and a 90% stenosis in the diagonal branch, a 100% stenosis in the LCX, and a 90% stenosis in the proximal RCA. Perfusion images show reversible defects in the lateral wall (red arrows). Resting 18F-FDG images indicate background uptake in the cardiac cavities and no visible uptake in the left ventricular wall (‘none’ pattern), exercise 18F-FDG images exhibit intense uptake in the lateral wall (‘focal’ pattern, yellow arrows) which is in accordance with exercise perfusion images
Fig. 6.
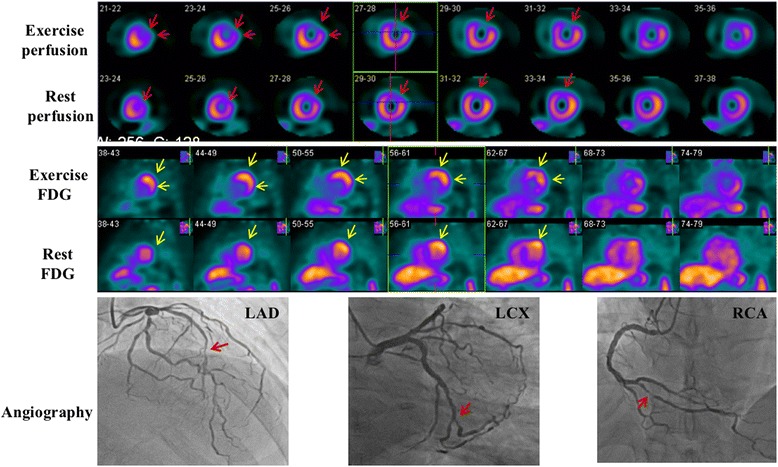
Images of a 55-year-old woman. She had multiple lesions of > 90% stenosis in the LAD, multiple lesions of 60-80% stenosis in the LCX, and a distal lesion of 90% stenosis in the RCA. Perfusion images show partially reversible defects in the anterior and anterolateral wall (‘focal’ pattern, red arrows). Resting 18F-FDG images show mild uptake in the anterior and anterolateral wall. On exercise images, 18F-FDG uptake is further increased compared with resting images, and the involved area is enlarged as well (‘focal’ pattern, yellow arrows)
Diagnostic performance of 18F-FDG imaging
By patient analysis, abnormal 18F-FDG uptake was present on exercise imaging in 26 patients (25 with CAD and 1 without CAD). The sensitivity and specificity of exercise 18F-FDG imaging in the diagnosis of CAD was 80.6% (25/31) and 95.2% (20/21) (Table 2), respectively. Compared with MPI, 18F-FDG imaging had a tendency to have higher sensitivity (80.6% vs 64.5%, P = 0.06), but similar specificity (95.2% vs 100%, P = 1.00).
By vascular analysis, abnormal 18F-FDG uptake was present on exercise imaging in 35 coronary territories (33 with and 2 without significant stenosis). The sensitivity and specificity of exercise 18F-FDG imaging in the detection of stenotic coronaries were 56.9% (33/58) and 98.0% (96/98) (Table 2), respectively. Both the sensitivity and specificity of exercise 18F-FDG imaging were not significantly different from that of MPI (sensitivity: 56.9% vs 53.4%, P = 0.79; specificity: 98.0% vs 99.0%, P = 1.00).
Variables related to the diagnostic performance of 18F-FDG imaging
The sensitivity of single-vessel and multi-vessel disease was comparable at both patient level (69.2% vs 94.1%, P = 0.14) and individual vessel level (69.2% vs 57.8%, P = 0.46) (Fig. 7a).
Fig. 7.
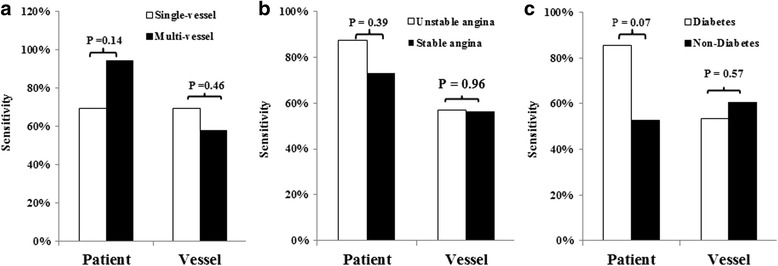
Variables influence the diagnostic sensitivity of 18F-FDG imaging. The sensitivity of single-vessel and multivessel disease was comparable at both patient level and individual vessel level (a) The difference of sensitivity is not significant between stable and unstable angina (b) and is borderline on the patient level but not on the vascular level between diabetic and non-diabetic patients (c)
The sensitivity was not significantly different between patients with suspected stable angina and unstable angina both on patient and vascular level (Fig. 7b).
Diabetic patients had higher blood glucose than non-diabetes (7.6 ± 0.3 mmol/l vs 5.9 ± 0.1 mmol/l, P < 0.0001). Compared with normal subjects, diabetic patients had similar SUVblood (1.66 ± 0.20 vs 1.70 ± 0.35, P = 0.59), but lower SUVmyo (1.62 ± 0.97 vs 2.78 ± 1.78, P = 0.0027) and SUVmyo/SUVblood (1.19 ± 0.72 vs 1.99 ± 1.28, P = 0.0032) on resting imaging. 18F-FDG imaging had a trend to have higher sensitivity for diabetic patients on the patient level (P = 0.07, Fig. 7c) but not on the vascular level (P = 0.57) (Fig. 7c).
Discussion
By the direct comparison of the images obtained before and after an exercise test within two hours, the present study demonstrated a significant change of 18F-FDG uptake in CAD patients and stenotic coronaries. Previous studies have reported enhanced 18F-FDG uptake in patients with CAD under fasting conditions [3–11]. However, myocardial 18F-FDG uptake is spatially heterogeneous even under strict dietary control [13–15]. Patients without documented CAD can also have regional or global myocardial uptake, which is known as ‘non-specific’ or ‘physiological’. Physiological uptake is mostly localized on, but not confined to, the basal segments. Therefore, regional 18F-FDG uptake, even in the territory supplied by the stenotic coronary, may only be physiological. As a result, although 18F-FDG imaging had a relatively high sensitivity in the diagnosis of CAD, its specificity was rarely investigated and presumably poor [10]. To clarify the specificity of 18F-FDG imaging, we had conducted exercise and resting 18F-FDG imaging in CAD patients during two sequential days [9]. Resting imaging was 24 h after exercise imaging. We speculated that the ischemic uptake of 18F-FDG on exercise imaging should decrease or disappear on resting imaging. In that study, 87% of the patients with increased 18F-FDG uptake on exercise imaging showed decreased or no discernible uptake on resting imaging, which in part supported that 18F-FDG uptake was a specific marker for myocardial ischemia. The other 13% patients had persistent uptake which was interpreted as ischemic memory. However, several studies have found that normal myocardium could also show a significant change in 18F-FDG uptake among serial examinations [14, 15], which was considered as temporal heterogeneity. A number of known factors (hormones, dietary preparation, exercise, etc.) and unknown factors might influence myocardial 18F-FDG uptake, and it was difficult to modulate these conditions to the same level on different days. Contrary to the prior studies [14, 15], the two 18F-FDG imaging sessions in this study were performed within a very short interval of two hours, and only with a single administration of 18F-FDG. This could, to the greatest extent, alleviate the differences of the aforementioned factors between exercise and resting imaging. Catecholamines released during exercise stress suppress exogenous glucose metabolism in normal myocardium but do not alter anaerobic glucose metabolism in ischemic myocardium [12, 19], but no study has reported that that effect was spatially heterogeneous. Hence, the regionally increased uptake on exercise imaging in CAD patients was most likely induced by myocardial ischemia. The significance of the present study was, for the first time, providing unequivocal evidence in support of that myocardial ischemia can induce 18F-FDG uptake.
On the exercise imaging, the 18F-FDG uptake in ischemic myocardium was consistently increased. Contrarily, non-ischemic myocardium showed variable changes of 18F-FDG uptake and nearly half of them had decreased uptake. Moreover, the SUVblood consistently decreased on the exercise imaging both in CAD and normal patients. Therefore, the 18F-FDG distribution changes between resting and exercise imaging was due to the increased uptake ratio of ischemic to non-ischemic myocardium as well as the myocardium to background radioactivity.
Of note, some patients showed ischemic 18F-FDG uptake on resting and nearly half (7/15) of them had more segments involved on exercise imaging. Abnormal 18F-FDG uptake at rest may be induced by resting ischemia since 6 patients had perfusion abnormalities at rest in this study. Moreover, patients with unstable angina may have abnormal 18F-FDG uptake at rest due to ischemic memory, even without perfusion abnormalities, which had been validated in prior studies [11, 20].
To determine the abnormality of 18F-FDG uptake, we adopted the classification of 18F-FDG distribution patterns and defined the uptake of basal segments and papillary muscle as normal, as recommended recently for the ‘hot’ spot imaging for the heart [18]. This study demonstrated this strategy was efficient for the detection of CAD. Overall, the diagnostic performance was comparable between 18F-FDG imaging and MPI. Especially, a favorable specificity was obtained on both patient and vascular levels. In this study, all patients with perfusion abnormalities showed abnormal 18F-FDG uptake on exercise imaging. Furthermore, 45.5% (5/11) of CAD patients with normal perfusion were detected by 18F-FDG imaging as well. This implied that 18F-FDG imaging may be more sensitive than MPI. It is important to note, the difference of the sensitivity between 18F-FDG imaging and MPI was merely borderline (P = 0.06) on the patient level. In contrast, previous studies have reported higher sensitivity of 18F-FDG imaging over MPI [7, 10]. There were two major differences between the present and prior studies. First, 18F-FDG was administered at peak exercise in previous studies. Contrarily, 18F-FDG was injected one hour prior to exercise in the present study. Due to the extraction by myocardium and other tissues, and clearance from urinary and digestive system, 18F-FDG in blood at the onset of exercise-induced ischemia was decreased. In addition, if physiological uptake of myocardium prior to exercise was too intense, new ischemic uptake might be masked. Second, only focally increased 18F-FDG uptake was defined as abnormal in this study, whereas diffuse but homogeneous uptake and basal (including papillary muscle) uptake were also considered abnormal in prior studies [3–11]. The current definitions inevitably decreased the sensitivity, but rendered an improved specificity. Recent studies have demonstrated that most individuals without heart disease showed a ‘none’ or ‘diffuse’ pattern, ‘focal’ or ‘focal on diffuse’ uptake was mostly observed in unstable angina [11, 16]. These findings suggested that the pattern, rather than the extent, of 18F-FDG uptake, is an indicator of myocardial involvement under fasting conditions. Therefore, we adopted these classifications in the present study. For the same reason, we did not consider quantitative evaluation of 18F-FDG uptake as the diagnostic criteria.
The secretion of insulin is impaired and/or there is insulin resistance for diabetic patients. Therefore, the utilization of glucose is decreased in these subjects. However, recent studies have proposed that ischemia and insulin would trigger independent pathways of the translocation of glucose transporters (GLUTs) in the myocardium, to increase glucose transport to the myocyte: ischemia leads to GLUT-4 translocation via a phosphatidylinositol 3-kinase (PI3-kinase)-independent mechanism, and insulin via a PI3-kinase-mediated pathway [21, 22]. These differential regulations of GLUT-4 translocation suggest that even in diabetic patients who have myocardial insulin resistance, would have increased glucose uptake when triggered by ischemic events. Moreover, due to the lower 18FDG uptake in non-ischemic myocardium demonstrated in this study, 18FDG myocardial ischemic imaging may have a higher specificity in diabetic patients than that in non-diabetic patients.
There are some limitations in this study. This study included a subgroup of patients with suspected unstable angina, who had a higher incidence and more severity of perfusion abnormalities on both resting and exercise imaging. This may result in the overestimation of the sensitivity of 18F-FDG imaging. However, we did not yet find significant differences in the diagnostic performance between stable and unstable angina (Fig. 7b). 18F-FDG was only injected once and one hour prior to the exercise test in this study. This may, as discussed above, lower the sensitivity of 18F-FDG imaging. Whether split dose (i.e., the 18F-FDG was divided into 2 parts, and was administered separately at rest and exercise testing) or one injection after exercise followed by two imaging session, can improve the sensitivity needs to be further studied. We only examined the glucose level at the baseline and no other hormones were checked. The difference of these hormones between resting and exercise imaging, and their effects on the myocardial uptake of 18F-FDG, could not be evaluated. Exercise perfusion images were acquired using SPECT equipped with ultra-high-energy collimators, which might have underestimated the sensitivity of MPI compared using SPECT equipped with low-energy collimators. Moreover, down-scatter of 18F to the 99mTc window might bring quantitation error. The ratio of 99mTc to 18F was more than 4–5 : 1 in this study, and the contribution of 18F was estimated to be less than 5% of the total counts in the 99mTc window [23]. In addition to fasting, several other strategies have recently been developed to suppress the physiological uptake of 18F-FDG in myocardium [24]. However, the application of these interventions in ischemic 18F-FDG imaging was scarce and required further investigation [10]. Hence, we did not integrate them into our study protocol. We didn’t integrate functional evaluation of wall motion into the study protocol, hence we couldn’t correlate the metabolic abnormality with myocardial hypokinesis. Therefore, we couldn’t decide in which patient myocardial stunning was the underlying mechanism of metabolic abnormality. Finally, since this was a small and exploratory study, larger studies are necessary.
Conclusion
The present study demonstrated that myocardial ischemia can induce 18F-FDG uptake, and support the potential use of fasting 18F-FDG imaging in detecting myocardial ischemia. As no satisfactory methods can completely suppress physiological uptake in non-ischemic myocardium so far, classification of the 18F-FDG distribution pattern is an effective alternative in differentiating abnormal 18F-FDG uptake.
Acknowledgments
Funding
This work was supported by the Beijing Municipal Science and Technology Commission (Z131107002213182), the Capital Health Research and Development of Special (SF2014-2-4033), and the National Natural Science Foundation of China (30970852, 81471694).
Availability of data and materials
Data sharing is not applicable to this article as no datasets were generated during the current study.
Authors’ contributions
Study design: MY and KD. Data collection: XG, BX and YL. Data analysis: MY, ZH and KD. Manuscript writing: MY and KD. All authors read and approved the final manuscript.
Competing interests
The authors declare that they have no competing interests.
Consent for publication
Not applicable.
Ethics approval and consent to participate
This prospective study was approved by the Institutional Ethics Committee of Fuwai Hospital, and written consent was obtained from all patients before study entry.
Publisher’s Note
Springer Nature remains neutral with regard to jurisdictional claims in published maps and institutional affiliations.
Contributor Information
Ke-Fei Dou, Email: drdoukefei@126.com.
Xiao-Jin Gao, Email: sophie_gao@sina.com.
Bo-Qia Xie, Email: xiaoqiaqiaisme@163.com.
Yan Li, Email: 18810488835@163.com.
Zuo-Xiang He, Email: zuoxianghe@hotmail.com.
Min-Fu Yang, Phone: +86-10-85231356, Email: minfuyang@126.com.
References
- 1.Schwaiger M, Neese RA, Araujo L, Wyns W, Wisneski JA, Sochor H, et al. Sustained nonoxidative glucose utilization and depletion of glycogen in reperfused canine myocardium. J Am Coll Cardiol. 1989;13:745–754. doi: 10.1016/0735-1097(89)90621-9. [DOI] [PubMed] [Google Scholar]
- 2.McNulty PH, Sinusas AJ, Shi CQ, Dione D, Young LH, Cline GC, et al. Glucose metabolism distal to a critical coronary stenosis in a canine model of low-flow myocardial ischemia. J Clin Invest. 1996;98:62–69. doi: 10.1172/JCI118778. [DOI] [PMC free article] [PubMed] [Google Scholar]
- 3.Schelbert HR, Henze E, Phelps ME, Kuhl DE. Assessment of regional myocardial ischemia by positron-emission computed tomography. Am Heart J. 1982;103:588–597. doi: 10.1016/0002-8703(82)90462-8. [DOI] [PubMed] [Google Scholar]
- 4.Camici P, Araujo LI, Spinks T, Lammertsma AA, Kaski JC, Shea MJ, et al. Increased uptake of 18F-fluorodeoxyglucose in postischemic myocardium of patients with exercise-induced angina. Circulation. 1986;74:81–88. doi: 10.1161/01.CIR.74.1.81. [DOI] [PubMed] [Google Scholar]
- 5.Abramson BL, Ruddy TD, de Kemp RA, Laramee LA, Marquis JF, Beanlands RS. Stress perfusion/metabolic imaging: a pilot study for a potential new approach to the diagnosis of coronary artery disease in women. J Nucl Cardiol. 2000;7:205–212. doi: 10.1016/S1071-3581(00)70008-0. [DOI] [PubMed] [Google Scholar]
- 6.Araujo LI, McFalls EO, Lammertsma AA, Jones T, Maseri A. Dipyridamole-induced increased glucose uptake in patients with single-vessel coronary artery disease assessed with PET. J Nucl Cardiol. 2001;8:339–346. doi: 10.1067/mnc.2001.113615. [DOI] [PubMed] [Google Scholar]
- 7.He ZX, Shi RF, Wu YJ, Tian YQ, Liu XJ, Wang SW, et al. Direct imaging of exercise-induced myocardial ischemia with fluorine-18-labeled deoxyglucose and Tc-99 m-sestamibi in coronary artery disease. Circulation. 2003;108:1208–1213. doi: 10.1161/01.CIR.0000088784.25089.D9. [DOI] [PubMed] [Google Scholar]
- 8.Abbott BG, Liu YH, Arrighi JA. [18F]Fluorodeoxyglucose as a memory marker of transient myocardial ischaemia. Nucl Med Commun. 2007;28:89–94. doi: 10.1097/MNM.0b013e328013eaa5. [DOI] [PubMed] [Google Scholar]
- 9.Dou KF, Yang MF, Yang YJ, Jain D, He ZX. Myocardial 18F-FDG uptake after exercise-induced myocardial ischemia in patients with coronary artery disease. J Nucl Med. 2008;49:1986–1991. doi: 10.2967/jnumed.108.052936. [DOI] [PubMed] [Google Scholar]
- 10.Arun S, Mittal BR, Bhattacharya A, Rohit MK. Comparison of Tc-99 m tetrofosmin myocardial perfusion scintigraphy and exercise F18-FDG imaging in detection of myocardial ischemia in patients with coronary artery disease. J Nucl Cardiol. 2015;22:98–110. doi: 10.1007/s12350-014-9954-9. [DOI] [PubMed] [Google Scholar]
- 11.Dou KF, Xie BQ, Gao XJ, Li Y, Yang YJ, He ZX, et al. Use of resting myocardial 18 F-FDG imaging in the detection of unstable angina. Nucl Med Commun. 2015;36:999–1006. doi: 10.1097/MNM.0000000000000362. [DOI] [PubMed] [Google Scholar]
- 12.Gould KL, Taegtmeyer H. Myocardial ischemia, fluorodeoxyglucose, and severity of coronary artery stenosis: The complexities of metabolic remodeling in hibernating myocardium. Circulation. 2004;109:e167–e170. doi: 10.1161/01.CIR.0000123021.19837.40. [DOI] [PubMed] [Google Scholar]
- 13.Gropler RJ, Siegel BA, Lee KJ, Moerlein SM, Perry DJ, Bergmann SR, et al. Nonuniformity in myocardial accumulation of fluorine-18-fluorodeoxyglucose in normal fasted humans. J Nucl Med. 1990;31:1749–1756. [PubMed] [Google Scholar]
- 14.Khandani AH, Isasi CR, Blaufox MD. Intra-individual variability of cardiac uptake on serial whole-body 18F-FDG PET. Nucl Med Commun. 2005;26:787–791. doi: 10.1097/01.mnm.0000175264.33368.da. [DOI] [PubMed] [Google Scholar]
- 15.Inglese E, Leva L, Matheoud R, Sacchetti G, Secco C, Gandolfo P, et al. Spatial and temporal heterogeneity of regional myocardial uptake in patients without heart disease under fasting conditions on repeated whole-body 18 F-FDG PET/CT. J Nucl Med. 2007;48:1662–1669. doi: 10.2967/jnumed.107.041574. [DOI] [PubMed] [Google Scholar]
- 16.Nose H, Otsuka H, Otomi Y, Terazawa K, Takao S, Iwamoto S, et al. The physiological uptake pattern of 18F-FDG in the left ventricular myocardium of patients without heart disease. J Med Invest. 2014;61:53–58. doi: 10.2152/jmi.61.53. [DOI] [PubMed] [Google Scholar]
- 17.Ishimaru S, Tsujino I, Takei T, Tsukamoto E, Sakaue S, Kamigaki M, et al. Focal uptake on 18 F-fluoro-2-deoxyglucose positron emission tomography images indicates cardiac involvement of sarcoidosis. Eur Heart J. 2005;26:1538–1543. doi: 10.1093/eurheartj/ehi180. [DOI] [PubMed] [Google Scholar]
- 18.Dilsizian V, Bacharach SL, Beanlands RS, Bergmann SR, Delbeke D, Dorbala S. ASNC imaging guidelines/SNMMI procedure standard for positron emission tomography (PET) nuclear cardiology procedures. J Nucl Cardiol. 2016;23:1187–1226. doi: 10.1007/s12350-016-0522-3. [DOI] [PubMed] [Google Scholar]
- 19.Kemppainen J, Fujimoto T, Kalliokoski KK, Viljanen T, Nuutila P, Knuuti J. Myocardial and skeletal muscle glucose uptake during exercise in humans. J Physiol. 2002;542:403–412. doi: 10.1113/jphysiol.2002.018135. [DOI] [PMC free article] [PubMed] [Google Scholar]
- 20.Araujo LI, Camici P, Spinks TJ, Jones T, Maseri A. Abnormalities in myocardial metabolism in patients with unstable angina as assessed by positron emission tomography. Cardiovasc Drugs Ther. 1988;2:41–46. doi: 10.1007/BF00054251. [DOI] [PubMed] [Google Scholar]
- 21.Davey KA, Garlick PB, Warley A, Southworth R. Immunogold labeling study of the distribution of GLUT-1 and GLUT-4 in cardiac tissue following stimulation by insulin or ischemia. Am J Physiol Heart Circ Physiol. 2007;292:H2009–H2019. doi: 10.1152/ajpheart.00663.2006. [DOI] [PubMed] [Google Scholar]
- 22.Bryant NJ, Govers R, James DE. Regulated transport of the glucose transporter GLUT4. Nat Rev Mol Cell Biol. 2002;3:267–277. doi: 10.1038/nrm782. [DOI] [PubMed] [Google Scholar]
- 23.Sandler MP, Bax JJ, Patton JA, Visser FC, Martin WH, Wijns W. Fluorine-18-fluorodeoxyglucose cardiac imaging using a modified scintillation camera. J Nucl Med. 1998;39:2035–2043. [PubMed] [Google Scholar]
- 24.Osborne MT, Hulten EA, Murthy VL, Skali H, Taqueti VR, Dorbala S, DiCarli MF, Blankstein R. Patient preparation for cardiac fluorine-18 fluorodeoxyglucose positron emission tomography imaging of inflammation. J Nucl Cardiol. 2017;24:86–99. doi: 10.1007/s12350-016-0502-7. [DOI] [PMC free article] [PubMed] [Google Scholar]
Associated Data
This section collects any data citations, data availability statements, or supplementary materials included in this article.
Data Availability Statement
Data sharing is not applicable to this article as no datasets were generated during the current study.


