

Abstract
Importance
Asthma is common and can be exacerbated by air pollution and stress. Unconventional natural gas development (UNGD) has community and environmental impacts. In Pennsylvania, development began in 2005 and by 2012, 6,253 wells were drilled. There are no prior studies of UNGD and objective respiratory outcomes.
Objective
To evaluate associations between UNGD and asthma exacerbations.
Design
A nested case-control study comparing asthma patients with exacerbations to asthma patients without exacerbations from 2005–12.
Setting
The Geisinger Clinic, which provides primary care services to over 400,000 patients in Pennsylvania.
Participants
Asthma patients aged 5–90 years (n = 35,508) were identified in electronic health records; those with exacerbations were frequency-matched on age, sex, and year of event to those without.
Exposure(s)
On the day before each patient’s index date (cases: date of event or medication order; controls: contact date), we estimated UNGD activity metrics for four phases (pad preparation, drilling, stimulation [“fracking”], and production) using distance from the patient’s home to the well, well characteristics, and the dates and durations of phases.
Main Outcome(s) and Measure(s)
We identified mild, moderate, and severe asthma exacerbations (new oral corticosteroid medication order, emergency department encounter, and hospitalization, respectively).
Results
We identified 20,749 mild, 1,870 moderate, and 4,782 severe asthma exacerbations, and frequency-matched these to 18,693, 9,350, and 14,104 control index dates, respectively. In three-level adjusted models, there was an association between the highest group of the activity metric for each UNGD phase compared to the lowest group for 11 out of 12 UNGD-outcome pairs (odds ratios [95% CI] ranged from 1.5 [1.2–1.7] for the association of the pad metric with severe exacerbations to 4.4 [3.8–5.2] for the association of the production metric with mild exacerbations). Six of the 12 UNGD-outcome associations had increasing odds ratios across quartiles. Our findings were robust to increasing levels of covariate control and in sensitivity analyses that included evaluation of some possible sources of unmeasured confounding.
Conclusions and Relevance
Residential UNGD activity metrics were statistically associated with increased odds of mild, moderate, and severe asthma exacerbations. Whether these associations are causal awaits further investigation, including more detailed exposure assessment.
INTRODUCTION
Asthma is a common, chronic disease – in 2010, 25.7 million people in the United States had asthma, a prevalence of 8.4%.1 Asthma is characterized by variable and recurring symptoms (including cough, wheezing, shortness of breath, and chest tightness), reversible airflow obstruction, bronchial hyper-responsiveness, and underlying inflammation.2,3 In 2009, there were 11.8 million outpatient visits, 2.1 million emergency department visits, and 479,300 hospitalizations for asthma in the US.1
Outdoor air pollution is a recognized cause of asthma exacerbations. A large body of literature links asthma exacerbations to exposure to air pollutants, including ozone, particulate matter, nitrogen dioxide, and sulfur dioxide,2,4 and exposure to even low levels of these pollutants has been associated with asthma hospitalizations, emergency department visits, and rescue medication use, with latency between 0 and 5 days.5–11 Stress at the individual and community levels is also associated with asthma exacerbations.12 Psychosocial stress can modify the effects of environmental triggers13 and is associated with worse asthma control and medication aderence.14
Unconventional natural gas development (UNGD) has recently become a major energy source domestically and worldwide. Pennsylvania has proceeded with UNGD rapidly – between the mid-2000s and 2012, 6,253 wells were drilled. In contrast, New York and Maryland, also in the Marcellus shale, have not developed.15,16 Despite calls for research on the health effects of the industry, there are few published studies of public health impacts of UNGD.17,18
The first step of UNGD is well pad preparation, lasting about 30 days, during which 3–5 acres are cleared and materials are brought to the site.19 Drilling begins on the spud date and typically lasts up to a month as a well is drilled vertically 2,000–3,000 meters and horizontally 600–3,000 meters.19 After drilling is completed, the horizontal portion is perforated. Stimulation, also called hydraulic fracturing or “fracking,” follows, lasts around a week, and requires 11–19 million liters of water, sand, and chemical additives (e.g., friction reducers, biocides, gelling agents).19,20 Development to this point requires over 1,000 truck trips per well.19 After stimulation, gas production begins. The Pennsylvania Department of Environmental Protection (PA DEP) requires companies to submit documentation at most of these stages of well development.21
UNGD has been associated with air quality and community social impacts.22–29 Psychosocial stress,12 exposure to air pollution4,30 including truck traffic,31 sleep disruption,32,33 and reduced socioeconomic status34 are all biologically plausible pathways for UNGD to affect asthma exacerbations. To date, there have been no epidemiologic studies of UNGD and objective respiratory outcomes. Respiratory outcomes are appropriate outcomes to assess potential health impacts of UNGD because these have clear links to air pollution and stress; have short latency between exposure and health effects; are common in the general population; and prompt patients to seek care so are captured by health system data. Using electronic health record (EHR) data from the Geisinger Clinic, located in over 35 counties in Pennsylvania, including many with active UNGD, we conducted a nested case-control study of the association between four UNGD activity metrics and asthma exacerbations.
METHODS
Study Population
We identified asthma patients from the Geisinger Clinic population, which is representative of the general population in the region.35 We included Pennsylvania and New York patients and excluded patients with cystic fibrosis (277.0x); chronic pulmonary heart disease (416.x); paralysis of vocal cords or larynx (478.3x); bronchiectasis (494.xx); and pneumoconiosis (500.xx-508.xx) using International Classification of Diseases, 9th Revision, Clinical Modification (ICD-9) codes. We required patients to have at least two encounters or medication orders with ICD-9 codes for asthma on different days.36 Patients were geocoded using previously published methods,37 88.9% to home address, 2.6% to ZIP+4, and 8.5% to ZIP code centroid. Inclusion criteria also included contact with Geisinger from 2005–2012 while between the ages 5–90 years and recorded information on sex (n=35,508). The study was approved by the Geisinger Institutional Review Board (with an IRB authorization agreement with Johns Hopkins Bloomberg School of Public Health). Patients did not receive a stipend and informed consent was obtained through a waiver of HIPAA authorization.
Outcome Ascertainment
We identified new oral corticosteroid (OCS) medication orders, asthma emergency department encounters, and asthma hospitalizations, termed mild, moderate, and severe exacerbations, respectively. For patients with more than one exacerbation of a given type within a calendar year, we randomly selected one event. For mild exacerbations, we distinguished new OCS medication orders from 2008–2012 for an asthma exacerbation from standing orders or OCS ordered for other diseases (Figure 1). The medication order date was considered the index date. OCS orders from before 2008 were excluded because these were not consistently captured before then. For moderate and severe exacerbations, we identified all emergency and hospitalization encounters from 2005–12. Primary or secondary diagnoses were for asthma (493.x) were used to identify emergency or hospitalization encounters. Patients who had multiple emergency or hospitalization encounters within 72 hours were considered to have a single event. Emergency and hospitalizations encounters within 72 hours were identified as a single hospitalization. The first encounter or admission date of each group of combined encounters was the index date. For patients with more than one type of exacerbation within a week, we retained only the higher category.
Figure 1.
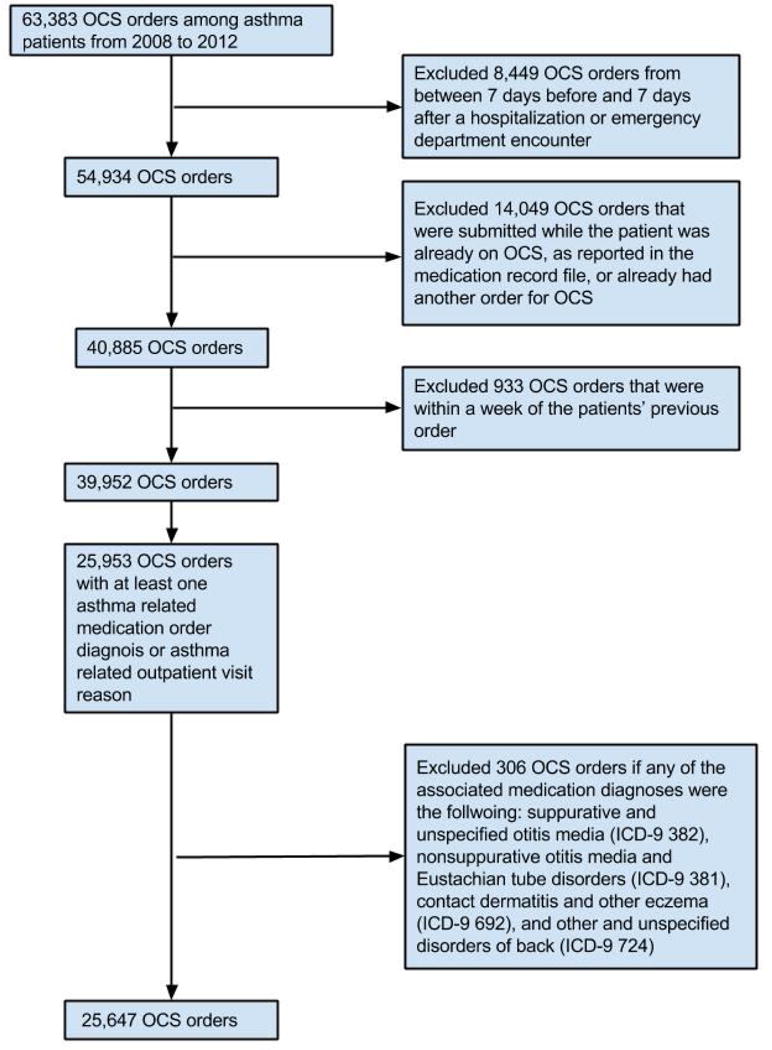
Flow diagram for identification of new asthma oral corticosteroid (OCS) medication orders.
Controls and Matching
We identified controls from asthma patients under observation by the health system, so that if the patient were to have an exacerbation, it would be captured by the EHR. All patient contact dates were identified (e.g., encounter, order, test). Because many of the covariates and the UNGD metrics were time-varying, we needed a single date on which to assign these variables. Therefore, for controls, we randomly selected one contact date per year per patient. A case was always eligible to be a control for a less severe event; or for an event of equal or greater severity until the year of the case’s event. We frequency-matched cases to controls on age category (5–12, 13–18, 19–44, 45–61, 62–74, 75+ years), sex (male, female), and year of encounter.
Covariates
We created time-varying covariates (age, season of event, smoking status, overweight and obesity, Medical Assistance [as a measure of low family socioeconomic status], type 2 diabetes) for each index date; and non-time-varying covariates (sex and race/ethnicity) for each patient. Race/ethnicity was assessed by patient self-report, and was included because it is a well-documented confounder in studies of asthma.2 We estimated the patients’ distance to nearest major and minor road using a network from the Federal Highway Administration,38 and used patients’ geographic coordinates to assign them to a community using a mixed definition of place and calculated community socioeconomic deprivation (CSD) for these places.37,39 In cities, communities were defined by census tracts; elsewhere, communities were defined by minor civil divisions (townships and boroughs). We estimated the peak temperature on the day before each index date using data from the nearest weather station to each patient.40
Well Data
Well data were obtained from: the PA DEP, for well spud (start of drilling) and production; the Pennsylvania Department of Conservation and Natural Resources, for information on well stimulation (hydraulic fracturing) and depths; and SkyTruth (Shepherdstown, WV), which used crowdsourcing of aerial photographs from the U.S. Department of Agriculture to identify the location of wellpads.41 For each well, we had information on well pad; latitude and longitude; dates of spudding, stimulation, and production; total depth; and volume of natural gas produced and the number of production days. We imputed missing total depths (0.4%) using conditional mean imputation. We estimated missing production quantities (0.2%) by averaging production quantities in the prior and following period. We extrapolated missing spud (2.0%) and stimulation (34.6%) dates using the well’s available dates of development by requiring that the stimulation date fall in between the spud and production date and using median durations between phases from wells without any missing dates.
Activity Metric Assignment
We estimated the UNGD activity metrics using an inverse distance-squared method for pad preparation, spud, stimulation, and production phases. We compared activity metrics on the day before, three days before, the sum of three to five days before, and the sum of one to five days before the index date, and because they were highly correlated (Spearman correlation coefficients ranged from 0.96–1.00), we used only the day before the index date. For the pad preparation and spud metrics (Equation 1):
where n is the number of wells and dij2 is the squared-distance (meters) between well i and patient j. For the stimulation metric (Equation 2):
where n is the number of wells, dij2 is the squared-distance (meters) between well i and patient j, and ti is the total well depth (meters) of well i. Total depth was used as a surrogate for truck traffic because volume of water used during stimulation42 was highly correlated with total depth, and water is trucked to the well during stimulation. For the production metric (Equation 3):
where n is the number of wells, dij2 is the squared-distance (meters) between well i and patient j, and vi is the daily natural gas production volume (m3) of well i. Production volume was used as a surrogate for fugitive emissions and compressor engine activity.22
Based on descriptions of the process19 and our data, we estimated that pad development lasted 30 days before the spud date for the first well on a pad, drilling lasted between 1–30 days after the spud date based on total depth, and stimulation lasted seven days. All wells in Pennsylvania in a given phase on the day prior to an index date contributed to that phase’s activity metric (Equations 1–3). We divided the four continuous metrics into quartiles using all 69,548 index dates from all three outcomes so the cutpoints were the same for all outcomes (very low, low, medium, and high).
Statistical Analysis
To assess the association of the four UNGD activity metrics with the three types of asthma exacerbations, we used multilevel logistic regression with random intercept for patient and community to account for multiple events per patient and patient clustering within communities. The base model included one of the four UNGD activity metrics (very low, low, medium, high), age category (5–12, 13–18, 19–44, 45–61, 62–74, 75+ years), sex (male, female), race/ethnicity (black, Hispanic, other, white), family history of asthma (yes, no), smoking status (former, current, missing, never), season (summer, fall, winter, spring), Medical Assistance (yes, no), and overweight/obesity (using BMI percentile for children and BMI for adults43) as covariates. We then added, one at a time, type 2 diabetes (yes, no), CSD (quartiles), distances to nearest major and minor arterial road (meters, z-transformed), and maximum temperature on the day prior to event (°C per interquartile range) (eFigure 1). We included the continuous covariates as linear and quadratic terms to allow for non-linearity. We used a 2-sided type 1 error rate of 0.05 for significance testing. We used Stata version 11.2 (StataCorp Inc.) and R version 3.1.2 (R Foundation for Statistical Computing).
Model Building
We calculated the intraclass correlation coefficient for the person and community levels. The proportions of total variance that were accounted for by between-community variation and between-person variation, respectively, were 14% and 63% for severe exacerbations, 41% and 89% for moderate exacerbations, and 1.2% and 59% for mild exacerbations. We evaluated covariates for conditional significance as they were added to the models.
Sensitivity Analyses
To evaluate how the four separate UNGD activity metrics compared to a summary measure, we calculated z-scores using continuous metrics, summed the z-scores, and re-ran the final models with this combined UNGD activity metric (quartiles). To explore whether an unmeasured confounder was responsible for our associations, we evaluated associations with encounters for a negative control44 (intestinal infectious disease and noninfectious gastroenteritis, ICD-9 codes 001-009 and 558.9) among asthma patients, and we also replaced the UNGD activity metric with indicators for counties. We were concerned about the unbalanced numbers of cases and controls for certain age categories, sex, and years in the mild exacerbations analysis, so we reran the analysis dropping the unbalanced cells. In order to check the sensitivity to geocoding level, we reran the final model for the production UNGD metric and each outcome using only patients who were geocoded to their home address. We estimated how large an unmeasured confounder would need to be to account for the observed associations, in whole or in part.45
RESULTS
Descriptions of Wells and Patients
Between 2005–2012, 6,253 unconventional natural gas wells were spudded on 2,710 pads, 4,728 were stimulated, and 3,706 were in production. The median number of wells per pad was 1 (IQR 1–3) and median total depth was 3,394m (IQR 2,934–3,839). Most development occurred after 2007 (Figure 2). On their index date, patients in the highest group of the spud metric lived a median of 19km from the closest spudded well, compared to 63km for patients in the lowest group. We identified 5,600 severe, 2,291 moderate, and 25,647 mild exacerbations. After retaining one event per type per year per person, 4,782 severe, 1,870 moderate, and 20,749 mild exacerbations were included. There was substantial overlap of patients and wells in the northern counties (Figure 3), and substantial overlap of patients by quartile of UNGD activity metric (eFigure 2).
Figure 2.
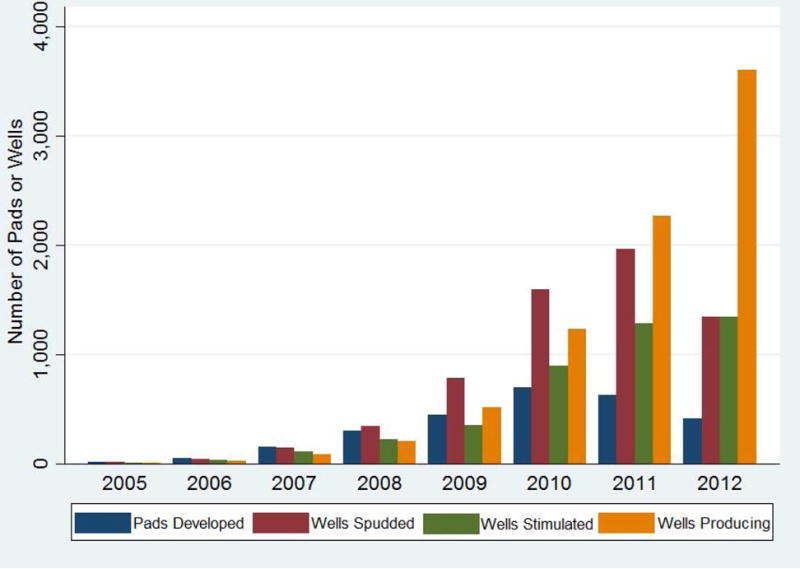
Number of developed pads (blue), and spudded (red), stimulated (green), and producing wells (yellow), 2005–12.
Figure 3.
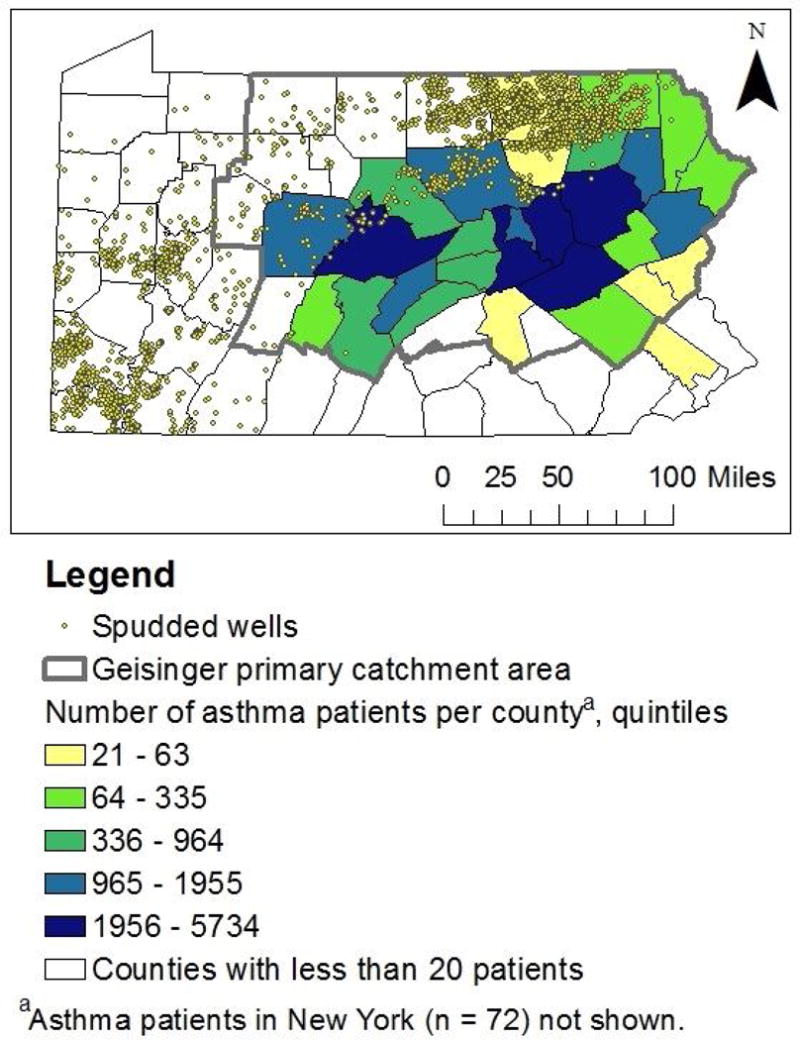
The location of spudded wells as of December 2012 and residential location of Geisinger asthma patients.
Demographic and clinical variables differed by outcome (Table 1). Compared to patients with mild and moderate exacerbations, patients with severe exacerbations were more likely to be female, older, current smokers, and obese (all p<0.001). Patients with moderate exacerbations were more likely to be on Medical Assistance and of black race than patients with the other two outcomes, and patients with mild exacerbations were more likely to live in townships (all p<0.001) than patients with the other two outcomes.
Table 1.
Descriptive statistics of cases and controls by exacerbation type for selected study variables by variable type (constant vs. time-varying)
| Hospitalization | Emergency Department Encounter | Oral Corticosteroid Order | ||||
|---|---|---|---|---|---|---|
| Control n (%a) | Case n (%) | Control n (%) | Case n (%) | Control n (%) | Case n (%) | |
| Non-time-varying (constant) variables | ||||||
| Total number of patients | 14104 (100) | 3576 (100) | 9350 (100) | 1454 (100) | 18693 (100) | 13196 (100) |
| Female | 10093 (71.6) | 2520 (70.5) | 5660 (60.5) | 872 (60) | 11297 (60.4) | 8173 (61.9) |
| Family history of asthma | 1324 (9.4) | 404 (11.3) | 1147 (12.3) | 266 (18.3) | 2047 (11) | 1672 (12.7) |
| Race/ethnicity | ||||||
| White | 13309 (94.4) | 3316 (92.7) | 8705 (93.1) | 1223 (84.1) | 17160 (91.8) | 12177 (92.3) |
| Black | 345 (2.4) | 111 (3.1) | 286 (3.1) | 125 (8.6) | 676 (3.6) | 431 (3.3) |
| Hispanic | 344 (2.4) | 126 (3.5) | 273 (2.9) | 93 (6.4) | 674 (3.6) | 471 (3.6) |
| Other/missing | 106 (0.8) | 23 (0.6) | 86 (0.9) | 13 (0.9) | 183 (1.0) | 117 (0.9) |
| Place type | ||||||
| Township | 8583 (60.9) | 2017 (56.4) | 5590 (59.8) | 659 (45.3) | 11324 (60.6) | 7917 (60) |
| Borough | 4192 (29.7) | 1108 (31) | 2786 (29.8) | 490 (33.7) | 5445 (29.1) | 3891 (29.5) |
| City | 1329 (9.4) | 451 (12.6) | 974 (10.4) | 305 (21) | 1924 (10.3) | 1388 (10.5) |
| Community socioeconomic deprivation | ||||||
| Quartile 1 | 2967 (21) | 673 (18.8) | 1936 (20.7) | 226 (15.5) | 3897 (20.8) | 2751 (20.8) |
| Quartile 2 | 3677 (26.1) | 886 (24.8) | 2454 (26.2) | 307 (21.1) | 4839 (25.9) | 3259 (24.7) |
| Quartile 3 | 3561 (25.2) | 920 (25.7) | 2294 (24.5) | 378 (26.0) | 4659 (24.9) | 3427 (26.0) |
| Quartile 4 | 3899 (27.6) | 1097 (30.7) | 2666 (28.5) | 543 (37.3) | 5298 (28.3) | 3759 (28.5) |
| Total number of eventsb | ||||||
| 0 | 14104 (100) | 0 (0) | 9350 (100) | 0 | 18693 (100) | 0 (0) |
| 1 | 0 (0) | 2732 (76.4) | 0 (0) | 1169 (80.4) | 0 (0) | 8205 (62.2) |
| 2 | 0 (0) | 605 (16.9) | 0 (0) | 208 (14.3) | 0 (0) | 3138 (23.8) |
| 3 | 0 (0) | 162 (4.5) | 0 (0) | 46 (3.2) | 0 (0) | 1273 (9.6) |
| 4 | 0 (0) | 48 (1.3) | 0 (0) | 20 (1.4) | 0 (0) | 451 (3.4) |
| 5 | 0 (0) | 20 (0.6) | 0 (0) | 5 (0.3) | 0 (0) | 129 (1) |
| 6 | 0 (0) | 3 (0.1) | 0 (0) | 3 (0.2) | 0 (0) | 0 (0) |
| 7 | 0 (0) | 4 (0.1) | 0 (0) | 0 (0) | 0 (0) | 0 (0) |
| 8 | 0 (0) | 2 (0.1) | 0 (0) | 3 (0.2) | 0 (0) | 0 (0) |
| Time-varying variables | ||||||
| Encounters (controls) or events (cases)c | 14104 (100) | 4782 (100) | 9350 (100) | 1870 (100) | 18693 (100) | 20749 (100) |
| Age (years) at event or matched encounter | ||||||
| 5 to < 13 | 1062 (7.5) | 354 (7.4) | 2265 (24.2) | 453 (24.2) | 4157 (22.2) | 4245 (20.5) |
| 13 to < 19 | 810 (5.7) | 269 (5.6) | 995 (10.6) | 199 (10.6) | 1926 (10.3) | 1926 (9.3) |
| 19 to < 45 | 5253 (37.2) | 1751 (36.6) | 4105 (43.9) | 821 (43.9) | 6013 (32.2) | 6323 (30.5) |
| 45 to < 62 | 4014 (28.5) | 1338 (28) | 1390 (14.9) | 278 (14.9) | 4313 (23.1) | 5353 (25.8) |
| 62 to < 75 | 1983 (14.1) | 661 (13.8) | 405 (4.3) | 81 (4.3) | 1613 (8.6) | 2113 (10.2) |
| > 75 years | 982 (7.0) | 409 (8.6) | 190 (2.0) | 38 (2.0) | 671 (3.6) | 789 (3.8) |
| Year of encounter | ||||||
| 2005 | 1593 (11.3) | 531 (11.1) | 845 (9) | 169 (9) | 0 (0) | 0 (0) |
| 2006 | 1767 (12.5) | 589 (12.3) | 905 (9.7) | 181 (9.7) | 0 (0) | 0 (0) |
| 2007 | 1659 (11.8) | 552 (11.5) | 1185 (12.7) | 237 (12.7) | 0 (0) | 0 (0) |
| 2008 | 1563 (11.1) | 526 (11) | 1220 (13) | 244 (13) | 3375 (18.1) | 3375 (16.3) |
| 2009 | 1819 (12.9) | 608 (12.7) | 1380 (14.8) | 276 (14.8) | 4038 (21.6) | 4038 (19.5) |
| 2010 | 1794 (12.7) | 603 (12.6) | 1205 (12.9) | 241 (12.9) | 4019 (21.5) | 4019 (19.4) |
| 2011 | 1886 (13.4) | 648 (13.6) | 1230 (13.2) | 246 (13.2) | 4286 (22.9) | 4624 (22.3) |
| 2012 | 2023 (14.3) | 725 (15.2) | 1380 (14.8) | 276 (14.8) | 2975 (15.9) | 4693 (22.6) |
| Season of encounterd | ||||||
| Spring | 3447 (24.4) | 1219 (25.5) | 2218 (23.7) | 456 (24.4) | 4337 (23.2) | 4618 (22.3) |
| Summer | 3357 (23.8) | 1134 (23.7) | 2253 (24.1) | 380 (20.3) | 4536 (24.3) | 3207 (15.5) |
| Fall | 4171 (29.6) | 1183 (24.7) | 2724 (29.1) | 553 (29.6) | 5695 (30.5) | 6995 (33.7) |
| Winter | 3129 (22.2) | 1246 (26.1) | 2155 (23) | 481 (25.7) | 4125 (22.1) | 5929 (28.6) |
| Obesitye | ||||||
| Not overweight/obese | 3728 (26.4) | 1046 (21.9) | 3366 (36) | 569 (30.4) | 6591 (35.3) | 5737 (27.6) |
| Overweight | 3605 (25.6) | 1077 (22.5) | 2173 (23.2) | 376 (20.1) | 4441 (23.8) | 4821 (23.2) |
| Obese | 6683 (47.4) | 2641 (55.2) | 3762 (40.2) | 895 (47.9) | 7577 (40.5) | 10137 (48.9) |
| Missing | 88 (0.6) | 18 (0.4) | 49 (0.5) | 30 (1.6) | 84 (0.4) | 54 (0.3) |
| Smoking status | ||||||
| Never | 7454 (52.9) | 2014 (42.1) | 5335 (57.1) | 826 (44.2) | 11375 (60.9) | 11556 (55.7) |
| Current | 2552 (18.1) | 1204 (25.2) | 1466 (15.7) | 387 (20.7) | 2589 (13.9) | 3672 (17.7) |
| Former | 3204 (22.7) | 1238 (25.9) | 1395 (14.9) | 304 (16.3) | 3231 (17.3) | 4251 (20.5) |
| Missing | 894 (6.3) | 326 (6.8) | 1154 (12.3) | 353 (18.9) | 1498 (8) | 1270 (6.1) |
| Medical Assistancef | 2657 (18.8) | 1568 (32.8) | 2529 (27) | 741 (39.6) | 4956 (26.5) | 5850 (28.2) |
| Type 2 diabetes | 1504 (10.7) | 917 (19.2) | 517 (5.5) | 156 (8.3) | 1420 (7.6) | 1905 (9.2) |
| On inhaled corticosteroids | 4061 (28.8) | 1577 (33) | 2545 (27.2) | 713 (38.1) | 5319 (28.5) | 10458 (50.4) |
| Distance to nearest major roadg, median, meters | 1042 | 826 | 1077.5 | 651.5 | 1064 | 1032 |
| Distance to nearest minor roadh, median, meters | 708.5 | 535 | 682 | 411 | 687 | 691 |
| Temperature on the prior day, median, degrees Celsius | 16.1 | 16.7 | 16.7 | 15 | 16.1 | 13.3 |
| Pad activity metric, 1010/m2 | ||||||
| Very low, less than 10.7 | 5988 (42.5) | 2004 (41.9) | 3671 (39.3) | 719 (38.4) | 2344 (12.5) | 2661 (12.8) |
| Low, 10.7 to 25.7 | 2811 (19.9) | 816 (17.1) | 2096 (22.4) | 350 (18.7) | 5281 (28.3) | 6033 (29.1) |
| Medium, 25.8 to 48.7 | 2675 (19) | 887 (18.5) | 1819 (19.5) | 363 (19.4) | 5489 (29.4) | 6154 (29.7) |
| High, greater than 48.7 | 2630 (18.6) | 1075 (22.5) | 1764 (18.9) | 438 (23.4) | 5579 (29.8) | 5901 (28.4) |
| Spud activity metric, 1010/m2 | ||||||
| Very low, less than 5.1 | 6009 (42.6) | 2032 (42.5) | 3701 (39.6) | 742 (39.7) | 2352 (12.6) | 2551 (12.3) |
| Low, 5.1 to 32.3 | 2796 (19.8) | 819 (17.1) | 2030 (21.7) | 371 (19.8) | 5491 (29.4) | 5880 (28.3) |
| Medium, 32.4 to 66.8 | 2719 (19.3) | 821 (17.2) | 1832 (19.6) | 317 (17) | 5389 (28.8) | 6309 (30.4) |
| High, greater than 66.8 | 2580 (18.3) | 1110 (23.2) | 1787 (19.1) | 440 (23.5) | 5461 (29.2) | 6009 (29) |
| Stimulation activity metric, 1013 × m/m2 | ||||||
| Very low, less than 2.7 | 5829 (41.3) | 1986 (41.5) | 3598 (38.5) | 729 (39) | 2577 (13.8) | 2668 (12.9) |
| Low, 8,2.7 to 25.5 | 2876 (20.4) | 858 (17.9) | 2089 (22.3) | 391 (20.9) | 5573 (29.8) | 5600 (27) |
| Medium, 25.6 to 67.4 | 2736 (19.4) | 841 (17.6) | 1835 (19.6) | 310 (16.6) | 5415 (29) | 6250 (30.1) |
| High, greater than 67.4 | 2663 (18.9) | 1097 (22.9) | 1828 (19.6) | 440 (23.5) | 5128 (27.4) | 6231 (30) |
| Production activity metric, 1015 × m3/m2 | ||||||
| Very low, less than 2.3 | 6079 (43.1) | 2087 (43.6) | 3776 (40.4) | 765 (40.9) | 2345 (12.5) | 2335 (11.3) |
| Low, 2.3 to 133.2 | 2629 (18.6) | 794 (16.6) | 1953 (20.9) | 363 (19.4) | 5713 (30.6) | 5935 (28.6) |
| Medium, 133.3 to 759.7 | 2636 (18.7) | 798 (16.7) | 1789 (19.1) | 271 (14.5) | 5787 (31) | 6106 (29.4) |
| High, greater than 759.7 | 2760 (19.6) | 1103 (23.1) | 1832 (19.6) | 471 (25.2) | 4848 (25.9) | 6373 (30.7) |
Percentages may not add to 100 due to rounding.
Cases contribute up to one event per year (events are randomly chosen from patients with multiple events in a year). Controls cannot have had a event up to the year of the hospitalization in the frequency-matched case, but can serve as a case later.
For controls, the encounter is a randomly selected encounter during the year of the matched case’s hospitalization and before the year of any subsequent asthma hospitalization in the control. For cases, the event is an asthma hospitalization.
Spring, March 22–June 21; summer, June 22–September 21; fall, September 22–December 21; winter, December 22–March 21.
For children and adults, respectively: normal, body mass index [BMI] < 85th percentile or BMI < 25 kg/m2; overweight, BMI = 85th–<95th percentile or BMI = 25–<30 kg/m2; obese, BMI ≥ 95th percentile or BMI ≥ 30 kg/m2
A means tested program that is a surrogate for family SES.
Principal arterial or interstate
Minor arterial road
Associations of UNGD Activity Metrics with Asthma Outcomes
For severe, moderate, and mild exacerbations, the average percent changes for all odds ratios, from simple models with random intercepts for person and place without covariates to fully adjusted multilevel models, were −8.5%, −0.2%, and 6.0%, respectively, suggesting little sensitivity of the associations to measured covariates. In adjusted models, the high activity (vs. very low) of each UNGD metric was associated with each asthma outcome (Table 2), except for the pad metric with mild exacerbations. Associations for the other 11 exposure-outcome pairs ranged from (odds ratio [95% confidence interval]) 1.5 (1.2–1.7) for pad metric with severe exacerbations to 4.4 (3.8–5.2) for production metric with mild exacerbations. Of the 12 activity metric-outcome pairs, six had increasing odds ratios across quartiles 2–4.
Table 2.
Associations of unconventional natural gas activity metrics and asthma outcomes
| Asthma Hospitalizationsa | Asthma Emergency Department Visitsa | OCS Ordersa | ||
|---|---|---|---|---|
| Odds Ratio (95% CIb) | Odds Ratio (95% CI) | Odds Ratio (95% CI) | ||
| Pad Activity Metric | Lowc | 1.26 (1.06 – 1.50) | 1.53 (1.06 – 2.23) | 1.54 (1.37 – 1.74) |
| Medium | 1.37 (1.15 – 1.64) | 1.77 (1.2 – 2.6) | 1.66 (1.47 – 1.87) | |
| High | 1.45 (1.21 – 1.73) | 1.37 (0.94 – 1.99) | 1.59 (1.41 – 1.81) | |
| Spud Activity Metric | Low | 1.16 (0.98 – 1.37) | 1.53 (1.06 – 2.21) | 1.45 (1.29 – 1.63) |
| Medium | 1.26 (1.05 – 1.50) | 1.54 (1.04 – 2.27) | 1.98 (1.75 – 2.24) | |
| High | 1.64 (1.38 – 1.97) | 1.57 (1.08 – 2.29) | 1.99 (1.75 – 2.26) | |
| Stimulation Activity Metric | Low | 1.13 (0.96 – 1.33) | 1.51 (1.05 – 2.19) | 1.23 (1.09 – 1.39) |
| Medium | 1.31 (1.10 – 1.57) | 1.74 (1.17 – 2.61) | 2.22 (1.95 – 2.53) | |
| High | 1.66 (1.38 – 1.98) | 1.71 (1.16 – 2.52) | 3.00 (2.60 – 3.45) | |
| Production Activity Metric | Low | 1.10 (0.92 – 1.30) | 1.47 (1.01 – 2.14) | 1.28 (1.13 – 1.46) |
| Medium | 1.16 (0.97 – 1.38) | 1.10 (0.74 – 1.65) | 2.15 (1.87 – 2.47) | |
| High | 1.74 (1.45 – 2.09) | 2.19 (1.47 – 3.25) | 4.43 (3.75 – 5.22) |
Multilevel models with a random intercept for patient and community, adjusted for age category (5–12, 13–18, 19–44, 45–61, 62–74, 75+ years), sex (male, female), race/ethnicity (white, black, Hispanic, other), family history of asthma (yes vs. no), smoking status (never, former, current, missing), season (spring, March 22–June 21; summer, June 22–September 21; fall, September 22–December 21; winter, December 22–March 21), Medical Assistance (yes vs. no), overweight/obesity (normal, body mass index [BMI] < 85th percentile or BMI < 25 kg/m2; overweight, BMI = 85th–<95th percentile or BMI = 25–<30 kg/m2; obese, BMI ≥ 95th percentile or BMI ≥ 30 kg/m2, for children and adults, respectively; BMI missing), type 2 diabetes (yes vs. no), community socioeconomic deprivation (quartiles), distance to nearest major and minor arterial road (truncated at the 98th percentile, meters, z-transformed), squared distance to nearest major and minor arterial road (truncated at the 98th percentile, meters, z-transformed), maximum temperature on the day prior to event (degrees Celsius), and squared maximum temperature on the day prior to event (degrees Celsius)
Confidence interval
Very low is the reference group
Sensitivity Analyses
The four UNGD activity metrics, calculated for all case and control index dates (n=69,548), were correlated with one another (Spearman correlation coefficients of the continuous variables ranged from 0.73–0.91). In the analysis to evaluate associations of a combined UNGD activity metric of the four phases of development, the odds ratio point estimates were between those from regressions of each phase separately. In the negative disease control analysis, we found no association of the spud activity metric with gastrointestinal illness. In a model evaluating associations of counties with outcomes (UNGD metrics removed), counties with high UNGD activity were not associated with outcomes. In the analysis that removed cells with unbalanced numbers of cases and controls in the mild exacerbation analysis, associations were attenuated (odds ratios decreased by 5%, 17%, 37%, and 55% for the high group odds ratio for the pad, spud, stimulation, and production metrics, respectively, all odds ratios p<0.05). In the analysis to evaluate the impact of different quality of geocoding, associations were unchanged. In the analysis of the mild and severe exacerbations, we determined that even an unmeasured confounder strongly associated with both UNGD activity and outcome (e.g., both odds ratios = 3.0), and a prevalence of 0.3 in the exposed group, would not likely change our inference about associations, given our models. However, for moderate exacerbations, an unmeasured confounder with the same characteristics could account for two of the three statistically significant associations.
DISCUSSION
We conducted a nested case-control study in a large number of asthma patients using EHR data in Pennsylvania from 2005–2012, a period of rapid development. In this first study of UNGD and objective respiratory outcomes, we found consistent associations of four UNGD activity metrics with three types of asthma exacerbations. Whether these associations are causal awaits further investigation, including more detailed exposure assessment.
Asthma is a suitable outcome because UNGD has community and environmental impacts that could affect it; it is highly prevalent; it can be exacerbated by stress and small changes in air quality with short latency; and patients usually seek care for exacerbations so they are captured by an EHR. By leveraging longitudinal EHR data, we were able to complete a number of sensitivity analyses that suggested the associations were robust to increasing levels of adjustment, although in some cases they were attenuated.
Studies of air pollution and asthma exacerbations have generally found small but consistently increased risks. A study of pediatric emergency department visits for asthma in Atlanta found that a standard deviation increase in pollution had associated risk ratios of 1.020, 1.036, and 1.062 for particulate matter < 10μm, nitrogen dioxide, and ozone, respectively.46 Studies on psychosocial stress have found that in children with asthma, the risk of an asthma exacerbation increased 4.7 times in the two days following a very stressful event.47 Adults exposed to violence in their community have 2.3 and 2.5 times the risk of an asthma emergency department visit and hospitalization, respectively, than those not exposed to community violence.48
Two sensitivity analyses were directed to the very important possibility that unmeasured confounding could account for our results. First, UNGD metrics were not associated with the negative disease control. Second, in the analysis replacing UNGD metrics with indicators for counties, counties with UNGD were not associated with severe exacerbations. These both provide evidence that unmeasured confounding is unlikely to account for our findings, but we acknowledge that the possibility still exists. We note that an unmeasured confounder would need to be strongly associated with both UNGD and asthma outcomes to account for our results. In sensitivity analysis to address unbalanced numbers of cases and controls, results were attenuated; the majority of dropped patients comprised the most susceptible groups (younger and older) in the most exposed years, so attenuation was not unexpected. Finally, geocoding method and analysis with an overall activity metric did not change inferences.
This study had several strengths, including a large sample size from a population that represents the general population in the region. Additionally, our exposure assessment improved on in prior studies,49,50 which used categorical distance-based metrics, that did not account for UNGD phases. Our metric incorporated the temporality and duration of phases, gas production volume, and a surrogate for truck traffic. This study also improved on outcome ascertainment used in the previous study on UNGD and respiratory outcomes,50 which relied on self-reported outcomes and grouped several respiratory symptoms and conditions together (including asthma). We used documented asthma exacerbations. Our findings were robust to increasing levels of covariate control and in several sensitivity analyses.
This study also had limitations. The EHR does not collect information on occupation and only keeps patients’ most recent address. However, comparing addresses used in a prior study35 to addresses used in this study (39 months apart), 79.8% of patients were at the same address and an additional 7.4% and 7.6% were less than 3.2km and 3.2–16km, respectively, from their prior address, indicating little residential mobility. The EHR only collects data on events that occur at Geisinger facilities, but ambulances go to the closest hospital, so we may have under-counted events. We were unable to differentiate between asthma exacerbations that were hospitalized from those that occurred while hospitalized. We frequency-matched cases and controls for year because UNGD activity metrics and year were highly correlated. We did not include year in the final model because of this high correlation, so there remains the possibility of unmeasured residual confounding by factors that strongly vary by year. We kept all four UNGD metrics because of a priori evidence that exposures differed by phase, but because metrics were highly correlated we were unable to definitively distinguish among them. Furthermore, our UNGD metrics do not provide insight into the mechanism of the associations we observed.
Asthma is a common disease with large individual and societal burdens, so the possibility that UNGD may increase risk for asthma exacerbations requires public health attention. As ours is the first study of UNGD and objective respiratory outcomes, and several other health outcomes have not been investigated to date, there is an urgent need for more health studies. These should include more detailed exposure assessment to better characterize pathways and identify the phases of development that present the most risk.
Acknowledgments
Sara G. Rasmussen and Brian S. Schwartz had full access to all the data in the study and take responsibility for the integrity of the data and the accuracy of the data analysis.
Brian S. Schwartz is a Fellow of the Post Carbon Institute (PCI), serving as an informal advisor on climate, energy, and health issues. He receives no payment for this role. His research is entirely independent of PCI, and is not motivated, reviewed, or funded by PCI.
Source of Funding: This study was funded by the National Institute of Environmental Health Sciences grant ES023675-01 (PI: B S Schwartz) and training grant ES07141 (S G Rasmussen). Additional support was provided by the Degenstein Foundation for compilation of well data, the Robert Wood Johnson Foundation Health & Society Scholars program (J A Casey), and the National Science Foundation Integrative Graduate Education and Research Traineeship (S G Rasmussen). No funders had input into the study design, conduct, data collection or analysis, or manuscript preparation.
Footnotes
Additional Contributions: We thank Joseph J. DeWalle, BS, Jennifer K. Irving, BA, and Joshua M. Crisp, BS (Geisinger Center for Health Research) for patient geocoding and assistance in assembling the UNGD dataset; SkyTruth in Shepherdstown, WV for the well pad data; Kirsten Koehler, PhD (JHSPH) for assistance with the temperature data; Kara Rudolph, PhD, MHS (Robert Wood Johnson Foundation Health and Society Scholars Program, UC San Francisco and UC Berkeley) for the code for the unmeasured confounder graphs; and Jonathan S. Pollak, MPP (JHSPH) for identifying the asthma patients from the general Geisinger population. All except KK and KR received compensation for their contributions.
We declare that we have no conflicts of interest.
References
- 1.Moorman JE, Akinbami LJ, Bailey CM, Johnson CA, et al. National surveillance of asthma: United States, 2001–2010. National Center for Health Statistics, Vital Health Stat. 2012;3:35. [PubMed] [Google Scholar]
- 2.National Heart, Lung, and Blood Institute. Expert panel report 3: Guidelines for the diagnosis and management of asthma: Full report. US Department of Health and Human Services, National Institutes of Health, National Heart, Lung, and Blood Institute; 2007. National Asthma Education Program. Expert Panel on the Management of Asthma. [Google Scholar]
- 3.Dougherty R, Fahy JV. Acute exacerbations of asthma: Epidemiology, biology and the exacerbation-prone phenotype. Clinical & Experimental Allergy. 2009;39(2):193–202. doi: 10.1111/j.1365-2222.2008.03157.x. [DOI] [PMC free article] [PubMed] [Google Scholar]
- 4.Guarnieri M, Balmes JR. Outdoor air pollution and asthma. The Lancet. 2014;383(9928):1581–1592. doi: 10.1016/S0140-6736(14)60617-6. [DOI] [PMC free article] [PubMed] [Google Scholar]
- 5.Gent JF, Triche EW, Holford TR, et al. Association of low-level ozone and fine particles with respiratory symptoms in children with asthma. JAMA. 2003;290(14):1859–1867. doi: 10.1001/jama.290.14.1859. [DOI] [PubMed] [Google Scholar]
- 6.Peel JL, Tolbert PE, Klein M, et al. Ambient air pollution and respiratory emergency department visits. Epidemiology. 2005;16(2):164–174. doi: 10.1097/01.ede.0000152905.42113.db. [DOI] [PubMed] [Google Scholar]
- 7.Ostro B, Lipsett M, Mann J, Braxton-Owens H, White M. Air pollution and exacerbation of asthma in African-American children in Los Angeles. Epidemiology. 2001;12(2):200–208. doi: 10.1097/00001648-200103000-00012. [DOI] [PubMed] [Google Scholar]
- 8.Dominici F, Peng RD, Bell ML, et al. Fine particulate air pollution and hospital admission for cardiovascular and respiratory diseases. JAMA. 2006;295(10):1127–1134. doi: 10.1001/jama.295.10.1127. [DOI] [PMC free article] [PubMed] [Google Scholar]
- 9.Ko F, Tam W, Wong T, et al. Effects of air pollution on asthma hospitalization rates in different age groups in Hong Kong. Clinical & Experimental Allergy. 2007;37(9):1312–1319. doi: 10.1111/j.1365-2222.2007.02791.x. [DOI] [PubMed] [Google Scholar]
- 10.Schildcrout JS, Sheppard L, Lumley T, Slaughter JC, Koenig JQ, Shapiro GG. Ambient air pollution and asthma exacerbations in children: An eight-city analysis. Am J Epidemiol. 2006;164(6):505–517. doi: 10.1093/aje/kwj225. [DOI] [PubMed] [Google Scholar]
- 11.Halonen JI, Lanki T, Yli-Tuomi T, Kulmala M, Tiittanen P, Pekkanen J. Urban air pollution, and asthma and COPD hospital emergency room visits. Thorax. 2008;63(7):635–641. doi: 10.1136/thx.2007.091371. [DOI] [PubMed] [Google Scholar]
- 12.Yonas MA, Lange NE, Celedón JC. Psychosocial stress and asthma morbidity. Current Opinion in Allergy and Clinical Immunology. 2012;12(2):202–210. doi: 10.1097/ACI.0b013e32835090c9. [DOI] [PMC free article] [PubMed] [Google Scholar]
- 13.Chen E, Miller GE. Stress and inflammation in exacerbations of asthma. Brain Behav Immun. 2007;21(8):993–999. doi: 10.1016/j.bbi.2007.03.009. [DOI] [PMC free article] [PubMed] [Google Scholar]
- 14.Wisnivesky JP, Lorenzo J, Feldman JM, Leventhal H, Halm EA. The relationship between perceived stress and morbidity among adult inner-city asthmatics. Journal of Asthma. 2010;47(1):100–104. doi: 10.3109/02770900903426989. [DOI] [PubMed] [Google Scholar]
- 15.New York State Department of Health Completes Review of High-volume Hydraulic Fracturing [press release] Albany, NY: New York State Department of Enviornmental Conservation; Dec 17, 2014. [Google Scholar]
- 16.Cox E. Assembly votes to ban fracking for two years. Baltimore Sun. 2015 Apr 10; [Google Scholar]
- 17.Werner AK, Vink S, Watt K, Jagals P. Environmental health impacts of unconventional natural gas development: A review of the current strength of evidence. Sci Total Environ. 2015;505:1127–1141. doi: 10.1016/j.scitotenv.2014.10.084. [DOI] [PubMed] [Google Scholar]
- 18.Mitka M. Rigorous evidence slim for determining health risks from natural gas fracking. JAMA. 2012;307(20) doi: 10.1001/jama.2012.3726. [DOI] [PubMed] [Google Scholar]
- 19.Gaines M. PennDOT’s posting and bonding program and impact of unconventional oil & gas [webinar] http://extension.psu.edu/natural-resources/natural-gas/webinars/shale-energy-developments-effect-on-the-posting-bonding-and-maintenance-of-roads-in-rural-pa/mark-gaines-may-16-2013-powerpoint. Published May 16, 2013.
- 20.Maloney KO, Yoxtheimer DA. Production and disposal of waste materials from gas and oil extraction from the Marcellus shale play in Pennsylvania. Env Prac. 2012;14(04):278–287. [Google Scholar]
- 21.Pennsylvania Code. Subchapter E. Well reporting § 78.121–§78.125. http://www.pacode.com/secure/data/025/chapter78/subchapEtoc.html.
- 22.Roy AA, Adams PJ, Robinson AL. Air pollutant emissions from the development, production, and processing of Marcellus shale natural gas. J Air Waste Manage Assoc. 2013;64(1):19–37. doi: 10.1080/10962247.2013.826151. [DOI] [PubMed] [Google Scholar]
- 23.Litovitz A, Curtright A, Abramzon S, Burger N, Samaras C. Estimation of regional air-quality damages from Marcellus shale natural gas extraction in Pennsylvania. Environmental Research Letters. 2013;8(1):014017. [Google Scholar]
- 24.McKenzie LM, Witter RZ, Newman LS, Adgate JL. Human health risk assessment of air emissions from development of unconventional natural gas resources. Sci Total Environ. 2012;424:79–87. doi: 10.1016/j.scitotenv.2012.02.018. [DOI] [PubMed] [Google Scholar]
- 25.Sangaramoorthy T, Jamison AM, Boyle MD, et al. Place-based perceptions of the impacts of fracking along the Marcellus shale. Soc Sci Med. 2016 doi: 10.1016/j.socscimed.2016.01.002. [DOI] [PubMed] [Google Scholar]
- 26.Adgate JL, Goldstein BD, McKenzie LM. Potential public health hazards, exposures and health effects from unconventional natural gas development. Environ Sci Technol. 2014;48(15):8307–8320. doi: 10.1021/es404621d. [DOI] [PubMed] [Google Scholar]
- 27.Vinciguerra T, Yao S, Dadzie J, et al. Regional air quality impacts of hydraulic fracturing and shale natural gas activity: Evidence from ambient VOC observations. Atmos Environ. 2015;110:144–150. [Google Scholar]
- 28.Gopalakrishnan S, Klaiber HA. Is the shale energy boom a bust for nearby residents? evidence from housing values in Pennsylvania. Am J Agric Econ. 2014;96(1):43–66. [Google Scholar]
- 29.Muehlenbachs L, Spiller E, Timmins C. The housing market impacts of shale gas development. Am Econ Rev. 2015;105(12):3633–59. [Google Scholar]
- 30.Brunekreef B, Holgate ST. Air pollution and health. Lancet. 2002;360:1233–1242. doi: 10.1016/S0140-6736(02)11274-8. [DOI] [PubMed] [Google Scholar]
- 31.Salam MT, Islam T, Gilliland FD. Recent evidence for adverse effects of residential proximity to traffic sources on asthma. Curr Opin Pulm Med. 2008;14(1):3–8. doi: 10.1097/MCP.0b013e3282f1987a. [DOI] [PubMed] [Google Scholar]
- 32.Hanson MD, Chen E. Brief report: The temporal relationships between sleep, cortisol, and lung functioning in youth with asthma. J Pediatr Psychol. 2007;33(3):312–316. doi: 10.1093/jpepsy/jsm120. [DOI] [PubMed] [Google Scholar]
- 33.Daniel LC, Boergers J, Kopel SJ, Koinis-Mitchell D. Missed sleep and asthma morbidity in urban children. Annals of Allergy, Asthma & Immunology. 2012;109(1):41–46. doi: 10.1016/j.anai.2012.05.015. [DOI] [PMC free article] [PubMed] [Google Scholar]
- 34.Griswold SK, Nordstrom CR, Clark S, Gaeta TJ, Price ML, Camargo CA. Asthma exacerbations in North American adults: Who are the “frequent fliers” in the emergency department? Chest Journal. 2005;127(5):1579–1586. doi: 10.1378/chest.127.5.1579. [DOI] [PubMed] [Google Scholar]
- 35.Casey JA, Cosgrove SE, Stewart WF, Pollak J, Schwartz BS. A population-based study of the epidemiology and clinical features of methicillin-resistant staphylococcus aureus infection in Pennsylvania, 2001–2010. Epidemiol Infect. 2013;141(06):1166–1179. doi: 10.1017/S0950268812001872. [DOI] [PMC free article] [PubMed] [Google Scholar]
- 36.Pacheco JA, Avila PC, Thompson JA, et al. A highly specific algorithm for identifying asthma cases and controls for genome-wide association studies. AMIA Annu Symp Proc. 2009;2009:497–501. [PMC free article] [PubMed] [Google Scholar]
- 37.Schwartz BS, Stewart WF, Godby S, et al. Body mass index and the built and social environments in children and adolescents using electronic health records. Am J Prev Med. 2011;41(4):e17–e28. doi: 10.1016/j.amepre.2011.06.038. [DOI] [PubMed] [Google Scholar]
- 38.U.S. Department of Transportation Federal Highway Administration. Highway Performance Monitoring System website. http://www.fhwa.dot.gov/policyinformation/hpms/shapefiles.cfm. Updated 2013. Accessed March 27, 2015.
- 39.Liu AY, Curriero FC, Glass TA, Stewart WF, Schwartz BS. The contextual influence of coal abandoned mine lands in communities and type 2 diabetes in Pennsylvania. Health Place. 2013 doi: 10.1016/j.healthplace.2013.03.012. [DOI] [PubMed] [Google Scholar]
- 40.National Climatic Data Center. Climate Data Online website. http://www.ncdc.noaa.gov/cdo-web/. Accessed May 11, 2011.
- 41.SkyTruth. TADPOLE Pennsylvania results. http://frack.skytruth.org/frackfinder/frackfinder-news/tadpolepennsylvaniaresults. Published Feb 12, 2014. Updated 2014. Accessed June 30, 2014.
- 42.SkyTruth. Fracking chemical database. http://frack.skytruth.org/fracking-chemical-database. Updated 2013. Accessed November 27, 2013.
- 43.Ogden CL, Carroll MD, Kit BK, Flegal KM. Prevalence of childhood and adult obesity in the united states, 2011–2012. JAMA. 2014;311(8):806. doi: 10.1001/jama.2014.732. [DOI] [PMC free article] [PubMed] [Google Scholar]
- 44.Lipsitch M, Tchetgen Tchetgen E, Cohen T. Negative controls: A tool for detecting confounding and bias in observational studies. Epidemiology. 2010;21(3):383–388. doi: 10.1097/EDE.0b013e3181d61eeb. [DOI] [PMC free article] [PubMed] [Google Scholar]
- 45.VanderWeele TJ, Arah OA. Bias formulas for sensitivity analysis of unmeasured confounding for general outcomes, treatments, and confounders. Epidemiology. 2011;22(1):42–52. doi: 10.1097/EDE.0b013e3181f74493. [DOI] [PMC free article] [PubMed] [Google Scholar]
- 46.Strickland MJ, Darrow LA, Klein M, et al. Short-term associations between ambient air pollutants and pediatric asthma emergency department visits. American journal of respiratory and critical care medicine. 2010;182(3):307–316. doi: 10.1164/rccm.200908-1201OC. [DOI] [PMC free article] [PubMed] [Google Scholar]
- 47.Sandberg S, Jarvenpaa S, Penttinen A, Paton JY, McCann DC. Asthma exacerbations in children immediately following stressful life events: A cox’s hierarchical regression. Thorax. 2004;59(12):1046–1051. doi: 10.1136/thx.2004.024604. [DOI] [PMC free article] [PubMed] [Google Scholar]
- 48.Apter AJ, Garcia LA, Boyd RC, Wang X, Bogen DK, Ten Have T. Exposure to community violence is associated with asthma hospitalizations and emergency department visits. J Allergy Clin Immunol. 2010;126(3):552–557. doi: 10.1016/j.jaci.2010.07.014. [DOI] [PMC free article] [PubMed] [Google Scholar]
- 49.McKenzie LM, Guo R, Witter RZ, Savitz DA, Newman LS, Adgate JL. Birth outcomes and maternal residential proximity to natural gas development in rural Colorado. Environ Health Perspect. 2014 doi: 10.1289/ehp.1306722. [DOI] [PMC free article] [PubMed] [Google Scholar]
- 50.Rabinowitz PM, Slizovskiy IB, Lamers V, et al. Proximity to natural gas wells and reported health status: Results of a household survey in Washington County, Pennsylvania. Environ Health Perspect. 2014 doi: 10.1289/ehp.1307732. [DOI] [PMC free article] [PubMed] [Google Scholar]