Abstract
Microfluidic hanging-drop networks enable culturing and analysis of 3D microtissue spheroids derived from different cell types under controlled perfusion and investigating inter-tissue communication in multi-tissue formats. In this paper we introduce a compact on-chip pumping approach for flow control in hanging-drop networks. The pump includes one pneumatic chamber located directly above one of the hanging drops and uses the surface tension at the liquid–air-interface for flow actuation. Control of the pneumatic protocol provides a wide range of unidirectional pulsatile and continuous flow profiles. With the proposed concept several independent hanging-drop networks can be operated in parallel with only one single pneumatic actuation line at high fidelity. Closed-loop medium circulation between different organ models for multi-tissue formats and multiple simultaneous assays in parallel are possible. Finally, we implemented a real-time feedback control-loop of the pump actuation based on the beating of a human iPS-derived cardiac microtissue cultured in the same system. This configuration allows for simulating physiological effects on the heart and their impact on flow circulation between the organ models on chip.
Introduction
The design of microphysiological systems constitutes a next step towards more biomimetic in vitro models.1 Such systems comprise conventional or advanced three-dimensional cell cultures and a fluidic routing scheme, which allows for interconnecting the different organ models for controlled perfusion and metabolite transfer.2–8 The growing interest in these systems is due to their potential to enable better predictions of the impact of compounds on the human body and their potential to enable better understanding – in a more systemic way – of how different organs interact with each other under different experimental conditions.
One possible realization of a microphysiological system includes configurable hanging-drop networks (HDNs) that host microtissue spheroids. These systems are aimed at realizing complex multi-organ systems and, in particular, at enabling associated continuous tissue–tissue interactions and molecule exchange.9 Spheroids as three-dimensional tissue models currently experience large interest, as they have been demonstrated to better represent in vivo like conditions with respect to cell morphology and functionality compared to standard 2D cell cultures.10 Further, spheroids simply form by self-aggregation of cells in solution and are easy to handle by using conventional pipetting tools. Spheroids can be derived from different cell types so that a multitude of different organ models based on the same fabrication technology becomes available. Example organ models include liver,11 pancreas,12 heart,13 brain,14 as well as a large variety of spherical tumor models.15–17 Spheroids are predominantly formed by using the hanging-drop technique, in which a drop of cell suspension is pipetted onto a substrate that is subsequently inverted. The cells then sediment to the liquid–air interface of the now hanging drop and start to attach to each other and form the spherical 3D tissue constructs as no surface is present to which they could adhere.
Hanging-drop networks provide an ideal formation and culturing environment for spheroids and include microfluidic channels and other units to interconnect the different drops so as to obtain functional drop networks. Flow through a network of hanging drops can be precisely controlled, which substantially increases the experimental options in using spheroids and paves the way to complex multi-tissue, or so-called “body-on-a-chip” formats. The microfluidics of HDN systems have been realized by patterning hydrophobic rim structures on the surface of a PDMS substrate that is afterwards turned upside down. The rim structures delimit wetted areas and prevent the liquid from spreading over the whole surface. By using circular structures it is therefore possible to define drops; narrow grooves are used for realizing the interconnecting channels, so that bottom-open, complex microfluidic networks of hanging drops can be obtained.
Until now, medium flow in such systems has been controlled by using external pumps and tubing that were connected to the devices. Tubing, however, increases medium volume, bears the risk of compound adsorption at internal surfaces and compromises the ease-of-use and the potential for parallelized experiments. A compact on-chip pump solution would help to overcome these limitations. The integration of a pump into the HDNs should, however, not significantly increase device complexity. The pump should be simple and robust in operation and controllable through a minimal number of control lines. There is a plethora of on-chip micropump designs that have been reported for different applications in the past.18–20 The vast majority of those, however, was designed for driving liquid flow in closed microfluidic systems so that they are of limited use for open microfluidic systems, including the hanging-drop networks.
Here, we present a novel integrated pump concept specifically developed for microfluidic hanging-drop networks. The pump itself is based on a hanging drop and relies on surface tensions at the liquid–air interface to drive liquid through hanging-drop networks. The pump is actuated via a single pneumatic control line and allows for realizing a variety of different flow schemes including physiological pulsatile flow. Pumping units can be operated in several networks in parallel, while all of them rely on the same single actuation line. Larger HDNs can be perfused by using more than one pump stage in serial configurations. Finally, we implemented a feedback control, in which the pump rate has been coupled to the spontaneous contraction of a human iPS-derived cardiac microtissue, which has been included in the system. The aim was to be able to also mimic physiologically induced alterations of the pump rate upon temperature change or compound dosage as they occur in vivo. We then show how external stimuli, e.g., through adding drugs, affect the overall medium flow and related drug distribution in the “body-on-a-chip” multi-tissue HDN system.
Results and discussion
Device architecture
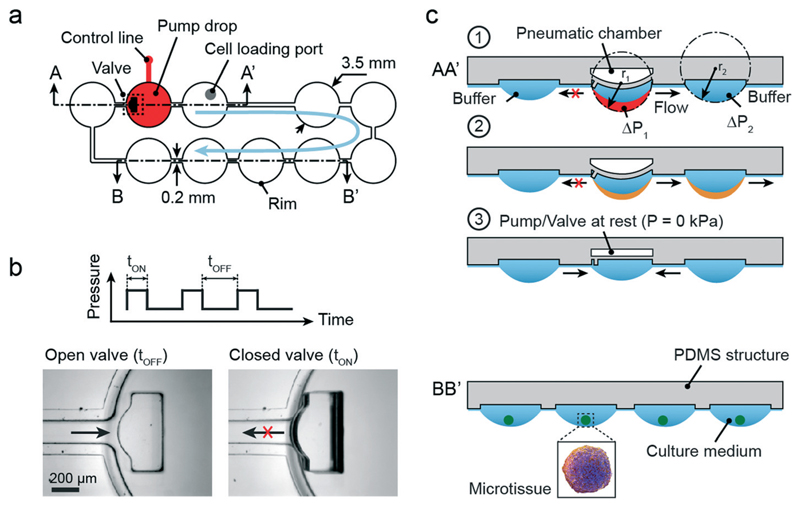
Fig. 1a illustrates the design of a simple microfluidic hanging-drop loop with an integrated pump. The loop consists of 10 hanging drops in a series, each with 3.5 mm base diameter (circular areas) arranged on a 4.5 mm grid (384-well-plate format). The hanging drops are connected through 200 μm-wide microchannels. Hydrophobic PDMS rims confine the liquid and allow for building up the completely open hanging-drop network at the bottom of a substrate. For more details on the concept see reference Frey et al.9 Three of the hanging drops form a pneumatically driven hanging-drop pump (cross-section AA′). The other seven hanging drops can be used to host the microtissue spheroids for investigations (cross-section BB′).
Fig. 1.
Architecture and concept of the integrated micropump in a microfluidic loop of hanging drops. (a) Top view of the design of the hanging-drop network. The pump consists of three drops; seven other drops can be used to culture spheroids. (b) The protocol of the applied pressure for pump actuation is indicated as a square wave and consists of an OFF and ON state, each with a defined duration. The ON state can vary in pressure. Photographs show the open and closed states of the integrated valve. (c) Cross-section AA′ (indicated in Fig. 1a) schematically illustrates the sequence of pump actuation (see text for details); BB′ the drops for spheroid culturing.
Pump concept
The pump is operated by pressurizing a pneumatic chamber (typically 20–60 kPa) located above the center pump drop through a pressure control line (indicated in red in Fig. 1a). The increase of pressure bulges the membrane between pneumatic chamber and drop ceiling (500 μm thick) and closes, at the same time, an integrated valve at the inlet channel of the drop (Fig. 1b). The valve consists of a small PDMS structure with a size of 0.5 mm × 1.2 mm and the same height as the rim structure. The PDMS structure is localized at the edge of the membrane at a distance of 25 μm (membrane in not-deflected position) from the channel inlet; it tilts and blocks the inlet of the channel upon membrane deflection. The blockage increases the fluid resistance and substantially reduces liquid flow to and from the left of the pump drop. Position and shape of the PDMS block have been optimized with respect to optimal inlet closure (see Fig. S1†).
The membrane deflection virtually increases the volume of the drop (indicated in red in Fig. 1c1). When the drop gets bigger (towards a hemisphere), its radius gets smaller. Based on Young–Laplace's equation, ΔP = 2γ/r, the decrease of the radius of the air–liquid interface results in a pressure increase. The resulting pressure difference between drop 1 and drop 2 (ΔP1 > ΔP2) and the simultaneous closure of the valve that prevents back-flow induce a directional flow from the center pump drop to the right neighboring drop (Fig. 1c2, transferred volume shown in orange). The flow is maintained until both radii are the same, and the pressure is equilibrated.
Upon release of the pneumatic pressure, the pump drop membrane returns to the resting state, and liquid from both neighboring drops flows into the center drop thereby restoring equilibrium conditions (Fig. 1c3). This sequence is repeated with each pump stroke, and a uniform flow through the hanging-drop loop in generated. The pump actuation protocol (shown as a square wave function in Fig. 1b) consists of two states maintained for two different durations. The time tON refers to the time when a certain pressure is applied to the pneumatic chamber. In this state the membrane is deflected, and the valve is closed. tOFF stands for the time at resting state when no pressure is applied. The rather thick – and therefore stiff – PDMS membrane ensures short transition times. Different flow schemes can be programmed by varying pressure and state durations.
Integration of flow buffers
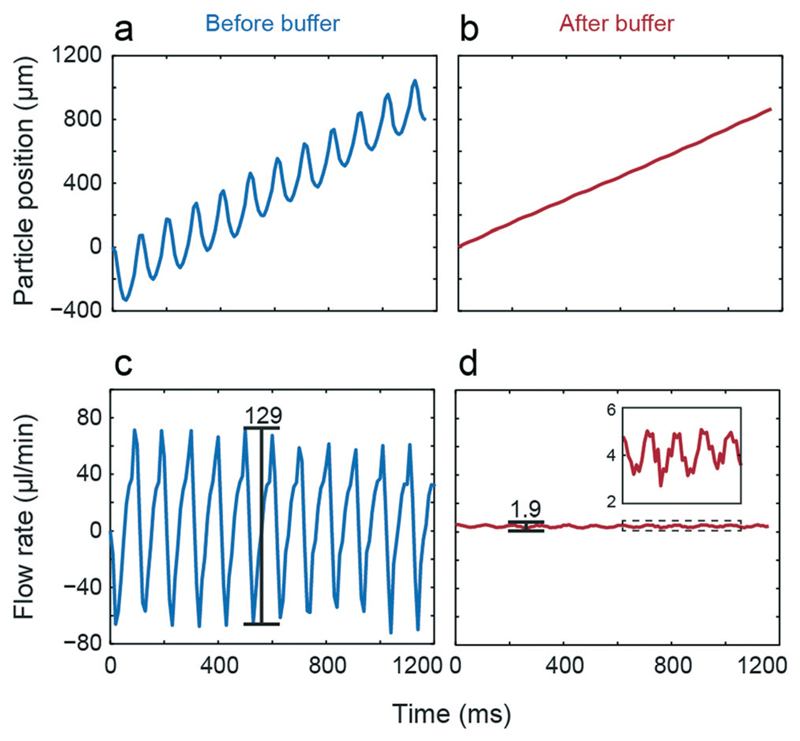
The two drops up- and downstream of the center pump drop are buffers (diameter of 3.5 mm) that act as low-pass filters to reduce flow pulsation. Due to the two discrete membrane states and the design of the valve, the flow is intrinsically pulsatile, which needs to be controlled, or pulsatility needs to be reduced for some applications. Fig. 2 illustrates measured position and calculated flow rate of a tracked particle in the channel after the pump drop versus time using tON = 50 ms and tOFF = 50 ms as actuation protocol. Without buffer (Fig. 2a and c), a large back flow, which is substantially larger than the resulting net flow was observed for every pump stroke. In the presented example, peak-to-peak values larger than 120 μl min−1 were observed at a net flow of 5.6 μl min−1. By integrating the two buffer drops before and after the pump drop the pulsation was drastically reduced (1.9 μl min−1), while the net flow only slight changed compared to non-buffered flow (5.3 μl min−1, Fig. 2b and d with zoomed view of the curve).
Fig. 2.
Influence of buffers. Tracked particle position and corresponding flow rate before (a & c) and after the buffer drop (b & d).
Pump characteristics
Table 1 presents flow rates and peak-to-peak flow pulsation values for different pump actuation protocols. The two input values, tON and tOFF, were varied within a range of 25 ms and 2 s. In all cases, a constant flow rate was achieved after approximately 20 pump strokes. The flow rate was adjustable in a range of 0.5–8 μl min−1 at 40 kPa of applied pressure. Flow rates were in general decreasing with increasing actuation time tON, when keeping tOFF constant. High frequency modes produced much lower pulsation compared to actuation frequencies in the single-digit Hz range. All values presented here were recorded with buffers. It has to be mentioned that these values apply to the specific 10-drop loop depicted in Fig. 1a. For larger networks with, for example, higher flow resistances, lower flow rates are to be expected (see below). Two examples of continuous and pulsatile flow are shown in the ESI† (Movies S1 and S2).
Table 1.
Measured flow rates and pulsation amplitudes for higher and lower pump frequencies (mean values, n > 3). All the experiments were conducted with a total liquid volume of 80 μl, which produces a drop height of 820 μm. The applied pressure was 40 kPa
| tOFF (ms) |
tON (ms) |
||||||
|---|---|---|---|---|---|---|---|
| 25 | 50 | 100 | 200 | 500 | 1000 | 2000 | |
| Flow rate (μl min−1) | |||||||
| 25 | 1.6 | 1.5 | 1.0 | 0.6 | |||
| 50 | 4.5 | 5.3 | 4.9 | 4.1 | |||
| 200 | 7.1 | 7.3 | 6.2 | 4.6 | |||
| 500 | 4.3 | 6.2 | 5.3 | 4.4 | |||
| Peak-to-peak pulsation amplitude (μl min−1) | |||||||
| 25 | 1.4 | 2.9 | 6.1 | 7.1 | |||
| 50 | 5.8 | 10.5 | 16.3 | 20.6 | |||
| 200 | 40 | 47 | 55 | 61 | |||
| 500 | 41 | 50 | 62 | 69 | |||
Influence of the applied pressure
The pressure applied to the pneumatic chamber influences the flow rate. Values for two different pump actuation protocols are illustrated in Fig. S2.† A higher pressure results in a stronger deflection of the membrane and, hence, a larger virtual volume that is added to the pump drop. Higher stroke volumes are therefore expected. For increasing pressures, from 20 to 60 kPa, we observed a linear increase of the flow rates for both actuation protocols that are shown in the graph. Thus, control of the applied pressure provides an additional independent parameter for flow rate adjustment.
Influence of drop volume
We further characterized the relation between flow rate and initial volume of the pump drop. We varied the total volume loaded into the 10-drop loop at the beginning of the experiment between 60 μl and 90 μl and measured resulting flow rates for one frequently used actuation protocol (tON = tOFF = 200 ms: applied pressure of 60 kPa). Note that all drops in the loop have equal size at equilibrium as a consequence of the Young–Laplace law. Moreover, it has to be mentioned that each of the 10 drops consists of two volume parts; the fixed cylindrical recess volume (450 μm deep, 3.5 mm diameter) and the variable hanging-drop volume protruding from the rim structure. Approximately 45 μl volume are contained in the recess and channels. Varying the total chip volume between 60, 70, 80 and 90 μl results in drop heights of 540, 700, 820 and 920 μm, respectively. As can be seen in Fig. S3,† the flow rate variations in dependence of the overall drop size are small. For volumes between 70 and 90 μl the flow rate variation is negligible, for a lower volume (60 μl) the flow rate decreases by approximately 10%.
These findings are important in view of liquid evaporation and small drop volume reductions that may occur for experiments lasting several days; also for these extended time scales a reasonably constant flow rate could be maintained.
Pulsatile flow profiles
An important advantage of the proposed pump concept is that it enables both, constant and pulsatile perfusion at similar flow rates by modifying the pump actuation protocol. This becomes especially interesting, if the pulsatile pump characteristics of the heart should be reproduced to investigate their influence on the behavior of other cell types. The buffer drops enable controlled reduction of the pulsation and allow for simulating different locations and conditions in the body, as blood flow right after the heart and in arteries is strongly pulsatile and becomes more uniform in finer vessels and capillaries.
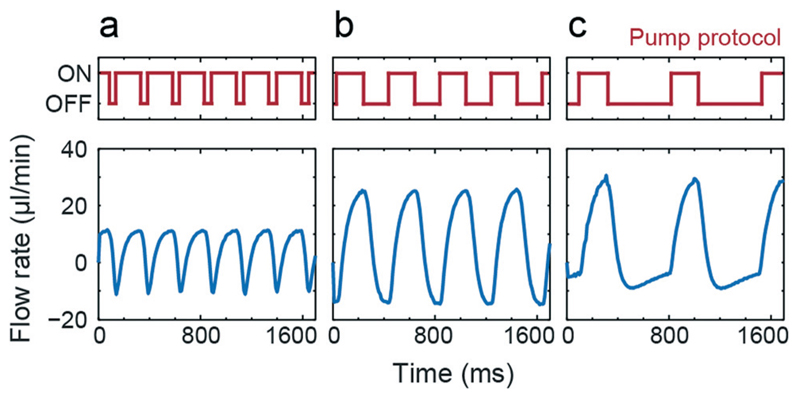
Fig. 3 shows measured flow rates over time for 3 different pump actuation protocols with fixed tON = 200 ms and varying tOFF (50, 200 and 500 ms). Depending on the applied protocol, different amplitudes and pulsation frequencies can be achieved. For all three actuation protocols the overall net flow rate is positive, although there is a flow reversal during the pulse. The figure demonstrates that we are able to generate pulsatile flow of varying characteristic by adjusting the pump actuation protocols.
Fig. 3.
Pulsatile flow. Tuning the shape of the pulsatile flow by regulating the pump actuation protocol tON = 200 ms and tOFF = 50, 200 and 500 ms. Applied pressure was 40 kPa. Resulting net flow rates were (a) 4.11 μl min−1, (b) 7.07 μl min−1, and (c) 4.3 μl min−1.
Parallelization
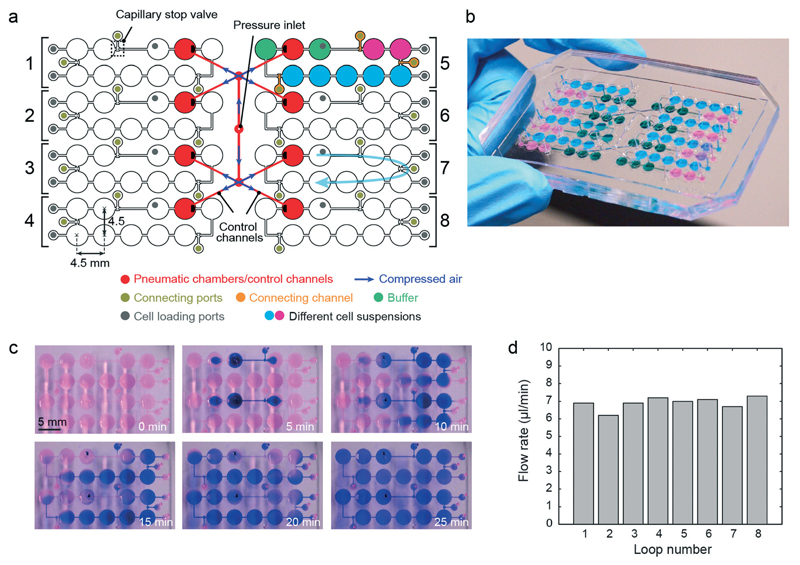
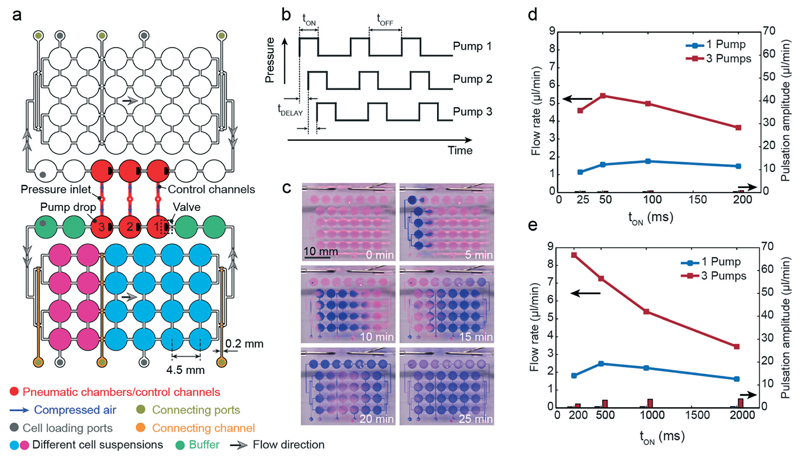
The proposed pump concept requires only a single pneumatic actuation line for flow actuation in a closed hanging-drop loop. In a next step, we designed a platform consisting of 8 independent hanging-drop loops (Fig. 4a). Their architecture is the same as that in Fig. 1a. The 8 loops have been placed side-by-side so that all drops and inlet ports are located on a 384-well plate grid (i.e., 4.5 mm pitch). This arrangement makes the device compatible with multichannel pipets (9 mm pitch between inlet ports of neighboring loops) to facilitate convenient medium and cell suspension loading and automated readout.
Fig. 4.
Parallel network. (a) Design of the integrated pumping system in parallel hanging-drop networks. (b) Photograph of the device filled with differently colored liquids as schematically shown in (a). The chip was rotated by 180°. (c) Time-lapse images of blue ink circulating in 2 independent loops of the 8-loop platform using the integrated micropump. Each loop was initially loaded with diluted red dye in DI water, and before the pump sequence was started (t = 0 min), 4 μl of blue ink were added to the buffer drop after the pump drop through the loading port using a multi-channel pipet (tON = tOFF = 50 ms). (d) Flow rates simultaneously generated in 8 independent HDN loops (tON = tOFF = 200 ms; applied pressure of 40 kPa; device was filled with 80 μl DI water with suspended beads).
The four left loops are mirrored with respect to the ones on the right. Each loop consists of 3 sub-networks, shown in 3 different colors in loop number 5: a pump unit (3 drops), a 2-drop unit and a 5-drop unit. The pump unit includes the pump drop (red) and the 2 adjacent buffer drops (green). The other seven drops have been arranged in groups of 2 and 5 drops in series (pink and blue color), and can be loaded with microtissues derived from different cell types so that multi-tissue experiments can be carried out. The 3 sub-networks are initially separated from each other through capillary stop valves.9 After cell suspensions have been loaded into the microfluidic network via loading ports, the sub-networks have been fluidically interconnected through opening of the capillary stop valves by supplying a small amount of liquid through the respective connecting ports. A fully loaded chip with differently colored liquids for better illustration is shown in Fig. 4b.
The integrated pump is identical to the one presented above. The eight pneumatic chambers, however, are symmetrically connected to a single pressure inlet in the center through control channels (shown in red). All pneumatic chambers and control channels are identical and have the same dimensions. This layout allows for uniform distribution of compressed air and ensures equal actuation frequencies and membrane deflection heights and, consequently, identical flow rates in all eight loops. With the proposed layout, eight independent hanging-drop loops can be operated in parallel with only one pneumatic control line. Thus, eight multi-tissue experiments can be carried out at the same time in the same environment, which then allow for parallel investigation of, for example, the effects of different drug candidates and/or concentrations under identical culturing conditions. For illustration purposes we added blue ink in two of the loops, which was then circulated with the same flow rate (Fig. 4c). Once the pump actuation started, a clockwise flow was generated in both loops, and the blue ink was transported along the drops and channels through the system. We measured the flow rate variation among the different loops on the same platform. The relative variation was below 10% (Fig. 4d), which demonstrates the performance uniformity of the integrated pumping system in controlling the flow rate in different subnetworks.
Large networks
We further investigated, if the proposed pumping scheme is able to drive larger hanging-drop networks. Fig. 5a shows two arrays of 4 × 6 drops. The arrays are again separated into two sub-networks, shown in 2 different colors (pink 2 × 4, blue 4 × 4) to represent different spheroid types. Two adjacent pump lanes were used to operate the arrays. Since the network is larger compared to the 10-drop loop and consists of a higher number of drops and channels, the total hydraulic resistance is higher. Thus, three identical micropump drops were integrated in series in a row (red). In addition, we implemented two buffer drops before and after the pump drops (green). The circulation in the lower and upper networks is intended to be counter-clock wise and clock wise, respectively. In each drop row, the flow rate is a fourth of the overall flow generated by the pump due to the flow splitting.
Fig. 5.
Large networks. (a) Layout of the integrated pump system of a large hanging-drop array of 24 drops. (b) Actuation protocol of the three micropumps in series. (c) Time-lapse images showing the circulation of a small volume of blue ink, added to the buffer drops at the left within one of the hanging-drop subnetworks (tON = tOFF = 200 ms, applied pressure of 40 kPa, initial volume of 250 μl, see also Movie S3†). Characteristic flow rates and pulsation amplitudes in the 4 × 6 hanging-drop subnetwork in dependence of the pump actuation protocol are presented in (d) for tOFF = tDELAY = 50 ms and in (e) for tOFF = tDELAY = 200 ms.
The three integrated pump drops of both arrays are actuated in a defined sequential protocol (Fig. 5b). Compared to the single-drop pump, an additional parameter, tDELAY, was required to define the time shift between the pump strokes of the three individual pump drops.
The 3-drop pump was able to drive liquid through the whole array as illustrated in Fig. 5c by using ink. Movie S4† shows circulation of beads through the complete network. For characterization, different actuation modes have been investigated. First, tOFF and tDELAY were set to tOFF = tDELAY = 50 ms and tOFF = tDELAY = 200 ms and tON was varied. Then, pump tests were performed by activating only a single or all three pumps for comparison (Fig. 5d and e). By using only one pump, flow rates of up to 3 μl min−1 could be achieved (blue lines). By actuating all 3 pump drops, we were able to cover a range of flow rates from 2 μl min−1 to up to 9 μl min−1. By integrating 2 buffer drops before and after the pump drops, flow pulsation could be strongly reduced for all actuation protocols.
Real-time closed-loop pump regulation using a beating cardiac microtissue
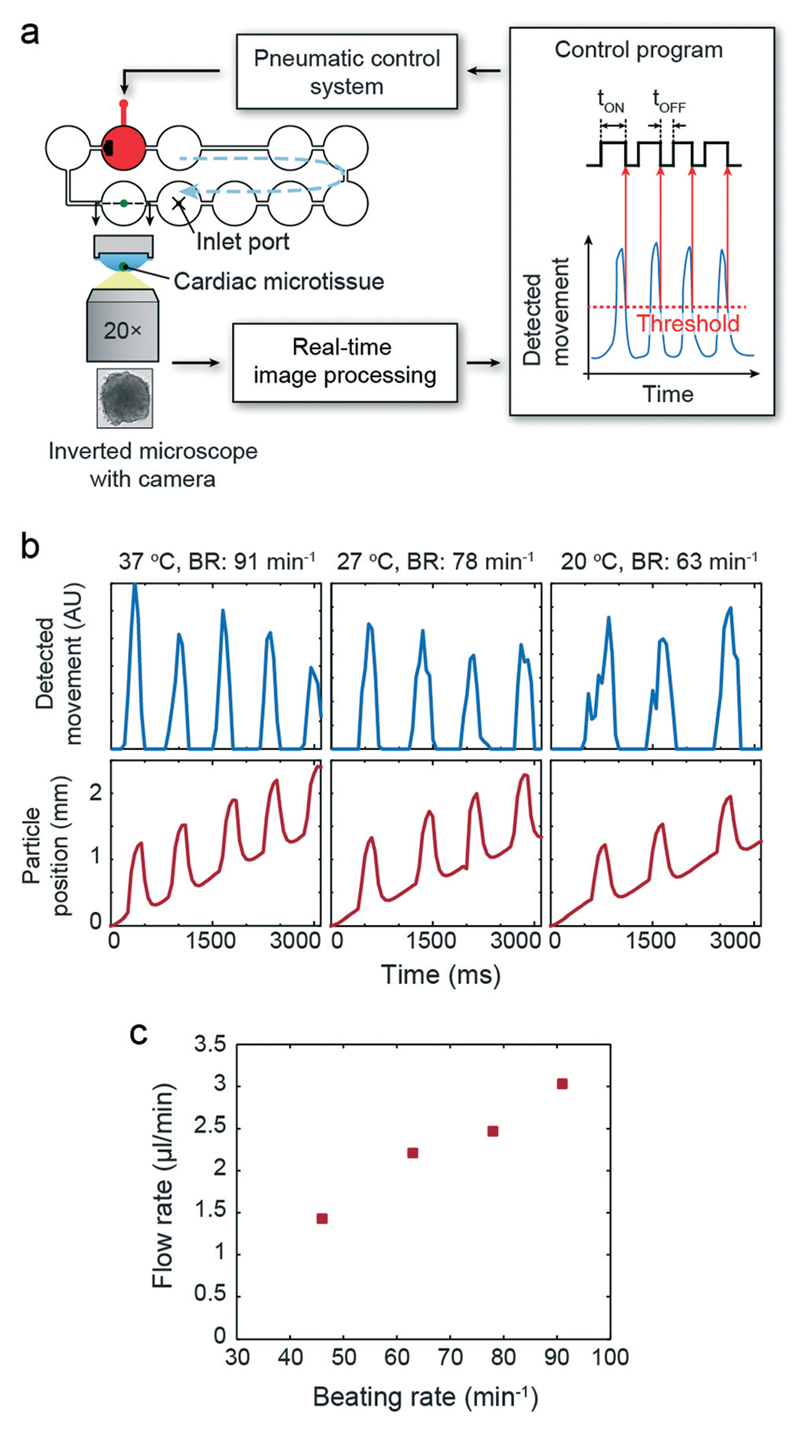
The previous results illustrated the performance of the integrated hanging-drop pump with respect to flow and pulsation control. In the human body, blood flow is generated by the heart and regulated mainly over the beating frequency in response to nutrient and oxygen demands in the periphery of the body. In order to simulate such physiological behavior, we developed a feedback control loop, which has been used to synchronize pulsatile pump actuation with the beating of a human iPS-derived cardiac microtissue (hCdMT), which was cultured in the very same hanging-drop loop and which was capable to reproduce a physiological response upon temperature changes and drug exposure. Pump actuation was triggered for every microtissue contraction, and any variation in the microtissue beating rate was directly translated into pump actuation frequency. The flow characteristics and profile then changed accordingly in real-time.
One hCdMT was placed in the indicated hanging drop of the single hanging-drop loop with one pump unit (Fig. 6a). A high-speed camera was used to monitor the hCdMT, and online image processing was performed to detect the contractions. The output was continuously used to control the pump actuation protocol; tOFF was kept constant at 200 ms, whereas tON was adapted with regards to the contraction characteristics of the cardiac microtissue. Fig. 6b presents time courses of the image processing output showing contraction peaks and particle traces in the liquid flow in the channel after the pump unit. The pulsatile flow-peaks nicely correlate with beating of the cardiac microtissue. As visible in the Movie S5† the hCdMT did not move due to liquid drag of the pulsatile flow, which would otherwise have interfered with the detection of microtissue contraction movements.
Fig. 6.
Regulated flow driven by a cardiac microtissue. (a) Schematic view of the setup with feedback loop. b) Synchronized beating of the hCdMT and flow (particle position) generated by the integrated micropump at 3 different culture medium temperatures corresponding to 3 different beating rates. (c) Relation between beating rate and generated flow rate (applied pressure of 20 kPa, initial volume of 80 μl).
We then continuously decreased the temperature from 37 °C to 20 °C in the HDN setup, which induced a reduction of cardiac beating frequency.13 As expected, the slower beating did result in correlated slower pump actuation and, hence, flow pulsation. The flow rate in the hanging-drop loop was reduced accordingly (Fig. 6c).
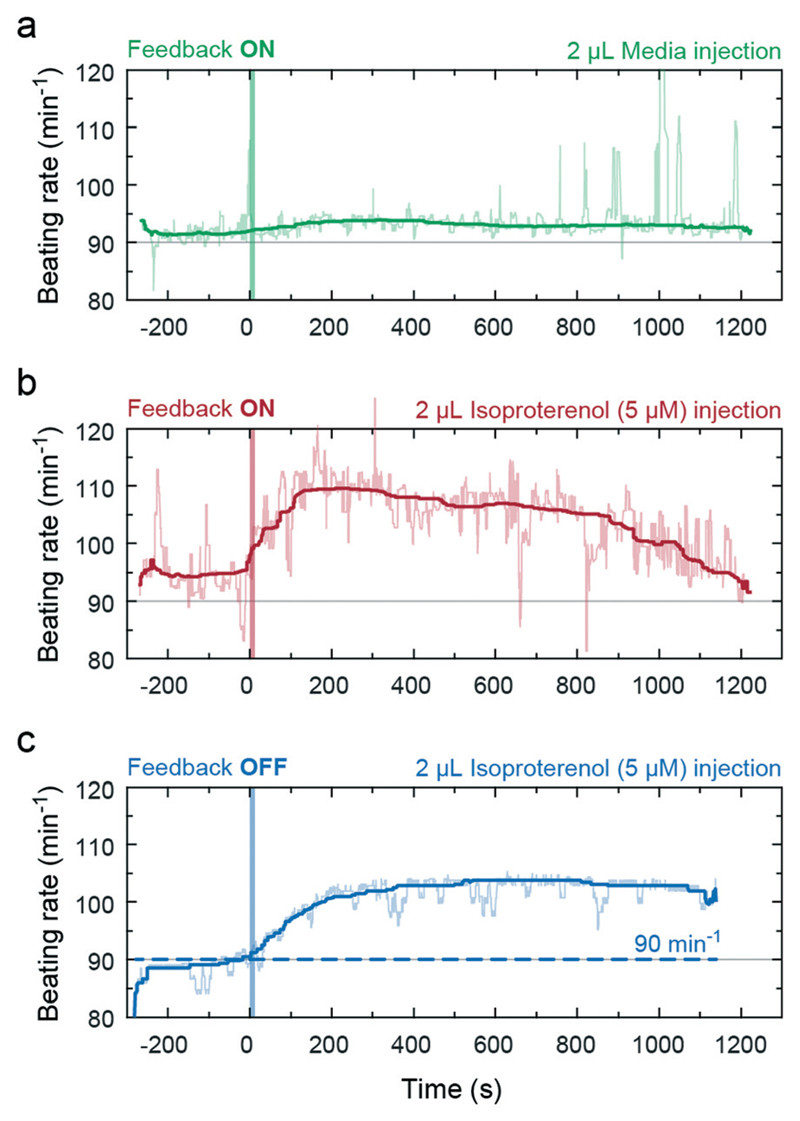
In a second experiment in the same setup, we infused isoproterenol into the drop preceding the drop hosting the cardiac microtissue (inlet port indicated in Fig. 6a). Isoproterenol is a known beta-adrenergic receptor agonist, which increases the heart rate, as already has been demonstrated with hCdMTs.13 The goal here was to closely simulate spreading and clearance of the drug in the system in dependence of the effect of the drug on the heart beating or liquid pumping rate by using the implemented feedback. The infusion of 2 μl of bare medium did not affect the beating rate (Fig. 7a). Upon infusing a 2 μl aliquot of isoproterenol (5 μM) we observed a clear increase in beating rate (Fig. 7b) as soon as the drug reached the cardiac microtissue. The larger beating rate produced an increased liquid flow, which rapidly transported more of the compound towards the drop containing the cardiac microtissue. The sustained larger pump rate in the loop then promotes clearance of the drug from the drop with the hCdMT and transport to downstream drops and dilution in the overall medium volume of the liquid-phase loop. As a result we observed an expected reduction of the beating rate to approximately the initial value within about 20 minutes. The integration of the feedback accelerated this clearance and distribution effect, because the pump rate was increased due to the stimulation of the hCdMT. Switching off the feedback and setting the pump actuation to a constant rate, independent of the stimulation, resulted in a longer duration of high beating rates and slower recovery of the hCdMT to the state before drug exposure (Fig. 7c).
Fig. 7.
Biochemical stimulation of the hCdMT in the feedback-controlled hanging-drop loop. Infusions at t = 0 are indicated by a vertical line. (a) No effect on the beating rate was observed when medium alone is infused in a control experiment. (b) Increase and decrease of beating rate and the feedback-coupled perfusion rate upon adding 2 μl of isoproterenol (5 μM in medium, 10 μl min−1) in the preceding drop. The 2 μl aliquot was diluted to 1 μM when infused (10 μl drop volume). (c) Increase and slow decrease of the beating rate upon adding 2 μl of isoproterenol without feedback control. The pump rate was constant and set to 90 strokes per minute (dashed line) (all curves have been smoothed using median filtering; applied pressure was 50 kPa, initial volume was 100 μl).
The functional coupling of the pump rate in the microfluidic system to the contraction of the cardiac microtissue thus offers the possibility of better simulating and mimicking physiological effects. Substances, either introduced to the microphysiological system from outside or produced in the system by other organ models (e.g. metabolites) that have an effect on cardiac tissue will also directly influence medium circulation, as it would be the case in vivo. The corresponding systemic changes and impact of the respective substances can be assessed.
Methods
Microfluidic device fabrication
All microfluidic devices were fabricated by using multilayer soft lithography (see Fig. S4† for the detailed, schematic fabrication and assembly process). The devices consist of two poly(dimethylsiloxane) layers (PDMS, Sylgard 184, Dow Corning Corp., USA), which were aligned and bonded to each other (see ESI† for fabrication process). The masters for molding both layers, the pneumatic pump layer and hanging-drop network (HDN) layer, consisted of SU-8 100 negative photoresist (MicroChem Crop., USA), which was spin coated on 4 inch silicon wafers to achieve photoresist layers of 200 and 250 μm thicknesses. After softbake of each layer, the wafers were exposed to ultraviolet light through foil masks to initiate crosslinking followed by post-exposure baking. The wafers were subsequently developed for 30 min in SU-8 developer (mrDev 600, micro resist technology GmbH, Germany). Before replica molding, wafers were coated with trichlorosilane (Sigma-Aldrich, Switzerland) to reduce adhesion.
Microfluidic devices were casted from PDMS. PDMS base and curing agent were mixed at a ratio of 10 : 1 and degassed before pouring the mixture onto the SU-8 mold. The upper pneumatic pump layer had a thickness of approx. 6 mm in order to provide the required mechanical stability for the device. The lower HDN layer was adjusted to 1 mm so that a pump membrane thickness of 500 μm was obtained. PDMS was cured at 80 °C for 2 hours. The micropatterned replicas were cut and peeled off the SU-8 mold. An inlet hole for the control line was punched into the pump layer. After oxygen plasma activation, the pump layer was precisely aligned and irreversibly bonded onto the HDN layer. Then, liquid inlet ports were punched through the bonded layers to be able to supply medium and/or cell suspensions. Prior to device usage, the surface of the HDN layer was covered with a PDMS layer with openings at the drop areas and then activated with oxygen plasma in order to increase wettability of the PDMS. In this way, only the surfaces that came in contact with liquid were rendered hydrophilic, whereas rim structures were kept hydrophobic and prevented liquid overflow. The PDMS devices were either affixed to a custom-made chip holder or placed onto PDMS spacers inside a polystyrene box.
Experimental setup
Characterization tests were performed on an inverted microscope (Olympus IX81 and Nikon Ti Eclipse) using a 5× (and 4×, respectively) objective in bright-field mode. To minimize evaporation of the liquid from the hanging drops during experiments, microfluidic devices were placed into a closed humidified chamber. A single tube connected the pneumatic control line to pneumatic chamber(s). The control line was connected to a 3/2-way miniature solenoid valve (Festo AG, Germany) controlled via a data acquisition (DAQ) device (National Instruments) operated by LabVIEW programming software in initial experiments, or control commands were sent via USB to a custom-designed printed circuit board (PCB) in subsequent experiments. A pressure controller (DPI 520, GE Druck, USA) was used to regulate the applied positive pressure. Liquid was infused through tubing by connecting one inlet port to a syringe controlled by a precision syringe pump (neMESYS, Cetoni GmbH, Germany).
Particle tracing
For characterization experiments, the hanging-drop loops were filled with a suspension containing micro-beads (5 μm diameter) in de-ionized water. Particles were traced along the length of the channels downstream of the pump drops by using a digital camera (ORCA-Flash 4.0, Hamamatsu, Japan) with an image acquisition rate of 100 frames per second. Imaris software was used to automatically extract the changes in particle positions and speeds. All data represent mean values of 10–20 traced particles within a defined window of interest (150 μm wide, 25 μm distance from channel walls).
Closed-loop actuation
The closed-loop valve controller setup included the microscope, a digital camera (Leica DFC340FX, Switzerland), a controller application on the PC, and custom-made valve driver hardware. The camera was used to acquire the microscopic images of the beating cardiac tissue, and these images were transferred to the PC. A motion detection application was implemented in C# to detect the cardiac tissue beating from the acquired images. In short, image frames were captured from a selected area on the screen (microscope live image) every 100 ms, and each frame was subtracted from a predefined image (spheroid at rest). The gray-value differences of all pixels of the obtained differential image were summed up, and a pump actuation command was sent to the valve driver when the value exceeded a user-defined threshold (code available under DOI: 10.5281/zenodo.30669).
All closed-loop actuation experiments were performed on a Leica DMI6000 inverted microscope comprising an environmental box for temperature control and a stage-top incubator for CO2 and humidity control (Life Imaging Services, Switzerland). For the proof-of-principle results in Fig. 6b and c, the feedback experiments needed to be split into two experimental sequences, because cardiac spheroid imaging and particle tracing could not be done simultaneously. The reason is that the respective monitoring areas are at different locations on the chip and could not be imaged in the same field of view of the camera. We therefore first recorded the cardiac beating for 30 seconds, while the pump was operating in feedback mode. We then replayed the movie on the screen right after with the same feedback settings to image the particles and analyze the flow. No change in beating behavior was observed during that time. All other feedback experiments were executed in real time.
Spheroid cultures
Human iPS-derived cardiac microtissue spheroids and cardiac maintenance medium were obtained from InSphero AG, Zurich, Switzerland. For experiments, a pre-formed spheroid was inserted into one of the hanging drops by manual pipetting. The characteristic beating frequency of those spheroids was in the range of 60 to 90 bpm at 37 °C, which is very similar to the range of beating frequencies of human hearts.
Conclusion
Design, fabrication, and characterization of a novel micropump for completely open microfluidic systems have been presented. The concept of using the liquid–air interface forces to actuate pressure-driven flow enables seamless integration of the pump into hanging drop networks without increasing fabrication complexity. Pump operation can be controlled via a single pneumatic line, and parallel actuation of several drop arrangements on the same chip is possible. Simultaneous unidirectional fluid flow in up to 8 independent hanging-drop networks as well as fluid flow in larger hanging drop arrays has been presented. The developed technique offers great potential for parallel and multi-tissue experiments in hanging drop networks.
By using the pump in feedback with a beating cardiac microtissue in the HDN, the function and characteristic behavior of a heart can be simulated, which constitutes a further step towards microphysiological, or so-called “body-on-a-chip” systems. This approach opens a route to investigate the impact of compounds on the heart itself and, additionally, the impact on other organ models in the system as a consequence of alterations in liquid circulation. Temperature reduction in the system, e.g., reduced the cardiac tissue beating frequency, which in turn reduced the pump rate and reproduced the respective physiological effect. We also biochemically stimulated the heart tissue in the HDN system and could not only see the direct effect on the tissue – an increased beating rate – but also its functional effect on the whole system – in this case a faster clearance of the stimulating drug from the heart environment as a results of the increased pump rate.
Very different concepts have been applied before to integrate heart functions on-chip.21–23 The approach proposed here provides seamless integration of a 3D heart organ model, capable to closely mimic in vivo like conditions and tissue responses upon, e.g., dosage of compounds, as well as the major function of the heart – pumping of liquid to the different organ models. This holds particularly true, as the two features are interdependent in an organism: any response of cardiac tissue to a substance will inherently alter the pumping characteristics and the supply of liquid and nutrients to the other organs.
Supplementary Material
† Electronic supplementary information (ESI) available. See DOI: 10.1039/c5lc01000d
Acknowledgements
Financial support was provided by a European Union FP7 grant ‘Body on a chip’ ICT-FET-296257, an individual Ambizione Grant 142440 of the Swiss National Science Foundation for Olivier Frey and the ERC Advanced Grant “NeuroCMOS” under contract number AdG 267351. Amir Shadmani received individual support through the Marie Curie Research Training Network “EngCaBra” (grant agreement no. 264417). We would like to thank InSphero AG, Switzerland, for providing human iPS-derived cardiac microtissues (hCdMT) and culture medium. We also thank D-BSSE Single Cell Facility and the Cleanroom Facility at ETH Zurich for assistance in microscopy and microfabrication. The authors are grateful to Christian Zuppinger, University of Bern, for suggesting the use of isoproterenol for cardiac tissue stimulation.
References
- 1.Alépée N, Bahinski A, Daneshian M, De Wever B, Fritsche E, Goldberg A, Hansmann J, Hartung T, Haycock J, Hogberg HT, Hoelting L, et al. State-of-the-Art of 3D Cultures (Organs-on-a-Chip) in Safety Testing and Pathophysiology. ALTEX. 2014;4(31):441–477. doi: 10.14573/altex1406111. [DOI] [PMC free article] [PubMed] [Google Scholar]
- 2.Esch MB, Smith AST, Prot J-M, Oleaga C, Hickman JJ, Shuler ML. Adv Drug Delivery Rev. 2014;69–70:158–169. doi: 10.1016/j.addr.2013.12.003. [DOI] [PMC free article] [PubMed] [Google Scholar]
- 3.Bhatia SN, Ingber DE. Nat Biotechnol. 2014;32:760–772. doi: 10.1038/nbt.2989. [DOI] [PubMed] [Google Scholar]
- 4.Sung JH, Kam C, Shuler ML. Lab Chip. 2010;10:446–455. doi: 10.1039/b917763a. [DOI] [PubMed] [Google Scholar]
- 5.van Midwoud PM, Merema MT, Verpoorte E, Groothuis GMM. Lab Chip. 2010;10:2778–2786. doi: 10.1039/c0lc00043d. [DOI] [PubMed] [Google Scholar]
- 6.Zhang C, Zhao Z, Abdul Rahim NA, van Noort D, Yu H. Lab Chip. 2009;9:3185–3192. doi: 10.1039/b915147h. [DOI] [PubMed] [Google Scholar]
- 7.Wikswo JP, Curtis EL, Eagleton ZE, Evans BC, Kole A, Hofmeister LH, Matloff WJ. Lab Chip. 2013;13:3496–3511. doi: 10.1039/c3lc50243k. [DOI] [PMC free article] [PubMed] [Google Scholar]
- 8.Huh D, Torisawa Y, Hamilton GA, Kim HJ, Ingber DE. Lab Chip. 2012;12:2156–2164. doi: 10.1039/c2lc40089h. [DOI] [PubMed] [Google Scholar]
- 9.Frey O, Misun PM, Fluri DA, Hengstler JG, Hierlemann A. Nat Commun. 2014;5:4250. doi: 10.1038/ncomms5250. [DOI] [PubMed] [Google Scholar]
- 10.Pampaloni F, Reynaud EG, Stelzer EHK. Nat Rev Mol Cell Biol. 2007;8:839–845. doi: 10.1038/nrm2236. [DOI] [PubMed] [Google Scholar]
- 11.Messner S, Agarkova I, Moritz W, Kelm JM. Arch Toxicol. 2013;87:209–213. doi: 10.1007/s00204-012-0968-2. [DOI] [PMC free article] [PubMed] [Google Scholar]
- 12.Zuellig RA, Cavallari G, Gerber P, Tschopp O, Spinas GA, Moritz W, Lehmann R. J Tissue Eng Regener Med. 2014;4:524–531. doi: 10.1002/term.1891. [DOI] [PubMed] [Google Scholar]
- 13.Beauchamp P, Moritz W, Kelm JM, Ullrich ND, Agarkova I, Anson B, Suter TM, Zuppinger C. Tissue Eng, Part C. 2015;21(8):852–861. doi: 10.1089/ten.TEC.2014.0376. [DOI] [PubMed] [Google Scholar]
- 14.Urich E, Patsch C, Aigner S, Graf M, Iacone R, Freskgård P-O. Sci Rep. 2013;3:1500. doi: 10.1038/srep01500. [DOI] [PMC free article] [PubMed] [Google Scholar]
- 15.Thoma CR, Zimmermann M, Agarkova I, Kelm JM, Krek W. Adv Drug Delivery Rev. 2014;69–70:29–41. doi: 10.1016/j.addr.2014.03.001. [DOI] [PubMed] [Google Scholar]
- 16.Amann A, Zwierzina M, Gamerith G, Bitsche M, Huber JM, et al. Development of an Innovative 3D Cell Culture System to Study Tumour - Stroma Interactions in Non-Small Cell Lung Cancer Cells. PLoS One. 2014;9(3):e92511. doi: 10.1371/journal.pone.0092511. [DOI] [PMC free article] [PubMed] [Google Scholar]
- 17.Rimann M, Laternser S, Gvozdenovic A, Muff R, Fuchs B, Kelm JM, Graf-Hausner U. J Biotechnol. 2014;189:129–135. doi: 10.1016/j.jbiotec.2014.09.005. [DOI] [PubMed] [Google Scholar]
- 18.Iverson BD, Garimella SV. Microfluid Nanofluid. 2008;5:145–174. [Google Scholar]
- 19.Au AK, Lai H, Utela BR, Folch A. Micromachines. 2011;2:179–220. [Google Scholar]
- 20.Byun CK, Abi-Samra K, Cho Y-K, Takayama S. Electrophoresis. 2013:245–257. doi: 10.1002/elps.201300205. [DOI] [PubMed] [Google Scholar]
- 21.Agarwal A, Goss JA, Cho A, McCain ML, Parker KK. Lab Chip. 2013;13:3599–3608. doi: 10.1039/c3lc50350j. [DOI] [PMC free article] [PubMed] [Google Scholar]
- 22.Mathur A, Loskill P, Shao K, Huebsch N, Hong S, Marcus SG, Marks N, Mandegar M, Conklin BR, Lee LP, Healy KE. Sci Rep. 2015;5:1–7. doi: 10.1038/srep08883. [DOI] [PMC free article] [PubMed] [Google Scholar]
- 23.Tanaka Y, Sato K, Shimizu T, Yamato M, Okano T, Kitamori T. Lab Chip. 2007;7:207–212. doi: 10.1039/b612082b. [DOI] [PubMed] [Google Scholar]
Associated Data
This section collects any data citations, data availability statements, or supplementary materials included in this article.


