

Abstract
In this issue of Cancer Cell, Murphy et al. describe a mouse model designed to examine the biological effects of different levels of deregulated c-myc expression. They provide evidence that distinct threshold levels of Myc are required for increased proliferation and for apoptosis in different tissues.
The myc gene family encodes essential transcription factors whose expression is altered in a wide variety of human cancers. In nearly all tissues, normal proliferating cells express low levels of myc RNA and protein in response to a broad range of mitogenic stimuli. The vast majority of cancer-associated genetic changes in myc are associated with noncoding regulatory regions rather than protein-coding sequences. This has led to the argument that it is the deregulation of myc expression, as opposed to a change in Myc protein functionality, that is important in tumorigenesis. Deregulation can take several forms: for example, Myc may remain at or near normal levels but be resistant to modulation in response to appropriate signals. Alternatively, Myc may be highly overexpressed as well as resistant to regulation. In other words, in tumors, Myc is “locked on” at either high or low levels. In terms of Myc's ability to promote tumorigenesis, we would like to know whether it is the absolute level of expression or the inability to control expression, or both, that is most important.
There is ample evidence that maintaining precise levels of Myc is an important matter in cells. Myc abundance is regulated at transcriptional, posttranscriptional, and posttranslational levels in response to numerous mitogenic signal transduction pathways. Given the high rate of synthesis and turnover of myc mRNA and protein, it can be argued that the concentration of Myc at any moment serves as a sensor and integrator of the signaling environment, converting external and internal input into gene expression programs (for recent review, see Eilers and Eisenman, 2008). Yet we do not know specifically how different levels of Myc are “interpreted” by cells. Studies of myc loss-of-function alleles have indicated that at least some Myc is necessary for cellular function. Knockout of myc family genes in rodent fibroblasts and numerous other cell types rapidly inhibits or attenuates proliferation. However, in rat fibroblasts, heterozygosity at the c-myc locus causing a 50% reduction in c-Myc levels results in only a modest decrease in cell proliferation, while transformation by activated Ras or Raf is severely compromised (Bazarov et al., 2001). In contrast, Myc overexpression results in multiple changes in cell behavior. An important aspect of the cellular response to overexpressed Myc is the activation of apoptotic and senescence pathways that function as tumor-suppressive barriers to limit Myc's hyperproliferative signal (Grandori et al., 2003; Green and Evan, 2002). Nonetheless, such barriers tend to collapse during tumor progression. Because myc expression can vary widely, an important question is whether there exist distinct thresholds of response to increasing levels of Myc.
In this issue of Cancer Cell, Murphy and colleagues (Murphy et al., 2008) describe a mouse model in which they analyze the effects of relatively low levels of deregulated c-Myc. The authors employed an inducible MycER fusion protein constitutively expressed under the control of the Rosa26 locus (R26lsl-MER mice). In this system, MycER is turned on by expression of Cre recombinase, resulting in expression of an inactive form of Myc protein. MycER is then acutely activated when mice are administered 4-hydroxyta-moxifen ligand. The amounts of Myc expressed from the Rosa26 locus were dependent on gene dose: mice expressing two deregulated alleles of c-myc (R26MER/MER) expressed approximately twice as much c-myc RNA in all tissues examined as mice containing one deregulated allele (R26MER/WT). Note that because in most cases it is c-myc RNA that is being quantified, an implicit assumption is that differences in mRNA levels are reflected by roughly equivalent differences in Myc protein levels. In the pancreas R26MER/WT and R26MER/MER mice expressed a 1.5- and 2-fold increase, respectively, over physiologic levels of Myc. In mice harboring one deregulated allele (R26MER/WT), there was no measurable increase in cell proliferation in the pancreas, indicating that this amount of Myc did not demonstrably alter cell physiology. However, in mice with two deregulated c-myc alleles (R26MER/MER), a robust increase in cell proliferation was observed in the pancreas. Therefore, an increase of between 1.5- and 2-fold over endogenous Myc appears to be the amount required in vivo to stimulate pancreatic cell proliferation. The absolute levels of deregulated c-myc expressed from the Rosa26 locus varied considerably between tissues. However, in most tissues, two deregulated c-myc alleles (R26MER/MER) were required to increase cell proliferation. Furthermore, the augmented proliferation seen in the lungs of R26MER/MER mice (which expressed ˜5-fold increased Myc) was sufficient to induce hyperplasia, and when these mice were crossed with a mouse strain harboring a conditional activated Ras mutation (RasG12D), frank lung tumors were generated.
Apoptosis, through activation of the ARF-Mdm2-p53 pathway, is a common outcome of Myc deregulation and a critical barrier to Myc-dependent oncogenesis. A particularly intriguing finding by Murphy et al. is that apoptosis was not activated in most tissues of the R26MER/MER mice, indicating that modestly increasing Myc abundance and stimulating proliferation does not activate this important mechanism of tumor avoidance. Consistent with this finding, the tumor suppressor ARF was not activated despite high levels of proliferation and hyperplasia. However, apoptosis was readily detected when these same mice were given doxorubicin. This indicates that the mice were sensitized to apoptotic stimuli by a 2-fold increase in Myc and suggests that the Myc-induced apoptotic program, while not overtly activated, was in some way “primed” and required additional signals to become manifest. Furthermore, when the authors constitutively expressed large amounts of Myc (15-fold over endogenous levels) in the pancreas, proliferation, ARF, and apoptosis were activated. Therefore, somewhere between a 2- and 15-fold increase in the levels of deregulated Myc is required to provoke an apoptotic response. This is consistent with the finding that in R26MER/MER mice, the colonic epithelium, which expresses considerably higher Myc levels than other tissues, shows ARF activation and apoptosis.
This study raises important questions concerning the mechanisms underlying the differential cellular response to relatively small variations in Myc levels. Myc, primarily in association with its obligate dimerization partner Max, has been reported to bind on the order of 15% of genomic loci and to cause widespread changes in gene expression (Fernandez et al., 2003; Orian et al., 2003). What targets of Myc are turned on when Myc expression is approximately twice its physiologic amount and proliferation is increased? One possibility is that more Myc simply amplifies the same transcriptional response induced by lower levels of Myc. Another is that increased levels of Myc result in binding to new sites and an expansion of the transcriptional response—an idea that has received some support from genomic binding studies (Fernandez et al., 2003; Zeller et al., 2006) (Figure 1). Increasing levels of Myc may also trip other cellular switches, for example by inducing or inhibiting clusters of micro RNAs (Lotterman et al., 2008), interacting with other transcription factors, or stimulating DNA replication (Dominguez-Sola et al., 2007).
Figure 1. Differential Effects on Target Gene Expression by Endogenous and Deregulated Myc.
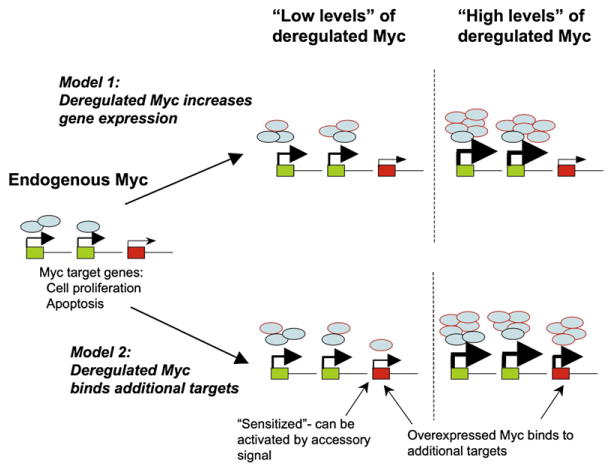
Two models for how different levels of Myc influence gene expression programs. Myc protein expressed at physiologic levels (depicted as blue ovals) from the endogenous myc locus occupies promoters of target genes (green boxes) and activates gene expression. Arrowhead size corresponds to relative level of expression. Some potential Myc target genes (red boxes) are not bound or activated by endogenous or low levels of Myc (e.g., due to low-affinity Myc binding sites). Following deregulation, low or high levels of Myc protein (shown as blue ovals with red borders) may either bind and amplify expression of the same Myc target genes as endogenous Myc (model 1) or bind and increase expression of additional Myc targets (model 2). At low Myc levels, the new targets may become “sensitized” in that other signaling pathways can cooperate with Myc to activate gene expression, a requirement that may not be necessary at high levels of Myc. Myc target genes in the apoptotic pathway may be examples of this effect.
The work of Murphy et al. may have disappointing implications for cancer therapies based on reducing Myc protein levels. Studies using the kinase inhibitor imatinib indicate that even partial inhibition of oncogene function may achieve remission of some tumors. However, while antisense or drug-based inhibition of Myc will suppress the high Myc levels found during progression of many tumors, the residual levels of Myc may be sufficient to drive proliferation of cells that now have an attenuated apoptotic response. From the therapeutic point of view, it may be considerably more important to elucidate, and then find ways to inhibit, the specific transcriptional targets of Myc that are most critical for tumorigenesis.
References
- Bazarov AV, Adachi S, Li SF, Mateyak MK, Wei S, Sedivy JM. Cancer Res. 2001;61:1178–1186. [PubMed] [Google Scholar]
- Dominguez-Sola D, Ying CY, Grandori C, Ruggiero L, Chen B, Li M, Galloway DA, Gu W, Gautier J, Dalla-Favera R. Nature. 2007;448:445–451. doi: 10.1038/nature05953. [DOI] [PubMed] [Google Scholar]
- Eilers M, Eisenman RN. Genes Dev. 2008;22:2755–2766. doi: 10.1101/gad.1712408. [DOI] [PMC free article] [PubMed] [Google Scholar]
- Fernandez PC, Frank SR, Wang L, Schroeder M, Liu S, Greene J, Cocito A, Amati B. Genes Dev. 2003;17:1115–1129. doi: 10.1101/gad.1067003. [DOI] [PMC free article] [PubMed] [Google Scholar]
- Grandori C, Wu KJ, Fernandez P, Ngouenet C, Grim J, Clurman BE, Moser MJ, Oshima J, Russell DW, Swisshelm K, et al. Genes Dev. 2003;17:1569–1574. doi: 10.1101/gad.1100303. [DOI] [PMC free article] [PubMed] [Google Scholar]
- Green DR, Evan GI. Cancer Cell. 2002;1:19–30. doi: 10.1016/s1535-6108(02)00024-7. [DOI] [PubMed] [Google Scholar]
- Lotterman CD, Kent OA, Mendell JT. Cell Cycle. 2008;7:2493–2499. doi: 10.4161/cc.7.16.6452. [DOI] [PMC free article] [PubMed] [Google Scholar]
- Murphy DJ, Junttila MR, Pouyet L, Karnezis A, Shchors K, Bui DA, Brown-Swigart L, Johnson L, Evan GI. Cancer Cell. 2008;14:447–457. doi: 10.1016/j.ccr.2008.10.018. this issue. [DOI] [PMC free article] [PubMed] [Google Scholar]
- Orian A, van Steensel B, Delrow J, Bussemaker HJ, Li L, Sawado T, Williams E, Loo LM, Cowley SM, Yost C, et al. Genes Dev. 2003;17:1101–1114. doi: 10.1101/gad.1066903. [DOI] [PMC free article] [PubMed] [Google Scholar]
- Zeller KI, Zhao X, Lee CWH, Chiu KP, Yao F, Yustein JT, Ooi HS, Orlov YL, Shahab A, Yong HC, et al. Proc Natl Acad Sci USA. 2006;103:17834–17839. doi: 10.1073/pnas.0604129103. [DOI] [PMC free article] [PubMed] [Google Scholar]